

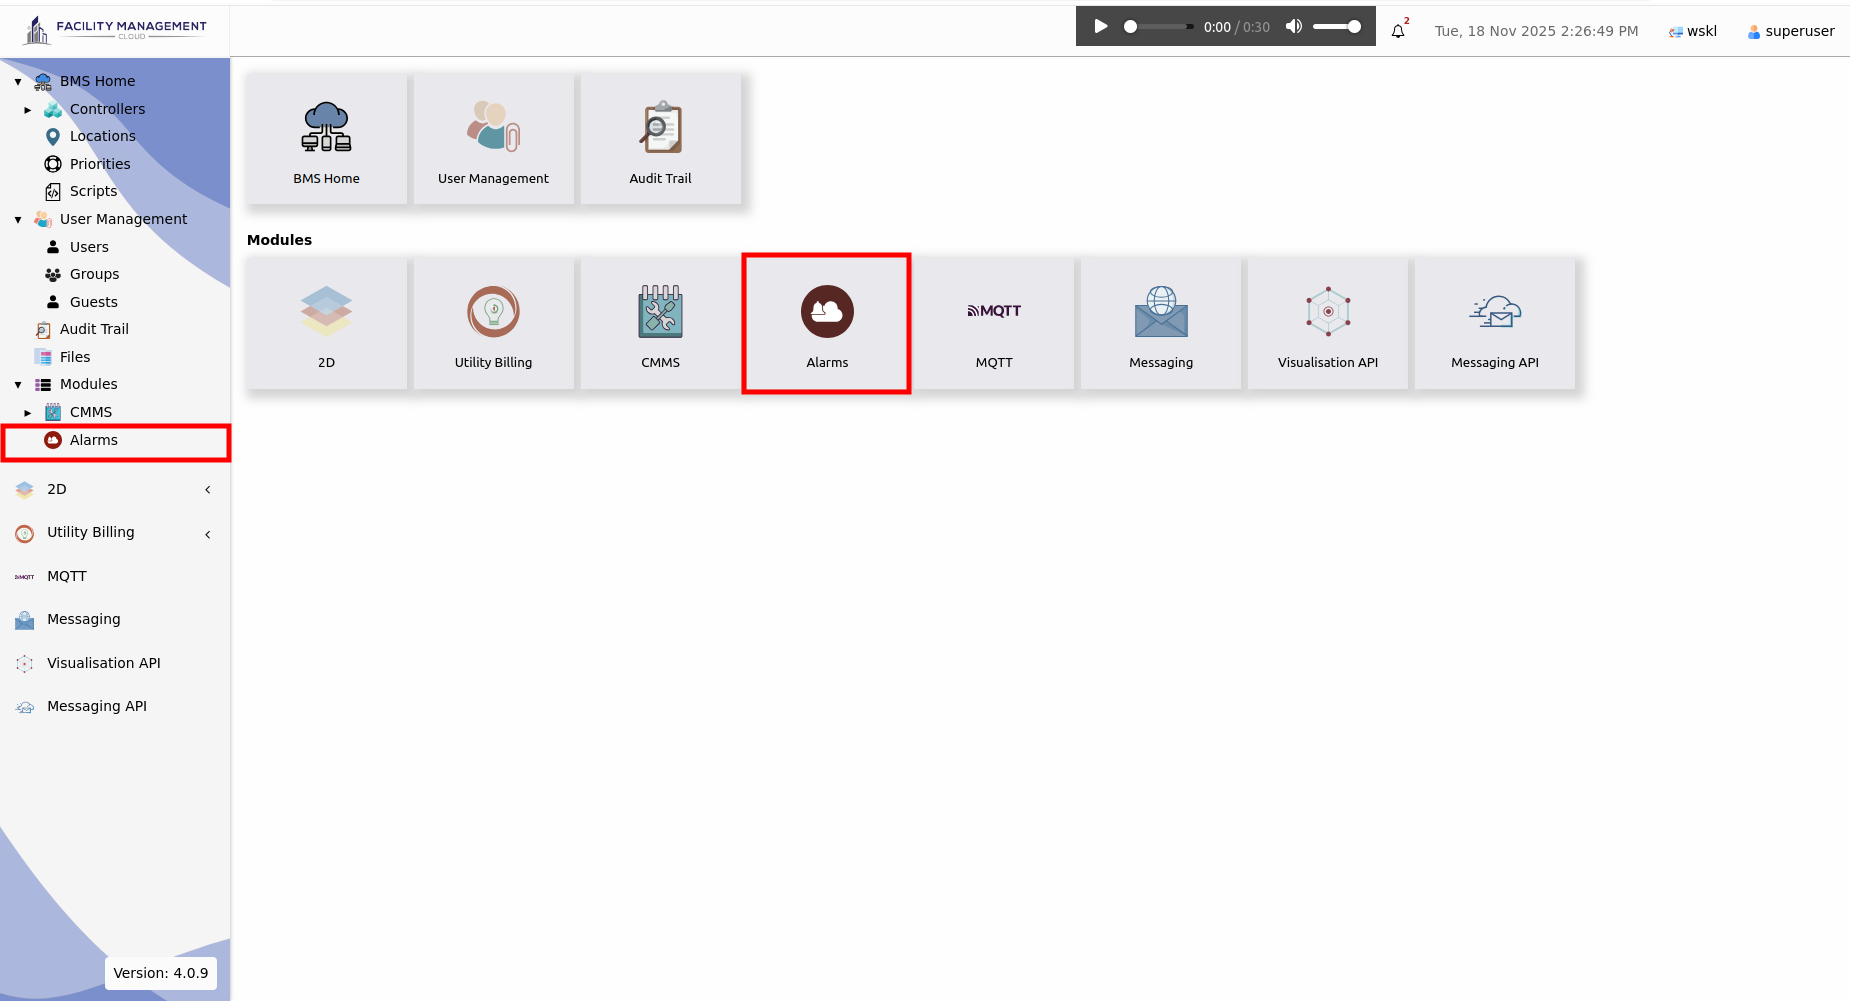
The Alarm module is a crucial component of the FMCC system that enables effective monitoring and management of alarms. It provides a comprehensive set of tools and features to handle alarm events generated by various IO Points. The module offers a centralised dashboard to view and acknowledge alarms, along with detailed alarm history and analytics for better insights. Overall, the alarm module plays a vital role in ensuring timely detection, response, and resolution of critical events, enhancing the overall operational efficiency and safety of the monitored systems.
The alarms interface should be shown as shown in the image below:
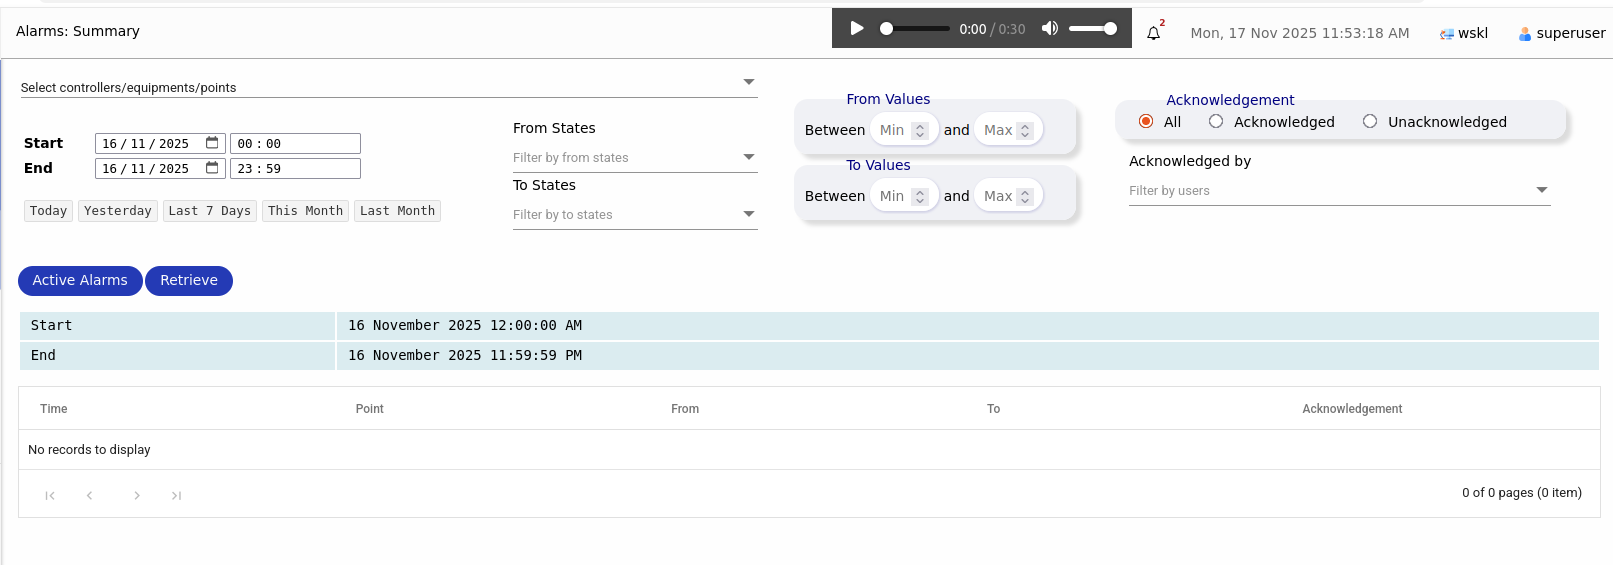
Firstly, users can filter out specific IO Points by selecting them from the device. This allows users to narrow down their focus and view only the relevant IO Points that they are interested in. his filtering capability enhances efficiency and enables users to quickly access the information they need without being overwhelmed by unnecessary data.
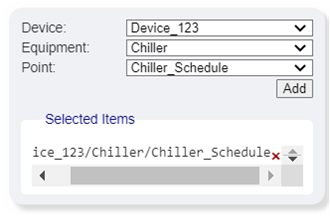
To filter by IO points, follow these procedures:
To delete the selected items, simply click on the (x) symbol located at the left of the item's location. Please note that if you would like to add multiple IO points, you will need to repeat the procedure and add each IO point individually. While it may require additional time and effort, adding each IO point one by one ensures accurate and specific configuration for each point. This allows for precise monitoring and management of individual IO points within your system.
Secondly, users have the ability to filter IO points based on time, allowing them to view the relevant IO points within a specific time interval that has been set. This filtering capability enables users to assess the number of alarms that have been triggered during a particular period. By selecting a specific time range, users can easily track and analyse the alarm events within that timeframe, providing valuable insights into the performance and behavior of the IO points over time.
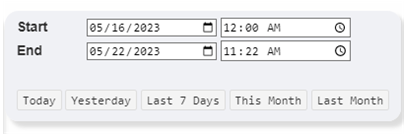
To filter based on time, follow these procedures:
At the specified time setting, users have the option to conveniently set the time interval by clicking on buttons such as "Today," "Yesterday," "Last 7 Days," and more. These predefined time intervals provide users with quick and easy access to commonly used time ranges for filtering alarms.
Thirdly, users have the capability to filter out specific IO Points based on their changing state. This feature allows users to precisely specify the initial and final state of the IO Points, enabling them to focus on monitoring specific state transitions. By setting the desired initial and final states, users can effectively narrow down their view to only the IO Points that undergo the specified state changes. This level of granularity in filtering provides users with greater control and visibility over the status and behavior of their IO Points, facilitating effective monitoring and analysis.

To filter based on changing state, follow these procedures:
Fourthly, users can further refine their filtering by entering specific values for the IO Points. This allows for a more precise selection of IO Points based on the desired value range or specific criteria. By entering the values, users can narrow down the results to only include the IO Points that meet their specified requirements. This level of customisation enhances the filtering capabilities and enables users to focus on the IO Points that are most relevant to their needs.
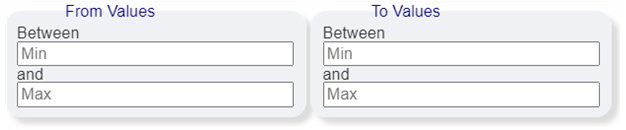
To filter based on values, follow these procedures:
By specifying the desired range of values, you can effectively filter the IO points based on the specified values.
Users have the ability to filter their selected IO points based on the acknowledgement status. They can choose to filter out IO points that have been acknowledged or those that are yet to be acknowledged. This filtering option allows users to focus on specific IO points that require attention or further action.
Furthermore, users can selectively filter out IO points that have been acknowledged by a specific user. This feature enables users to track the acknowledgement status of IO points assigned to different individuals or teams. By filtering IO points based on the acknowledging user, users can easily identify the responsible parties and monitor the progress of issue resolution or task completion.

To filter by acknowledgement status, follow these steps:
The alarms history feature provides users with a comprehensive record of all previously triggered alarms. It allows users to access and review the historical data of alarms, including the date, time, and details of each alarm event. By accessing the alarms history, users can gain insights into the patterns and trends of alarm occurrences over time. This information can be valuable for analysing the performance of systems, identifying recurring issues, and making informed decisions for improvement. The alarms history feature enables users to track and monitor the alarm events effectively, ensuring a thorough understanding of the facility's operational status and facilitating proactive maintenance and troubleshooting.
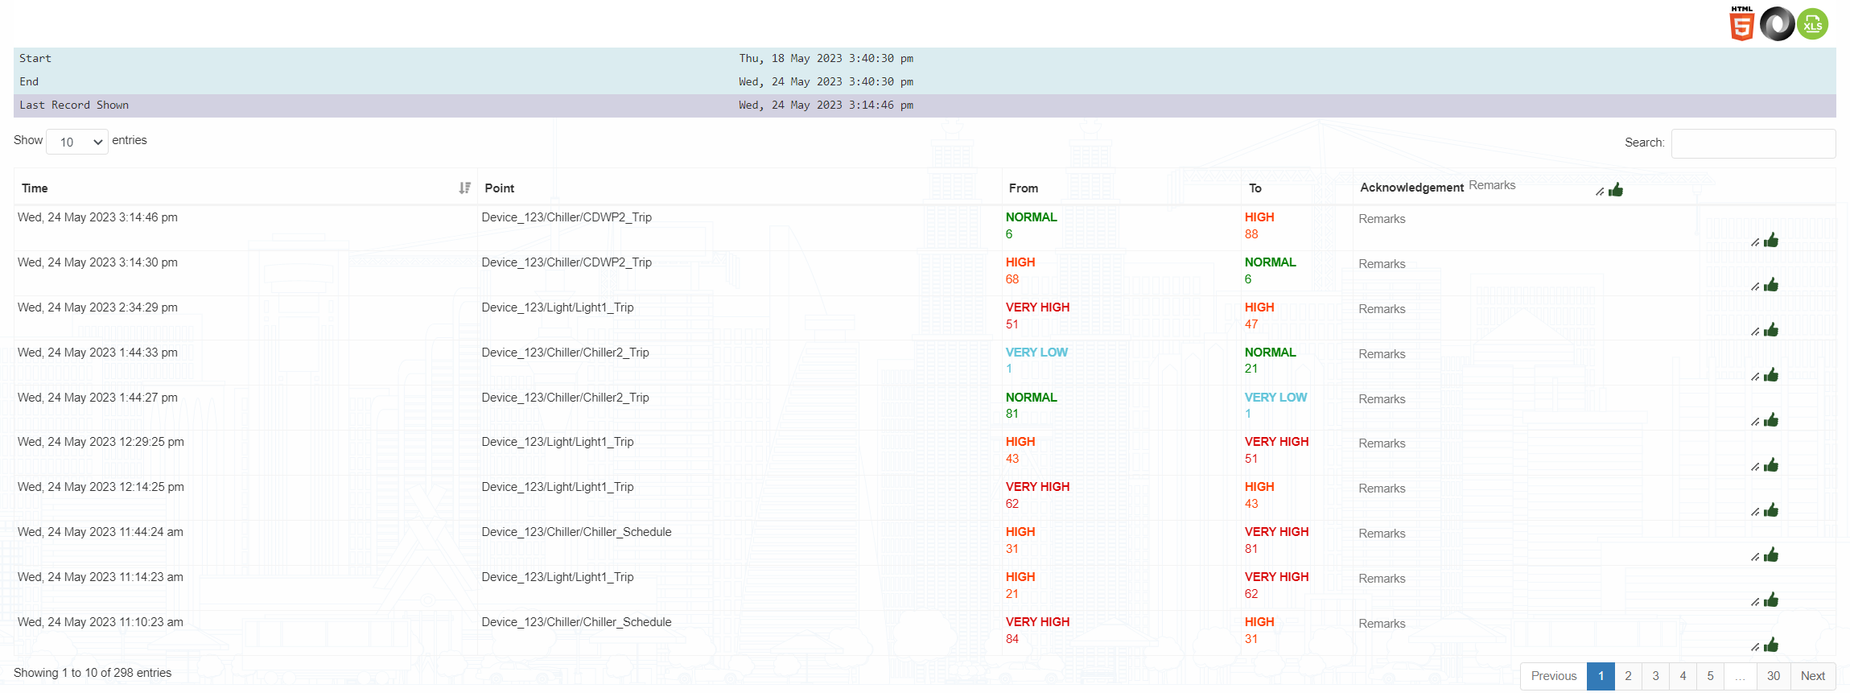
When the state of the IO points undergoes a change, such as transitioning from an abnormal state to a normal state or vice versa, the alarm status and relevant information are triggered and displayed at the bottom of the interface. This real-time notification system ensures that users are promptly informed about any significant changes or anomalies in the IO points' status. It enables quick detection and response to critical events, allowing users to take appropriate actions to address the situation. By providing immediate visibility into the alarm status, the system helps users stay vigilant and ensures effective monitoring of the IO points' conditions.

To acknowledge an alarm, users have the option to provide remarks before acknowledging it. By clicking on the thumbnail icon associated with the alarm, users can initiate the acknowledgment process. This feature allows users to add relevant remarks or comments to the alarm, providing additional context or information related to the acknowledgment. By acknowledging the alarm, users confirm that they are aware of the issue and are taking responsibility for addressing it. The ability to add remarks enhances communication and collaboration among users, facilitating effective alarm management and resolution.
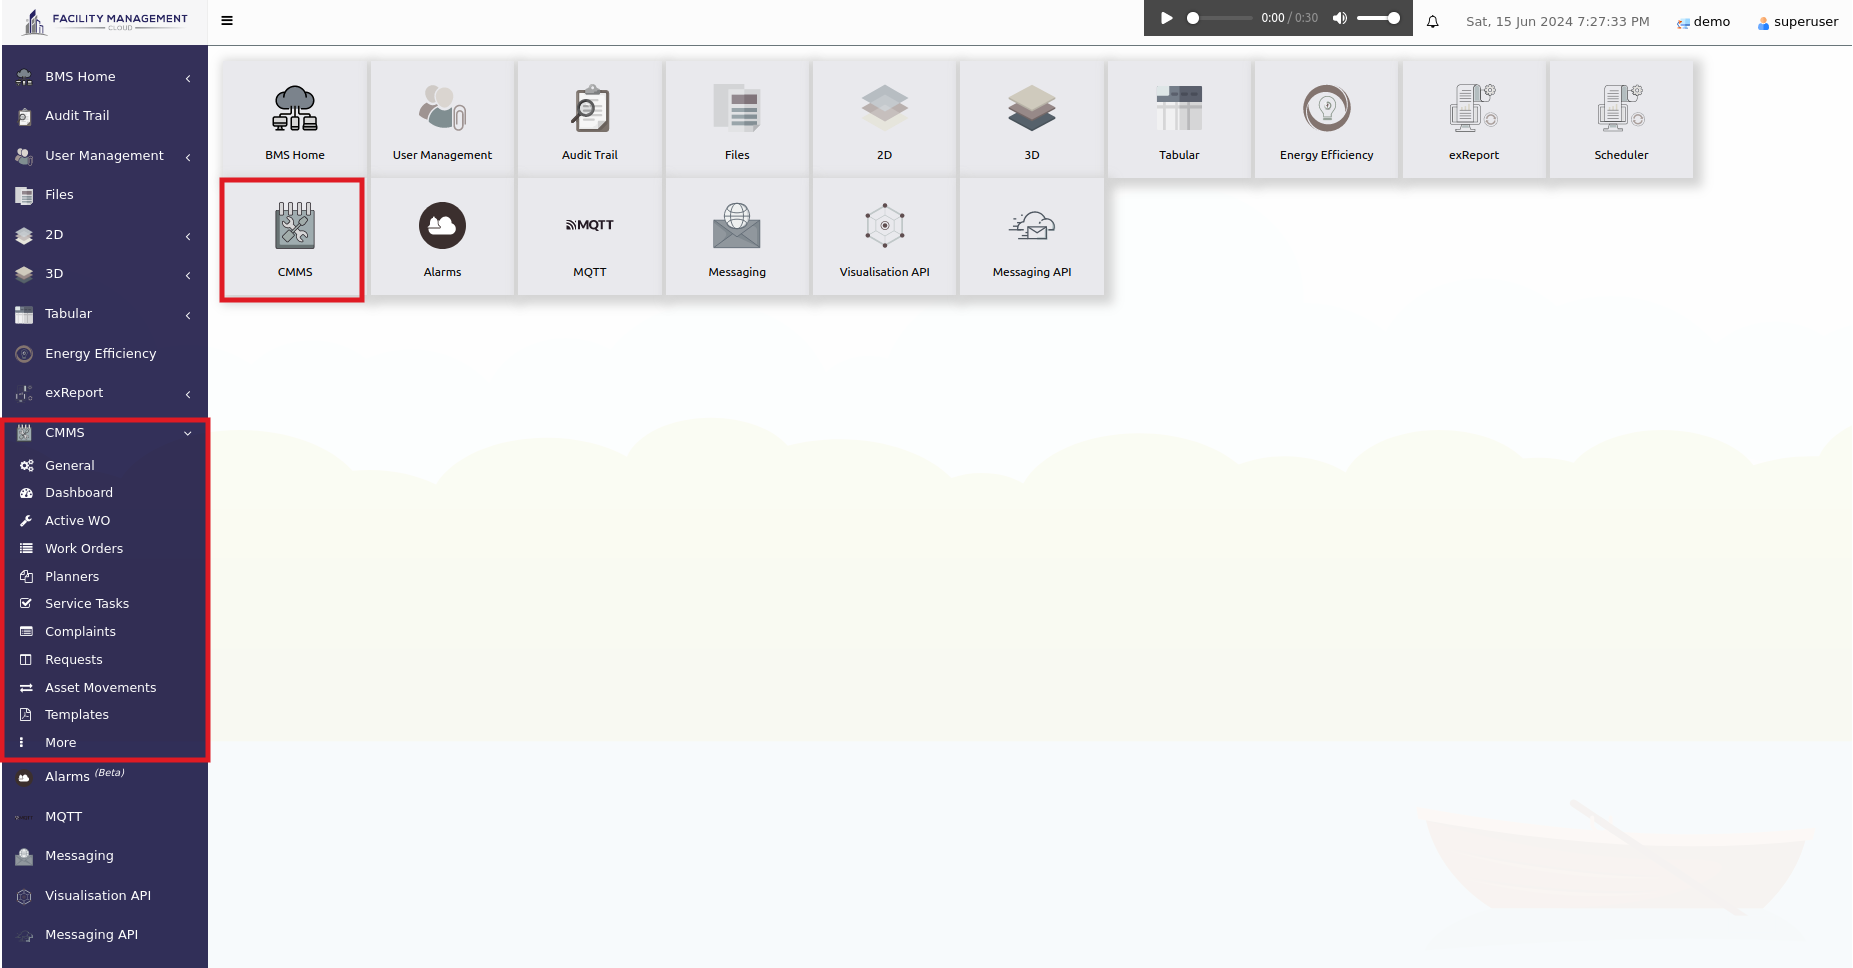
CMMS stands for "Computerised Maintenance Management System". It is a software-based solution used by organisations to effectively manage and optimise their maintenance operations for assets and equipment. CMMS provides a centralised platform that facilitates various maintenance-related tasks, including work order management, asset tracking, preventive maintenance scheduling, inventory control, and maintenance reporting.
The primary goal of CMMS is to streamline maintenance processes, improve equipment reliability, and extend the lifespan of assets while reducing operational costs. By utilising computer technology and data management capabilities, CMMS helps maintenance teams efficiently plan, execute, and track maintenance activities, ensuring that assets are properly maintained, repairs are promptly addressed, and preventive maintenance tasks are performed in a timely manner.
CMMS offers several key benefits, such as increased productivity, reduced downtime, better resource allocation, and improved compliance with safety and regulatory standards. It also enables better decision-making through data-driven insights and facilitates the efficient management of spare parts and maintenance inventory.
In summary, CMMS is a powerful tool that enhances maintenance management by leveraging software solutions to streamline processes, improve asset performance, and achieve operational excellence for organizations across various industries.
A dashboard serves as a centralised interface within FMCC, offering a comprehensive overview of maintenance tasks. This tool enables facility managers to monitor the status, distribution, and trends of work orders over time, facilitating efficient operations management.
Currently, in our FMC application, we support two type of dashboaard, which are:
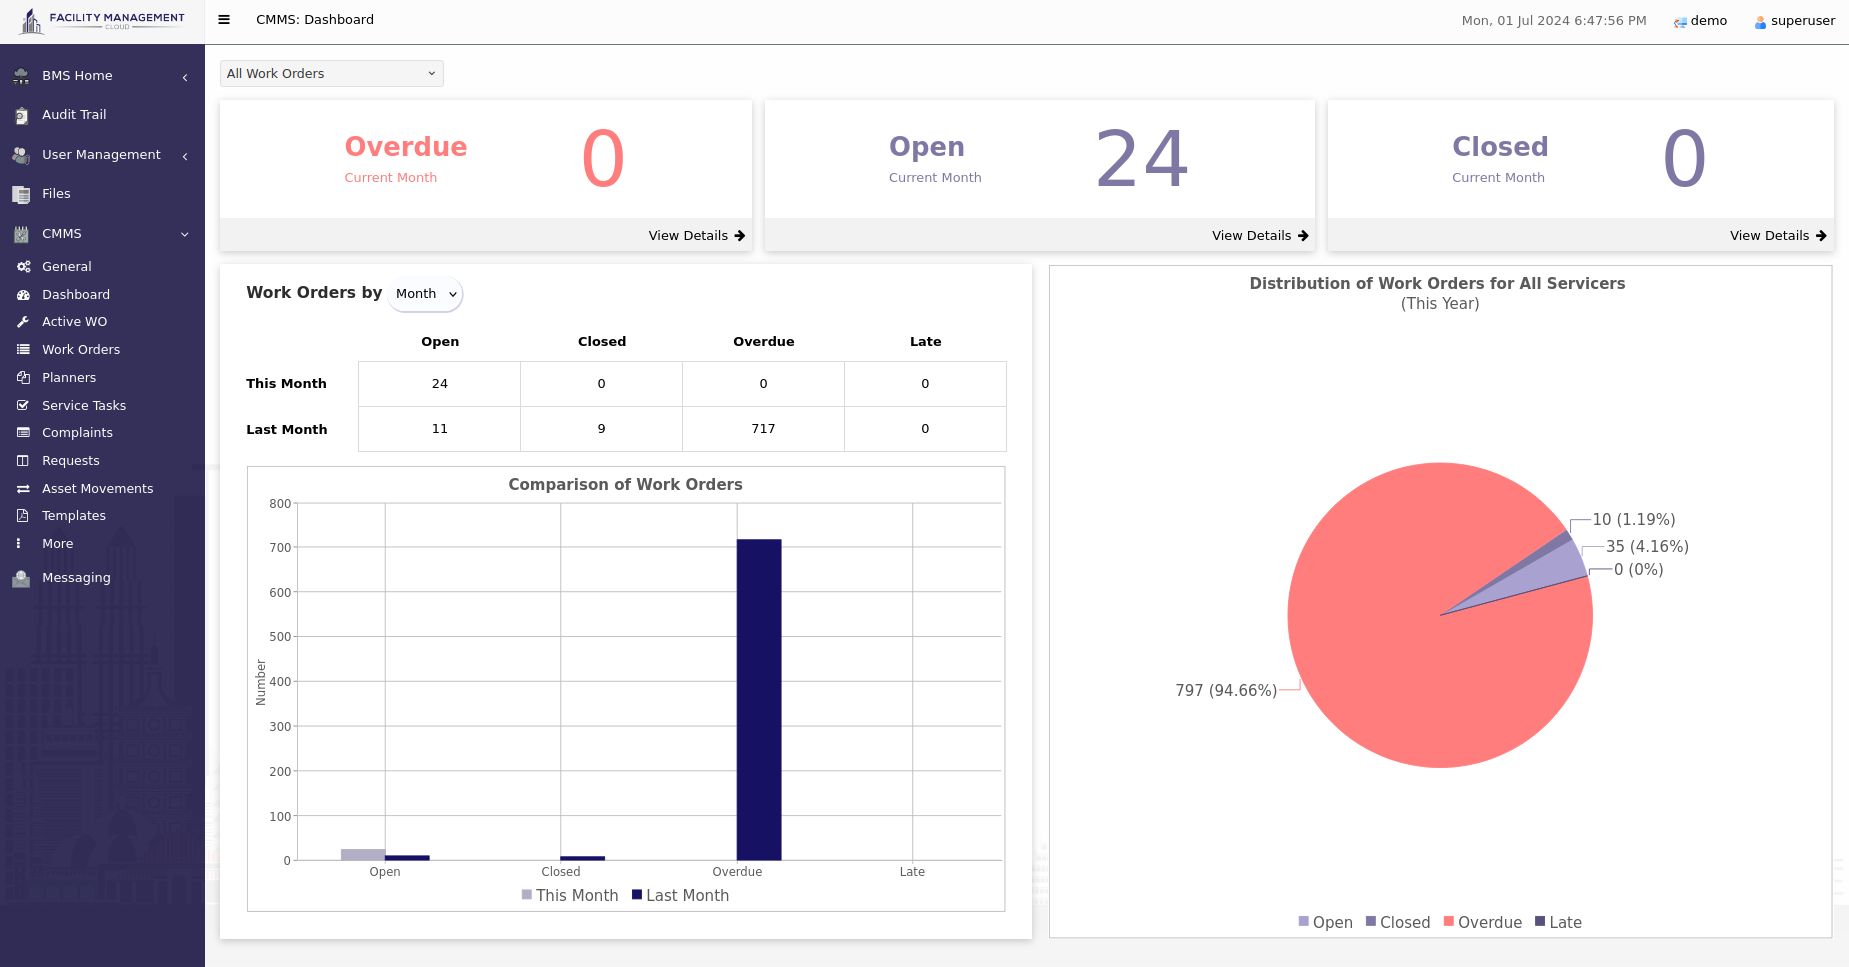
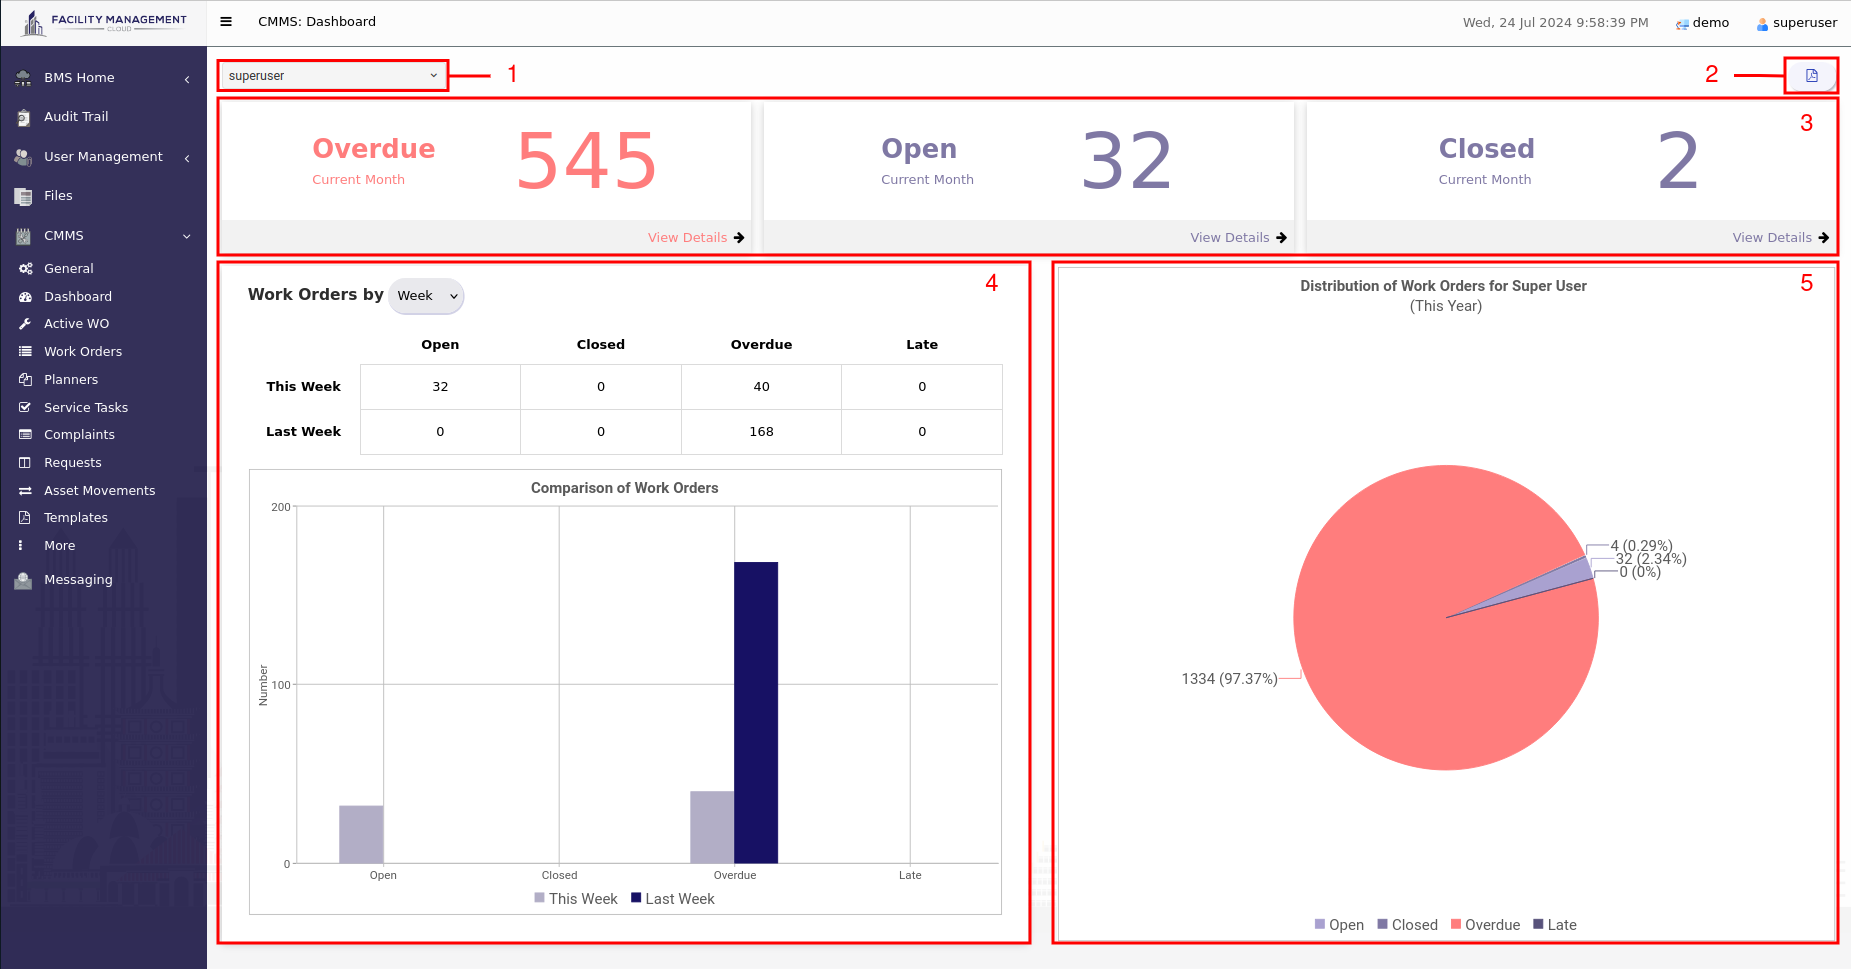
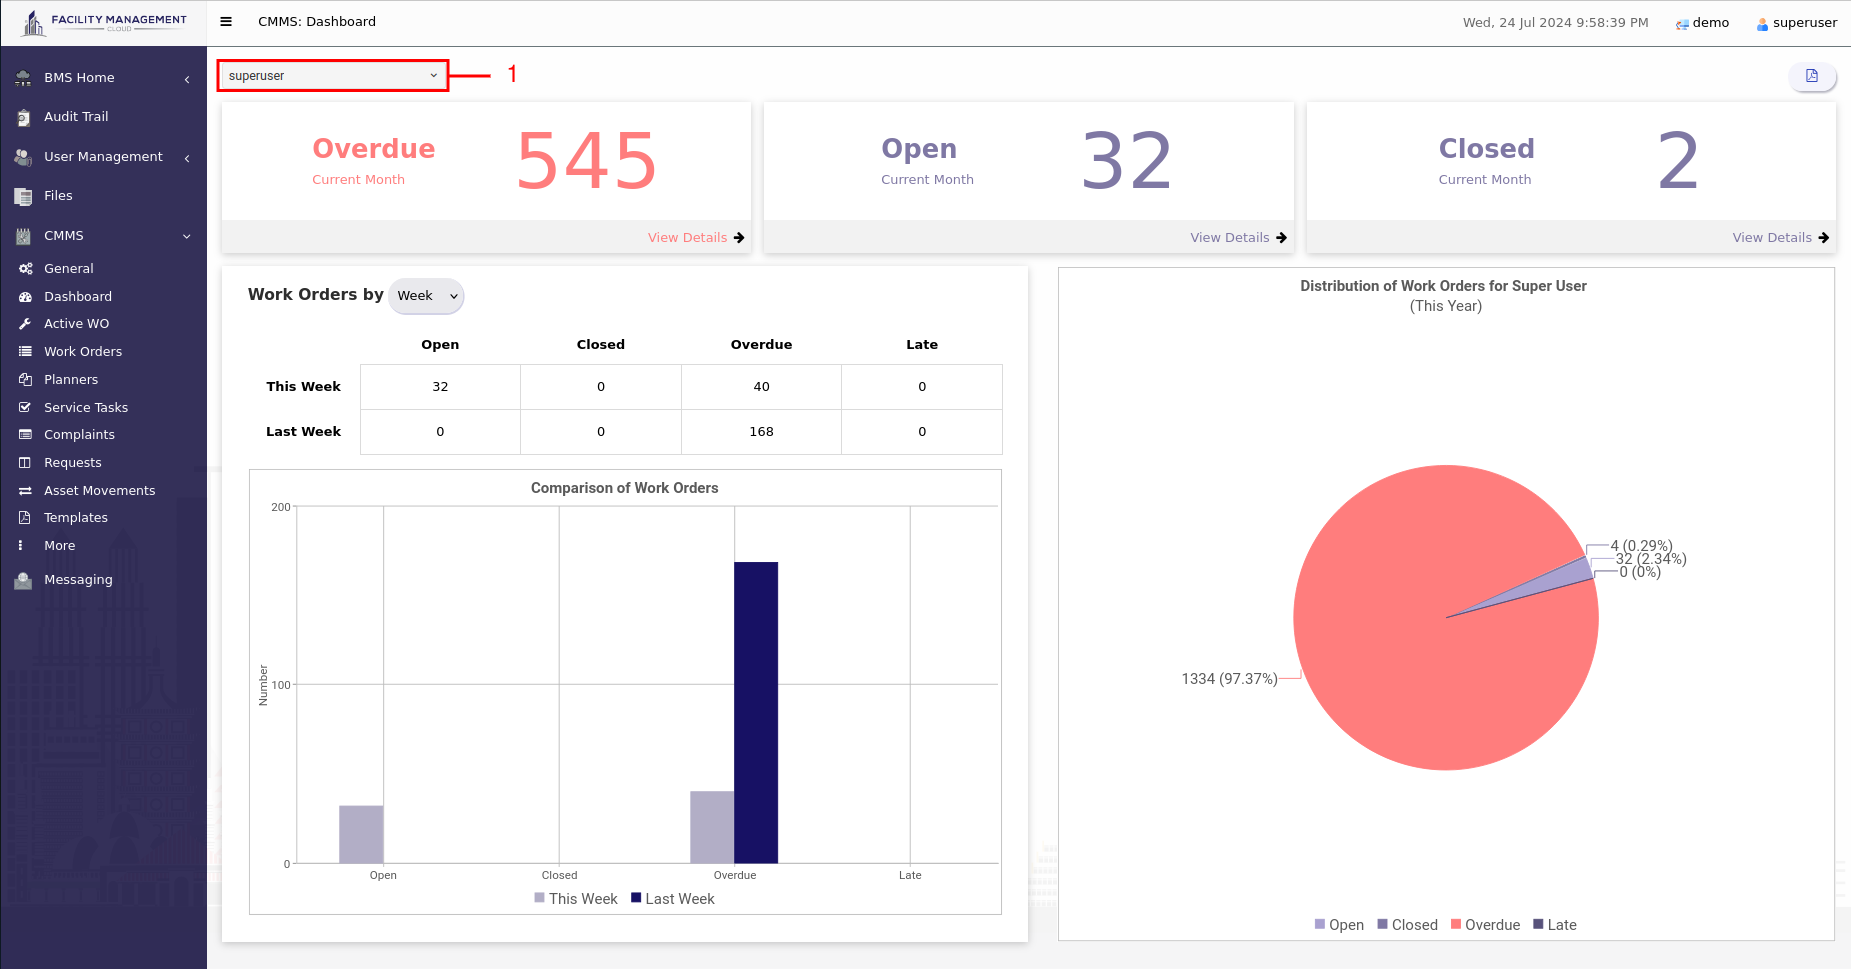
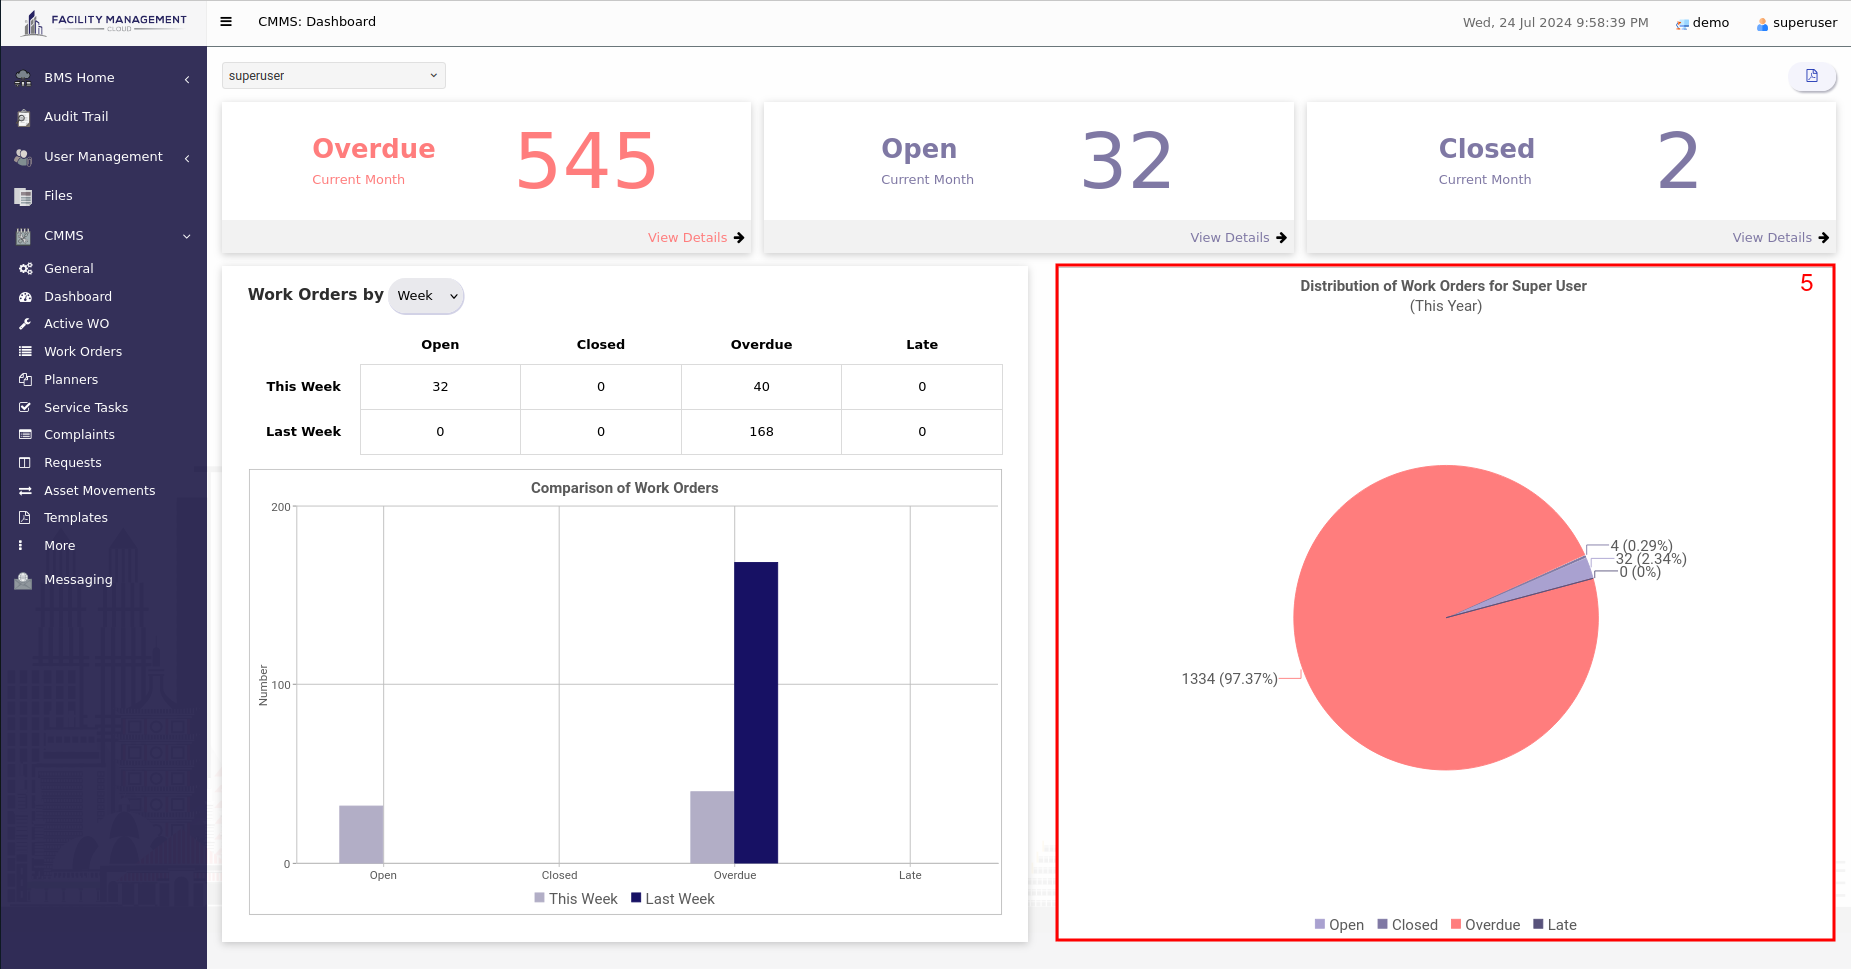
Select a user, and the dashboard will show the work orders that have been or are being handled by that user.
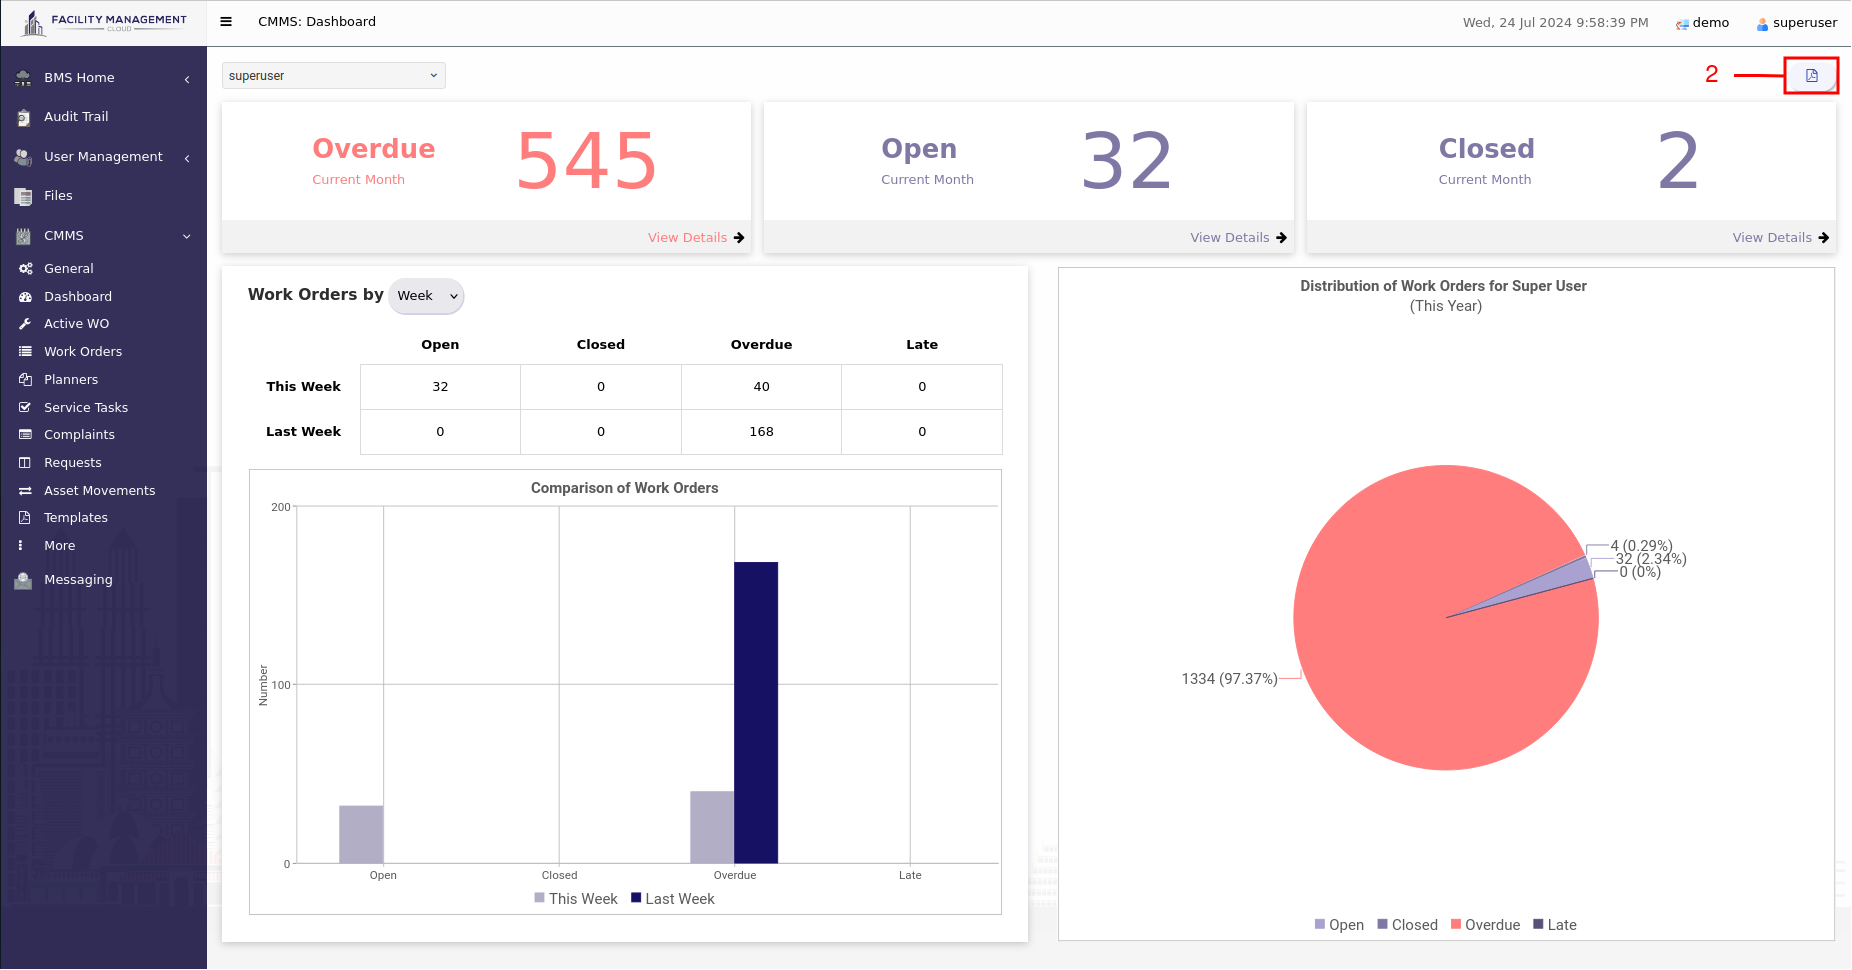
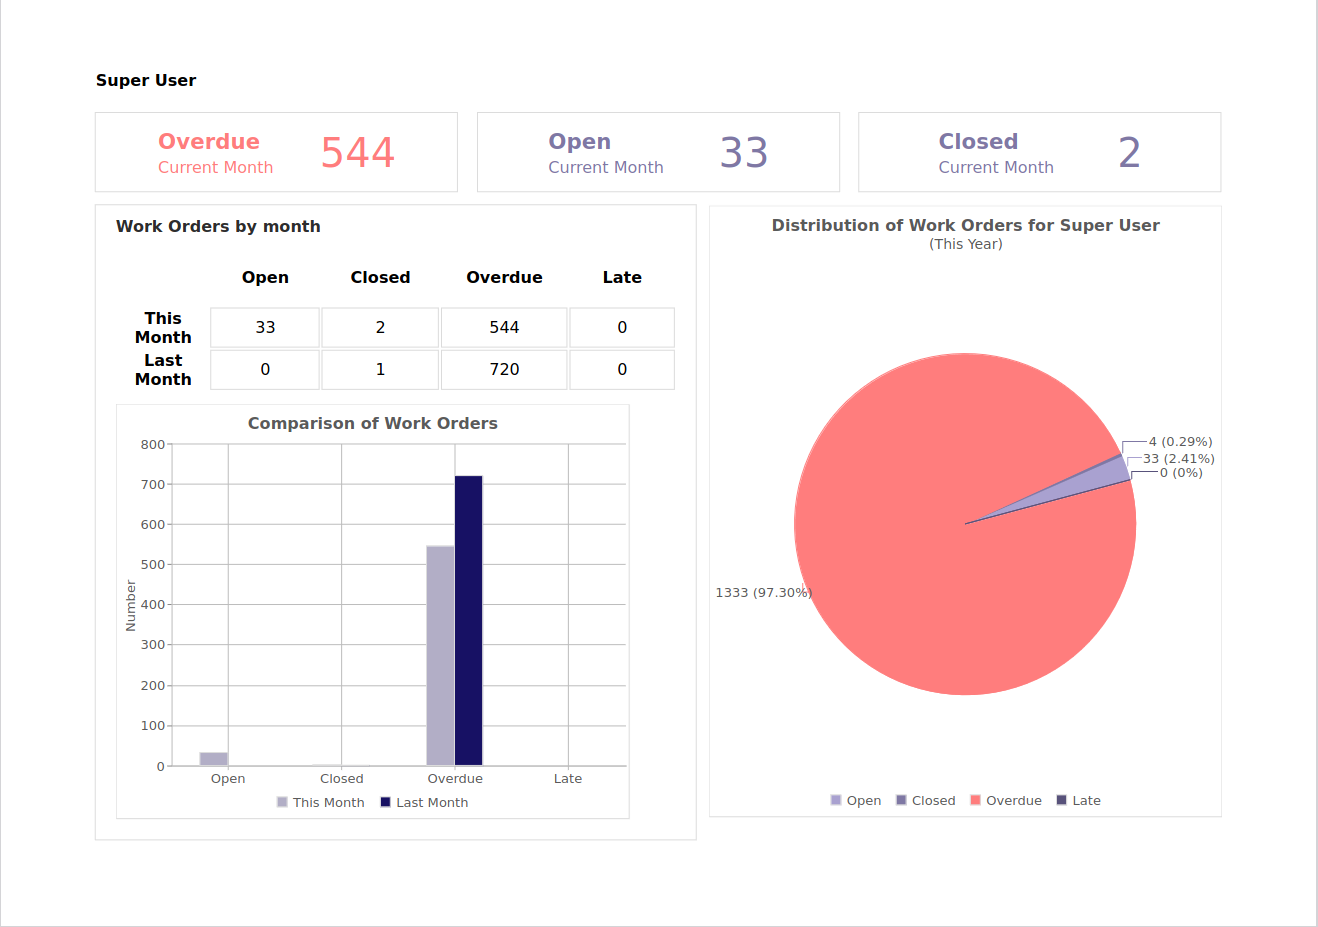
When clicking the report icon in the top right corner, a dashboard report of the user will be generated in PDF format.
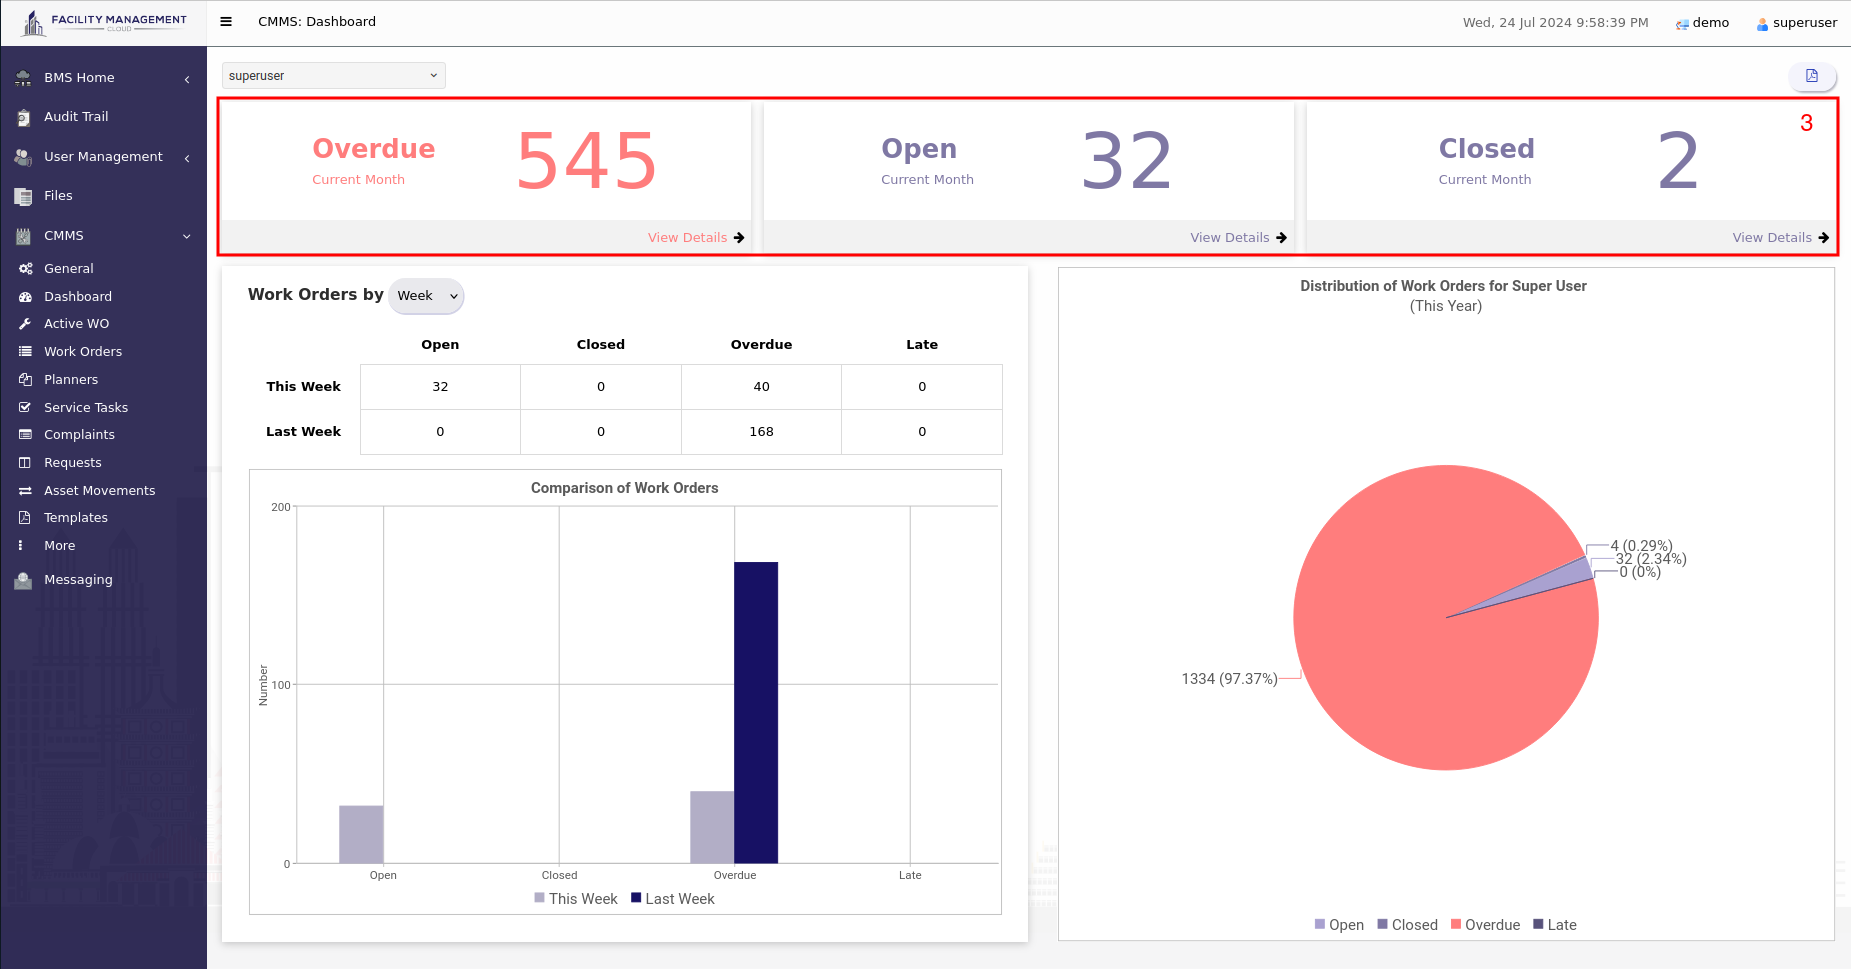
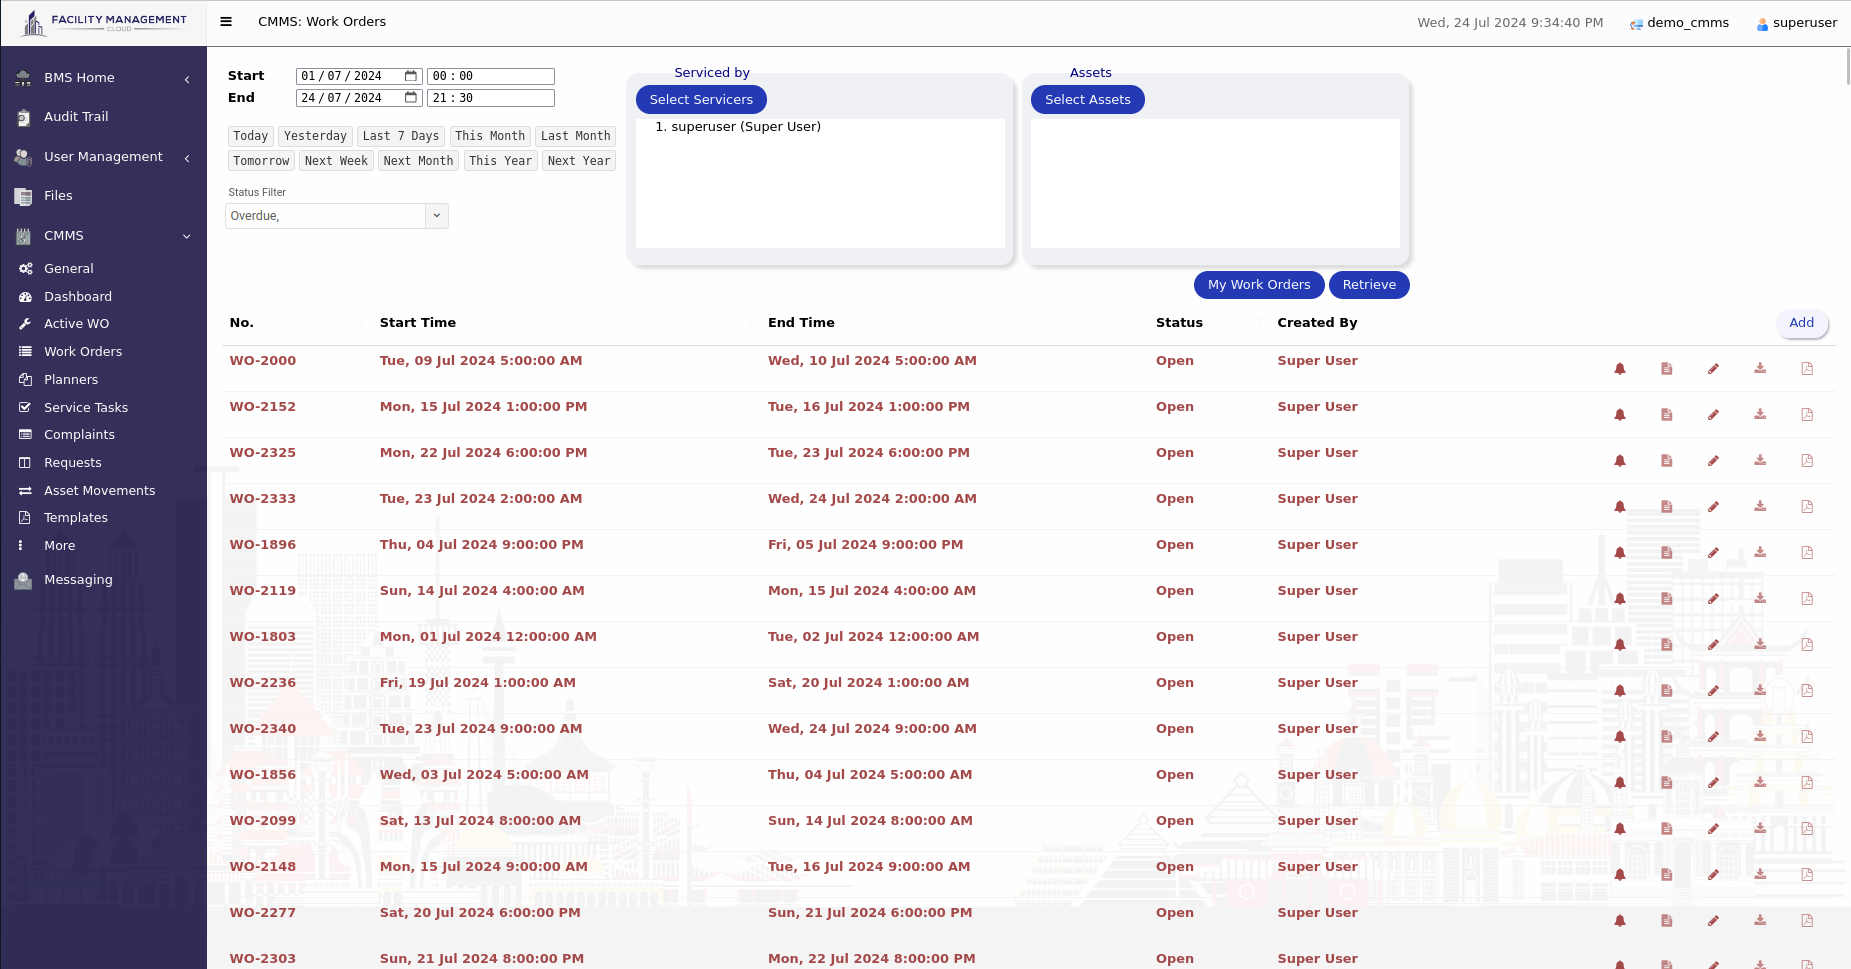
Users can click on the "View Detail" to view to detailed overdue, opened or closed work orders that handled by the selected user in the work order section within current month.
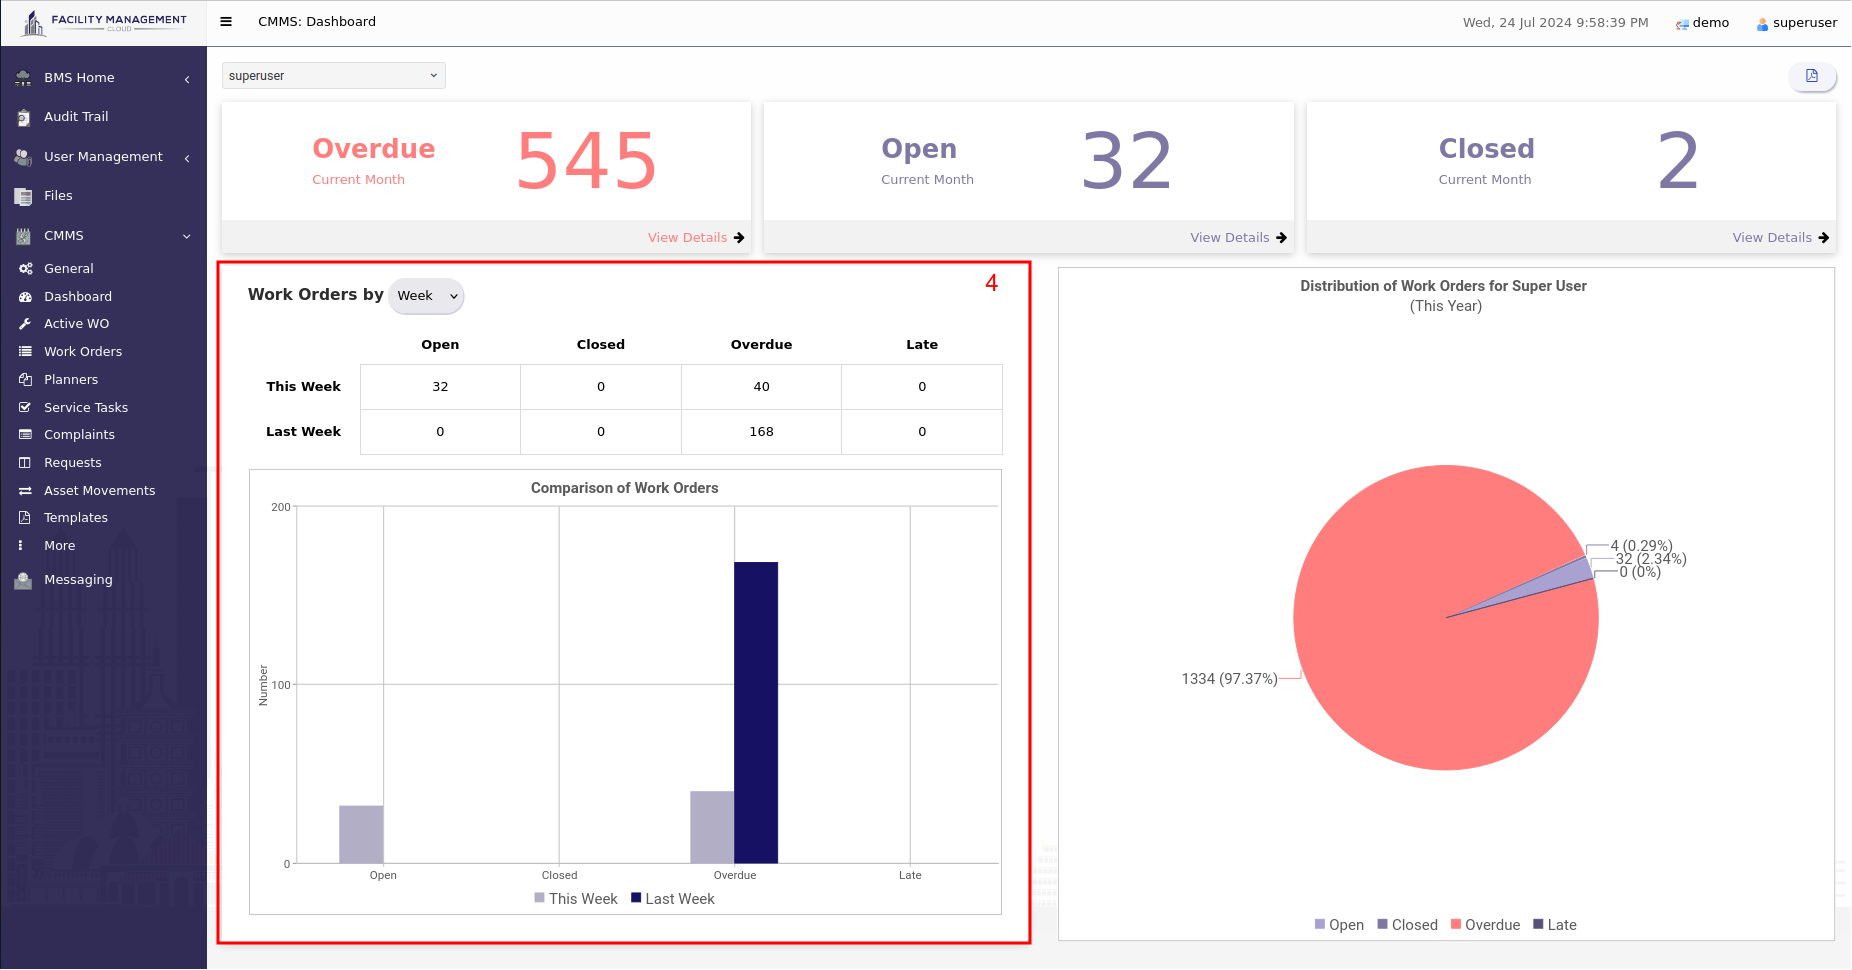
Users can select a day, week, month, or year to compare with the corresponding period from the previous time frame.
Users can view the work orders handled by the selected user within the current year.
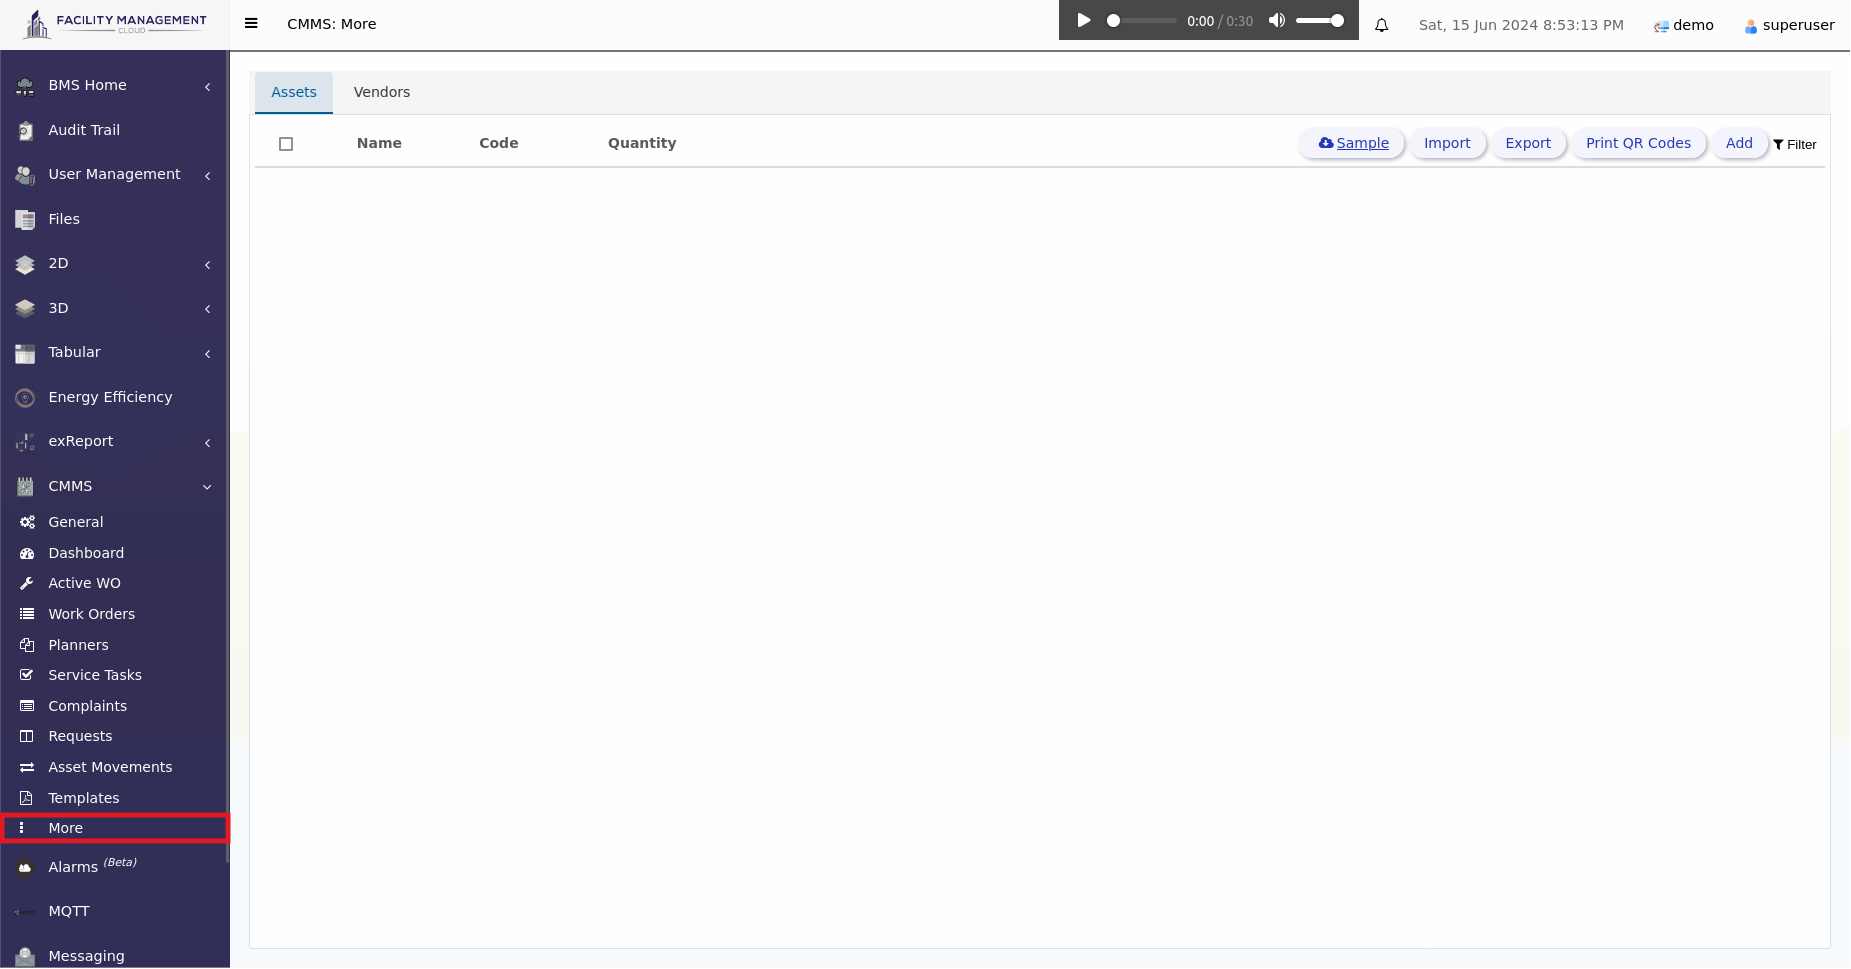
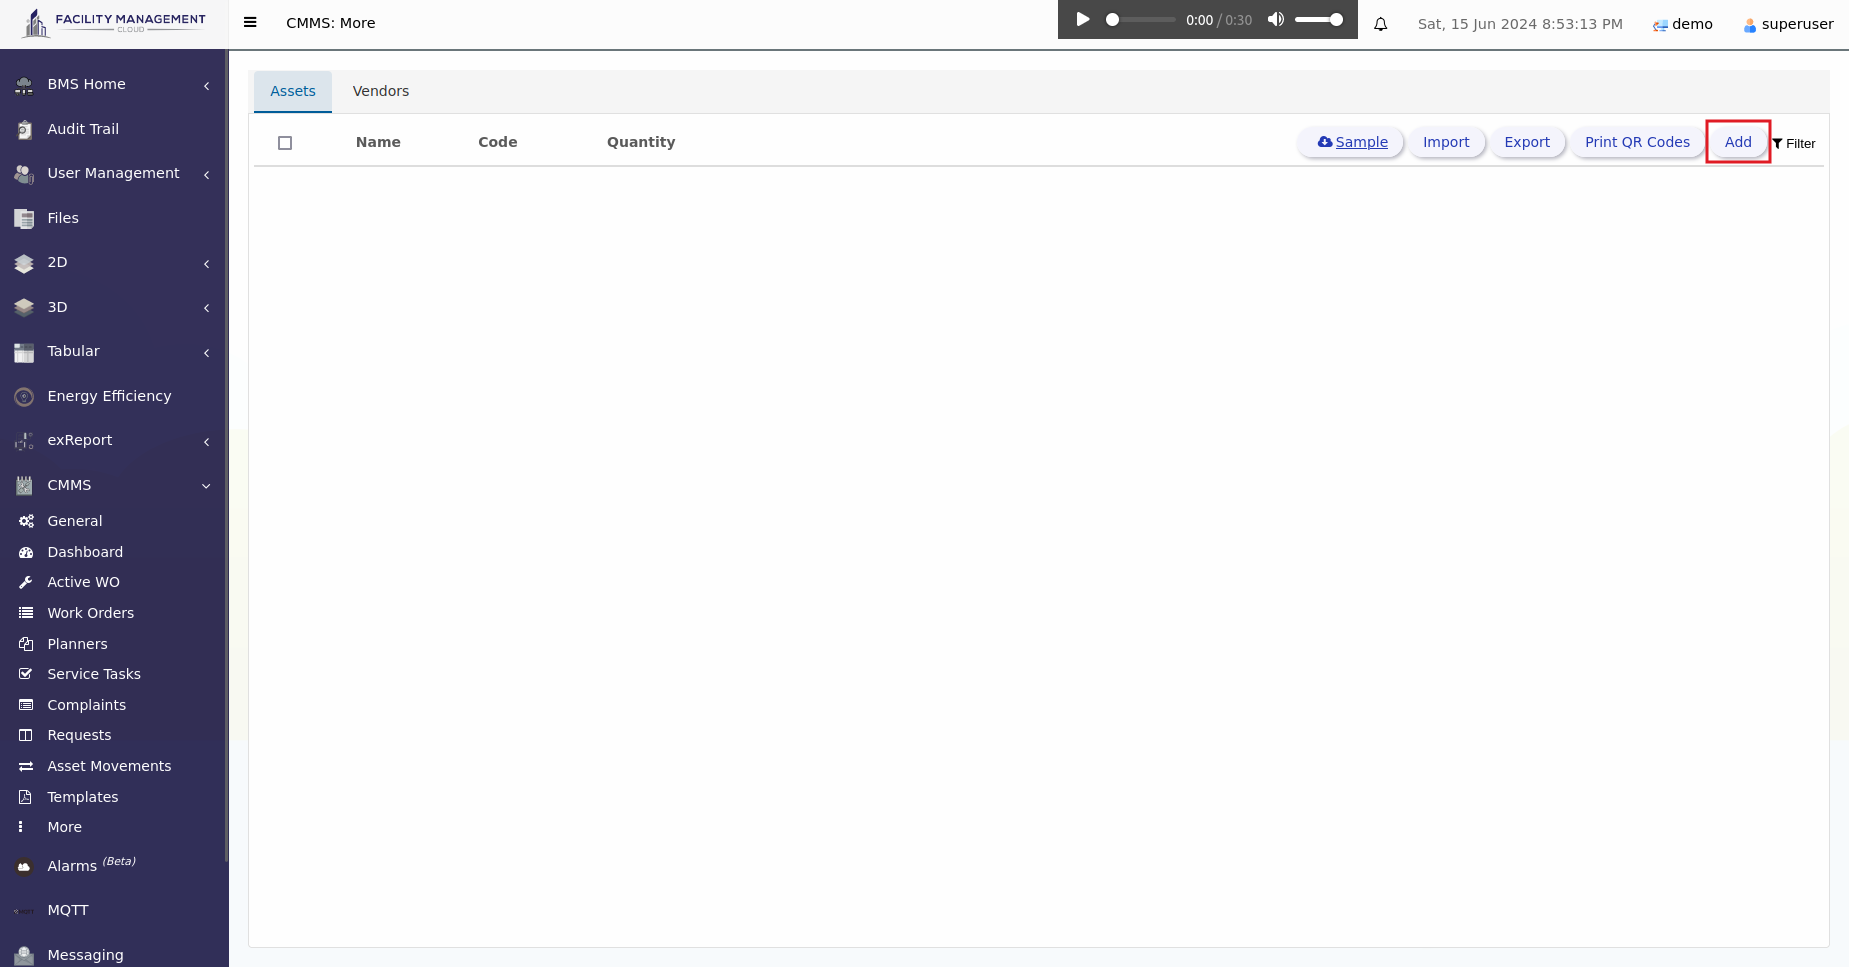
Assets in a CMMS are tangible resources requiring regular maintenance. They include equipment, machinery, vehicles, infrastructure, and facilities. CMMS feature helps track and manage assets by recording details, maintenance history, and work orders. It enables preventive maintenance scheduling and monitoring asset performance. Effective asset management in a CMMS improves maintenance efficiency and maximises the value of physical resources.
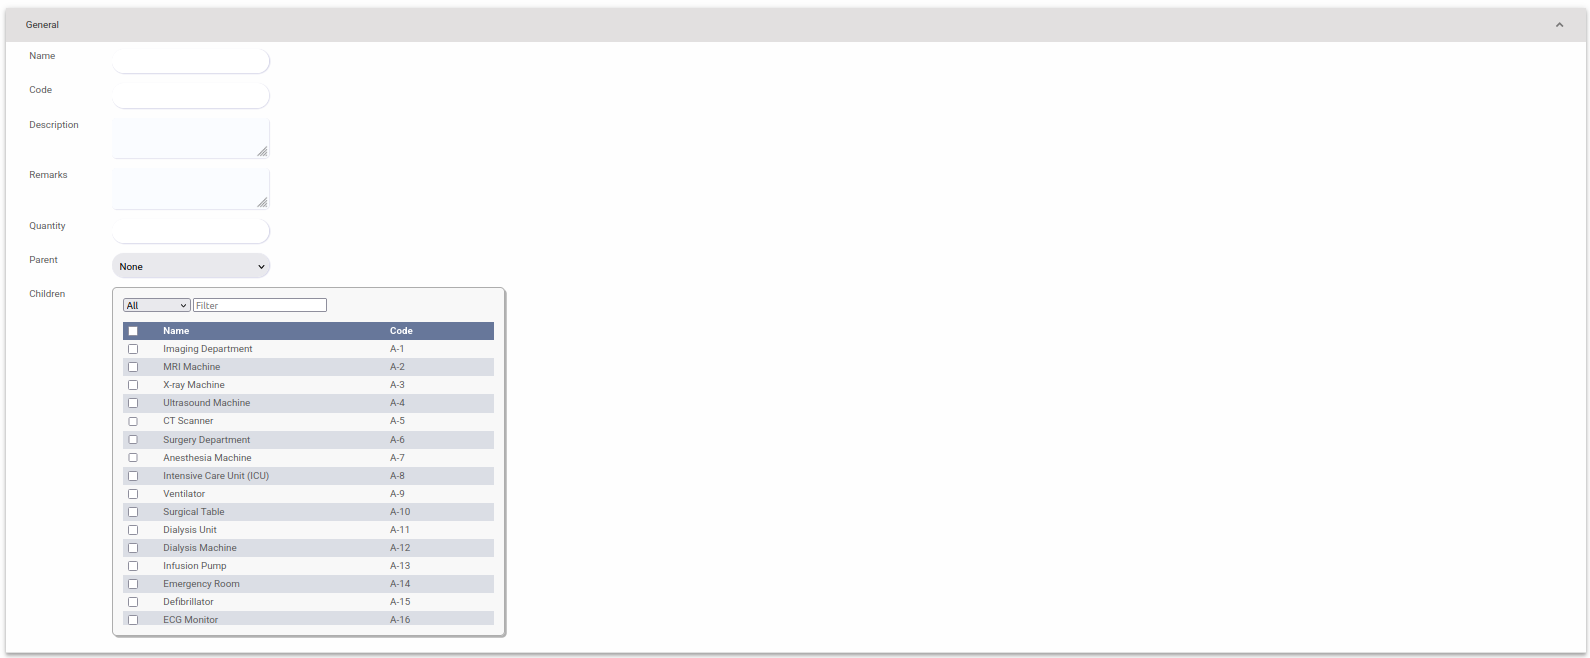



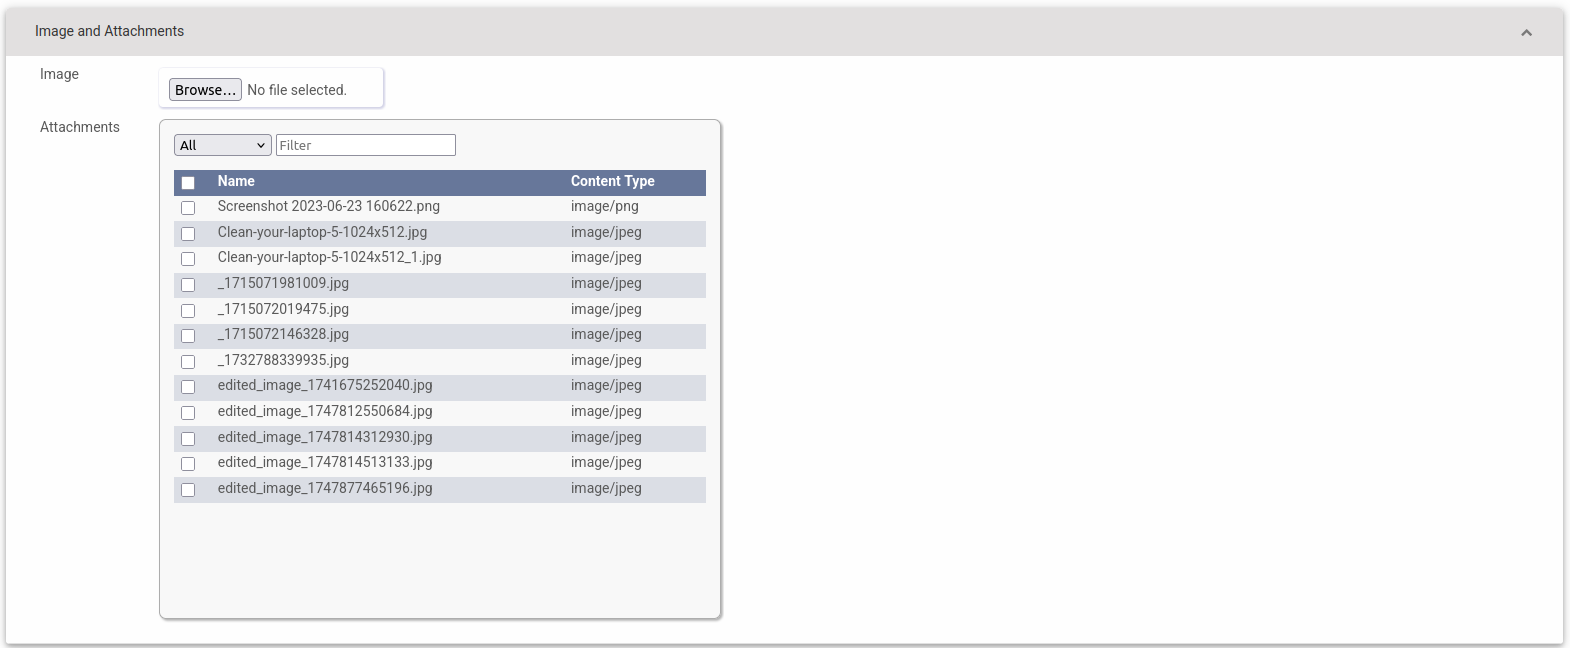
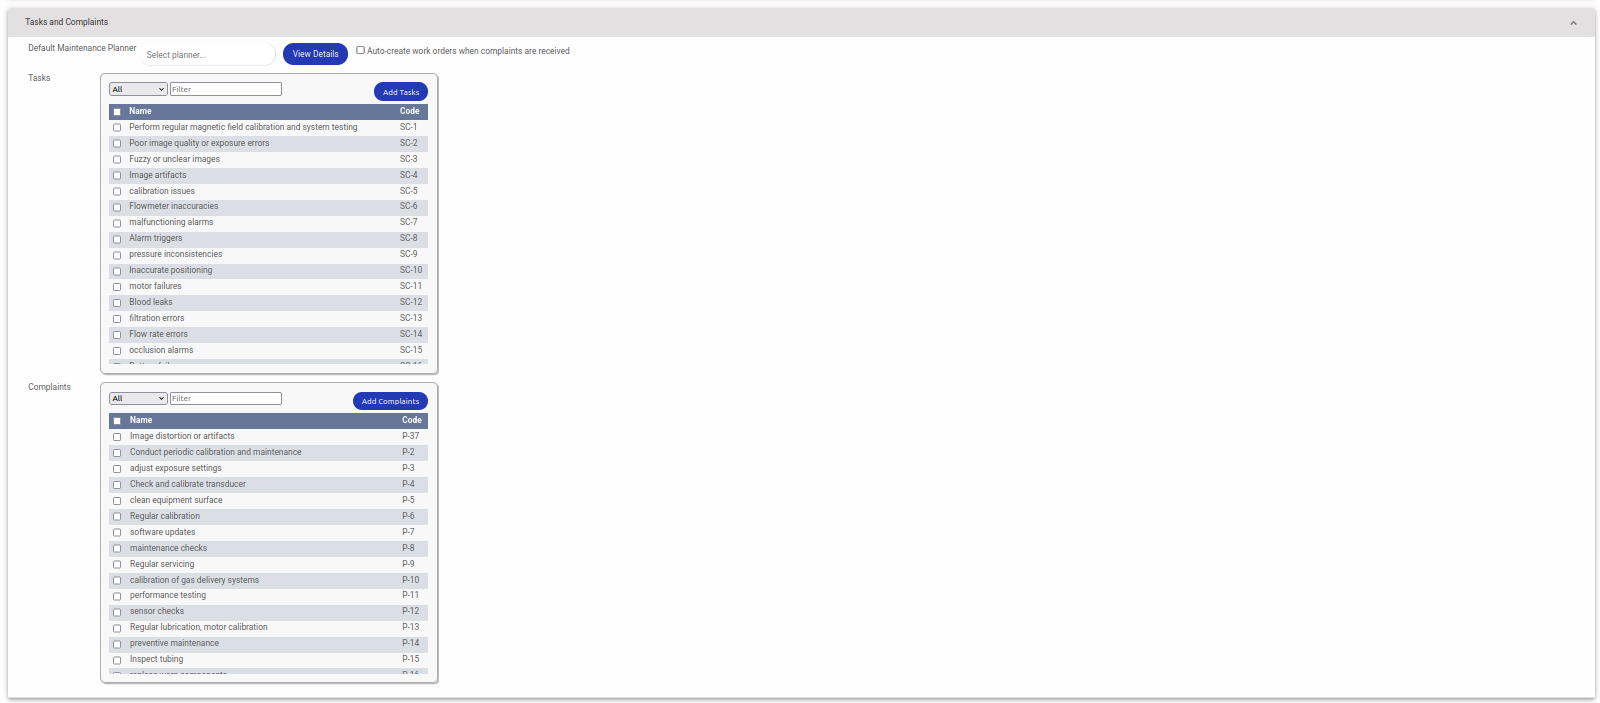
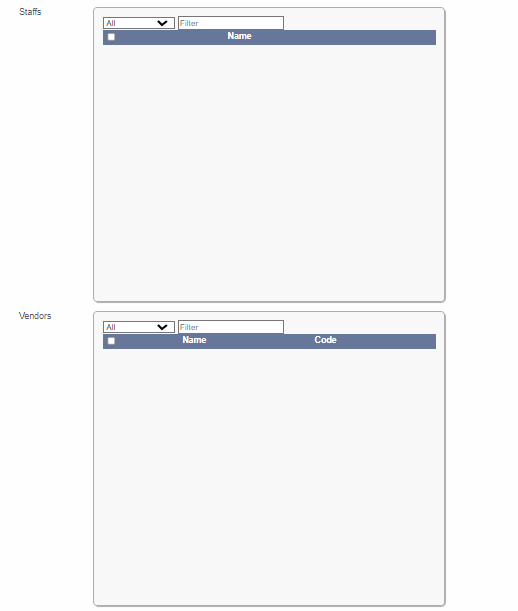
Users can check the checkboxes to associate the classifications, tasks, and complaints with the asset.
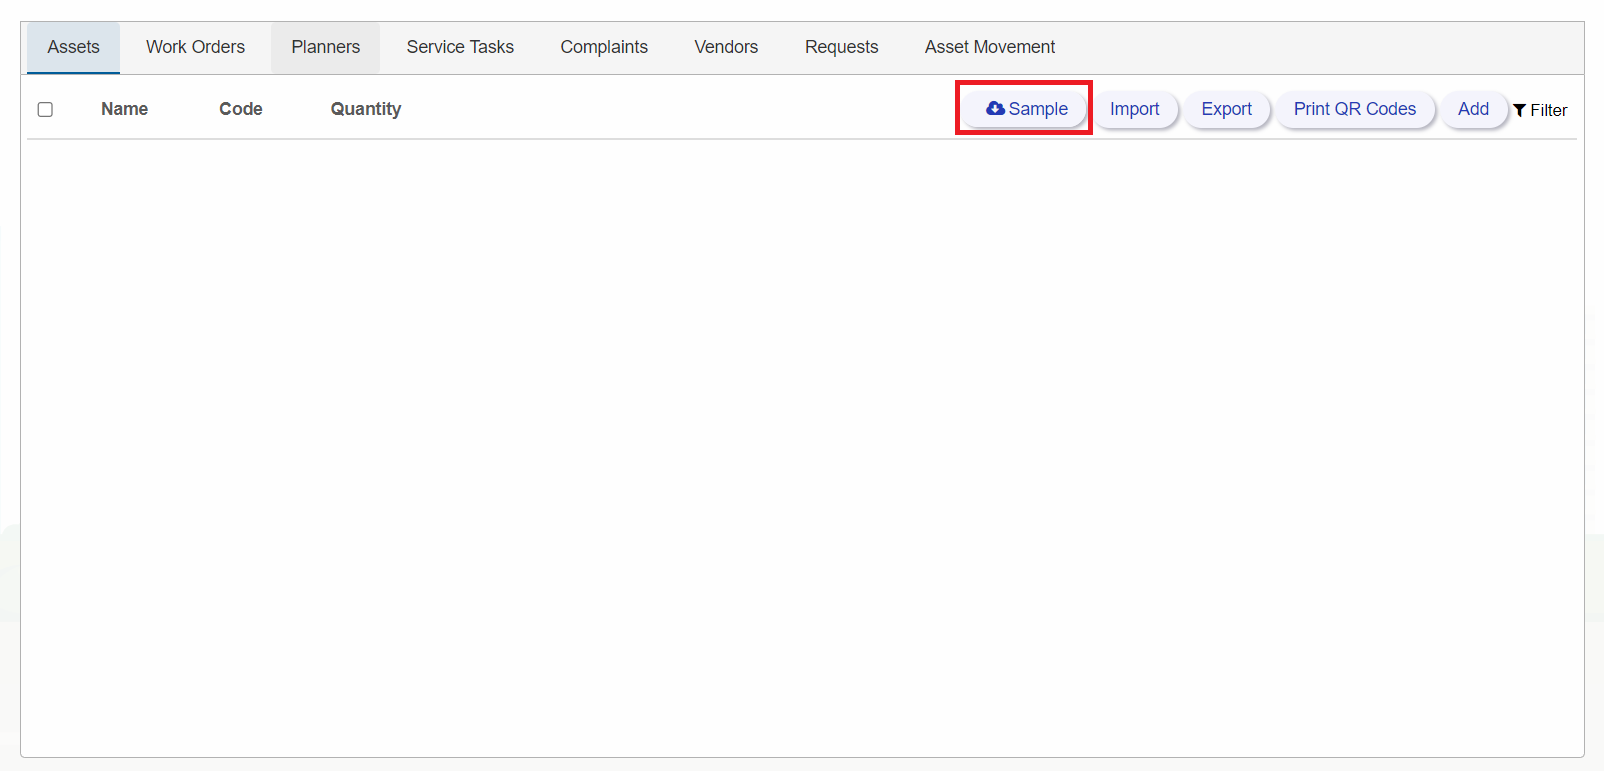
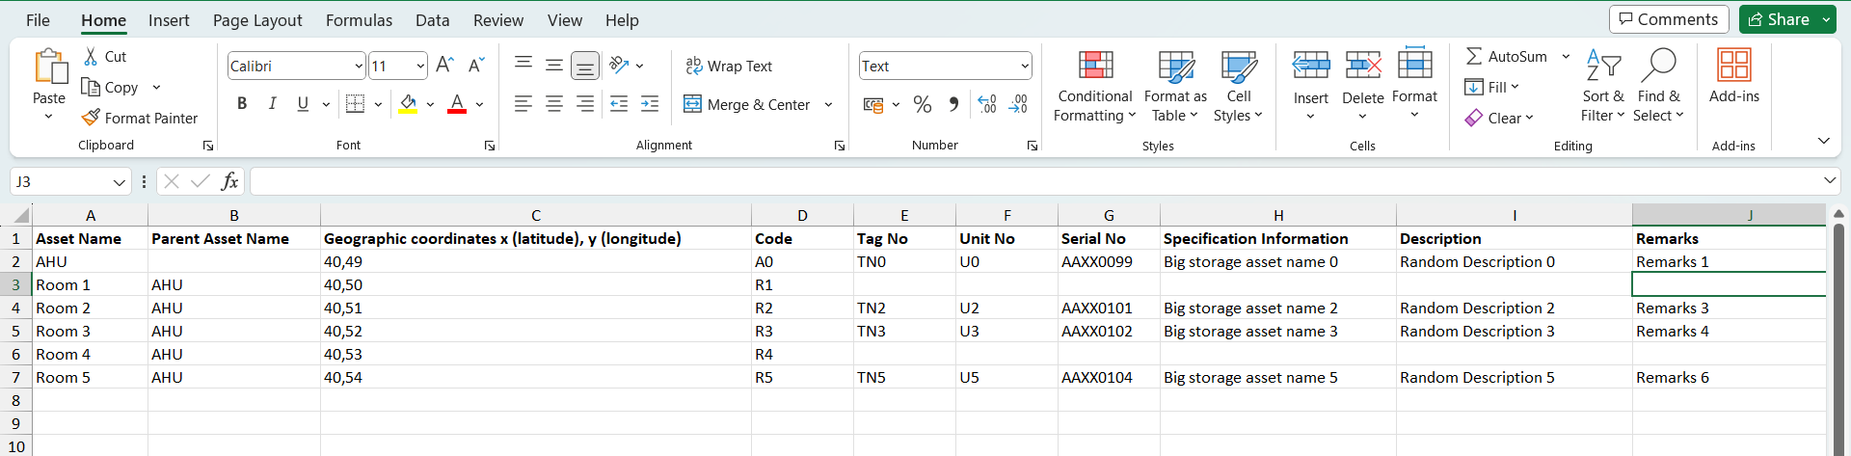
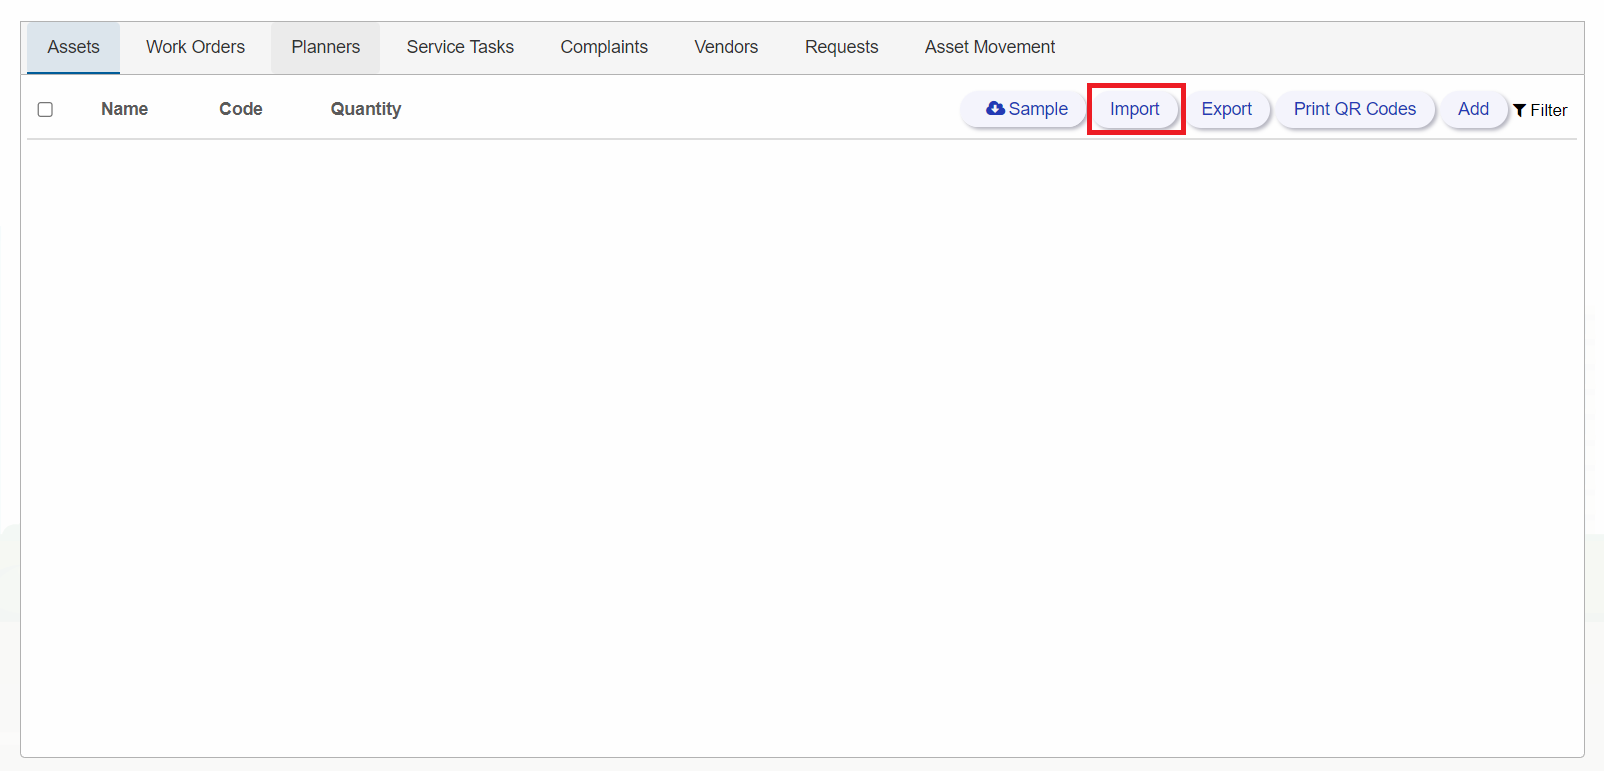
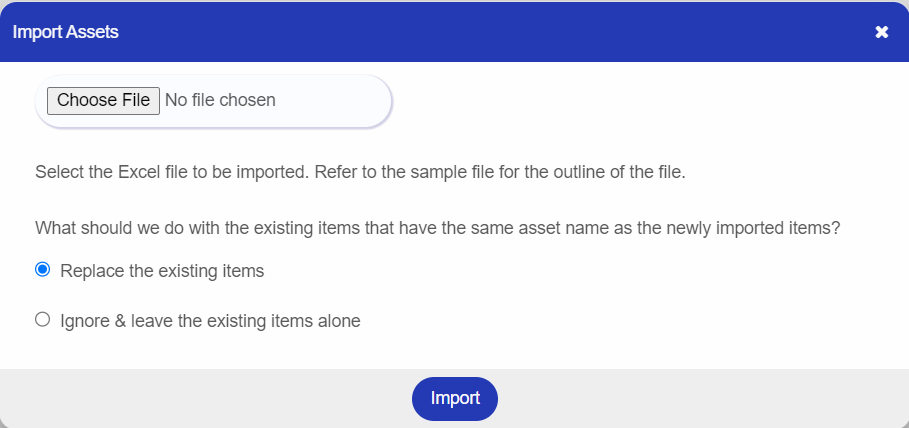
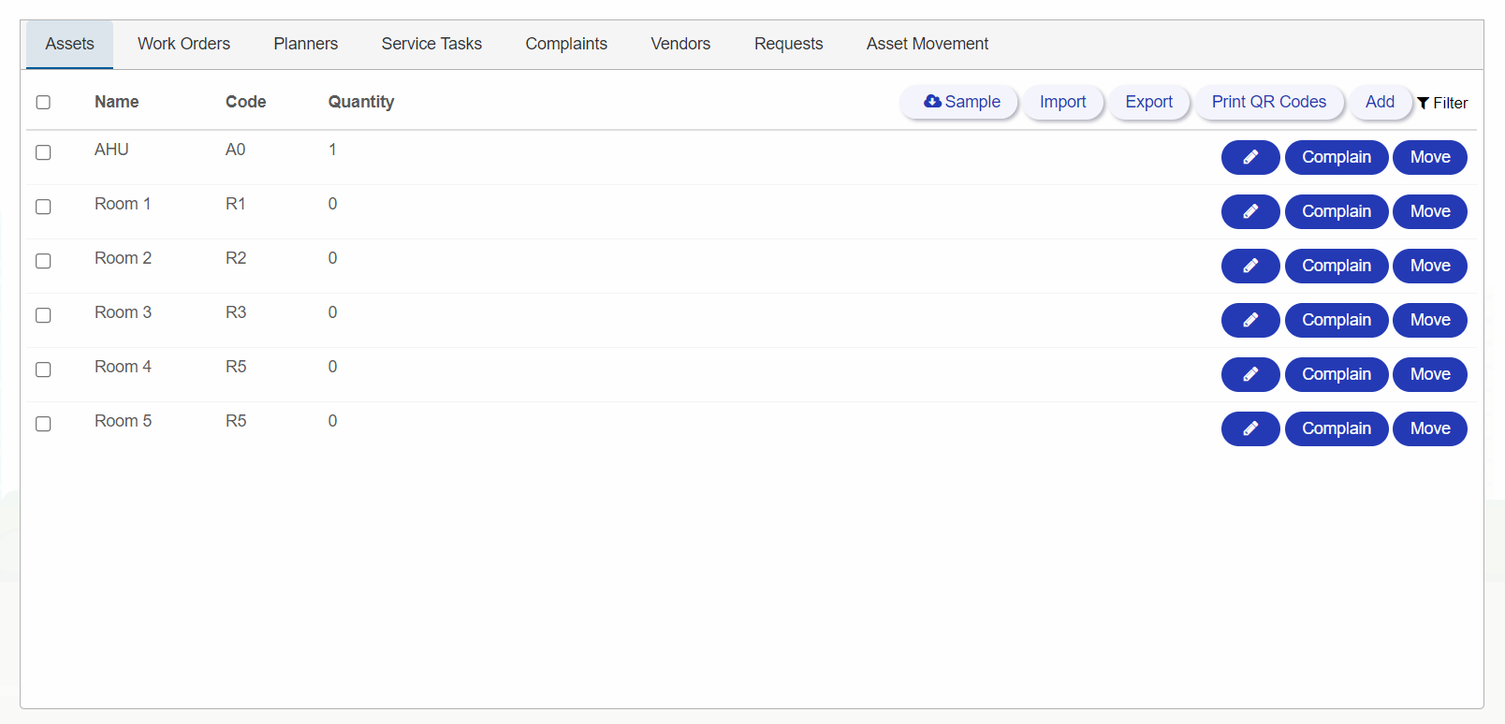
To add the assets collectively, users must import an excel file(.xlsx or .xls files) which is followed by the particular format.
The Assets Location module enables users to efficiently manage assets and their locations using a hierarchical tree view structure. Also, it also allow user for creating, editing, and deleting location.
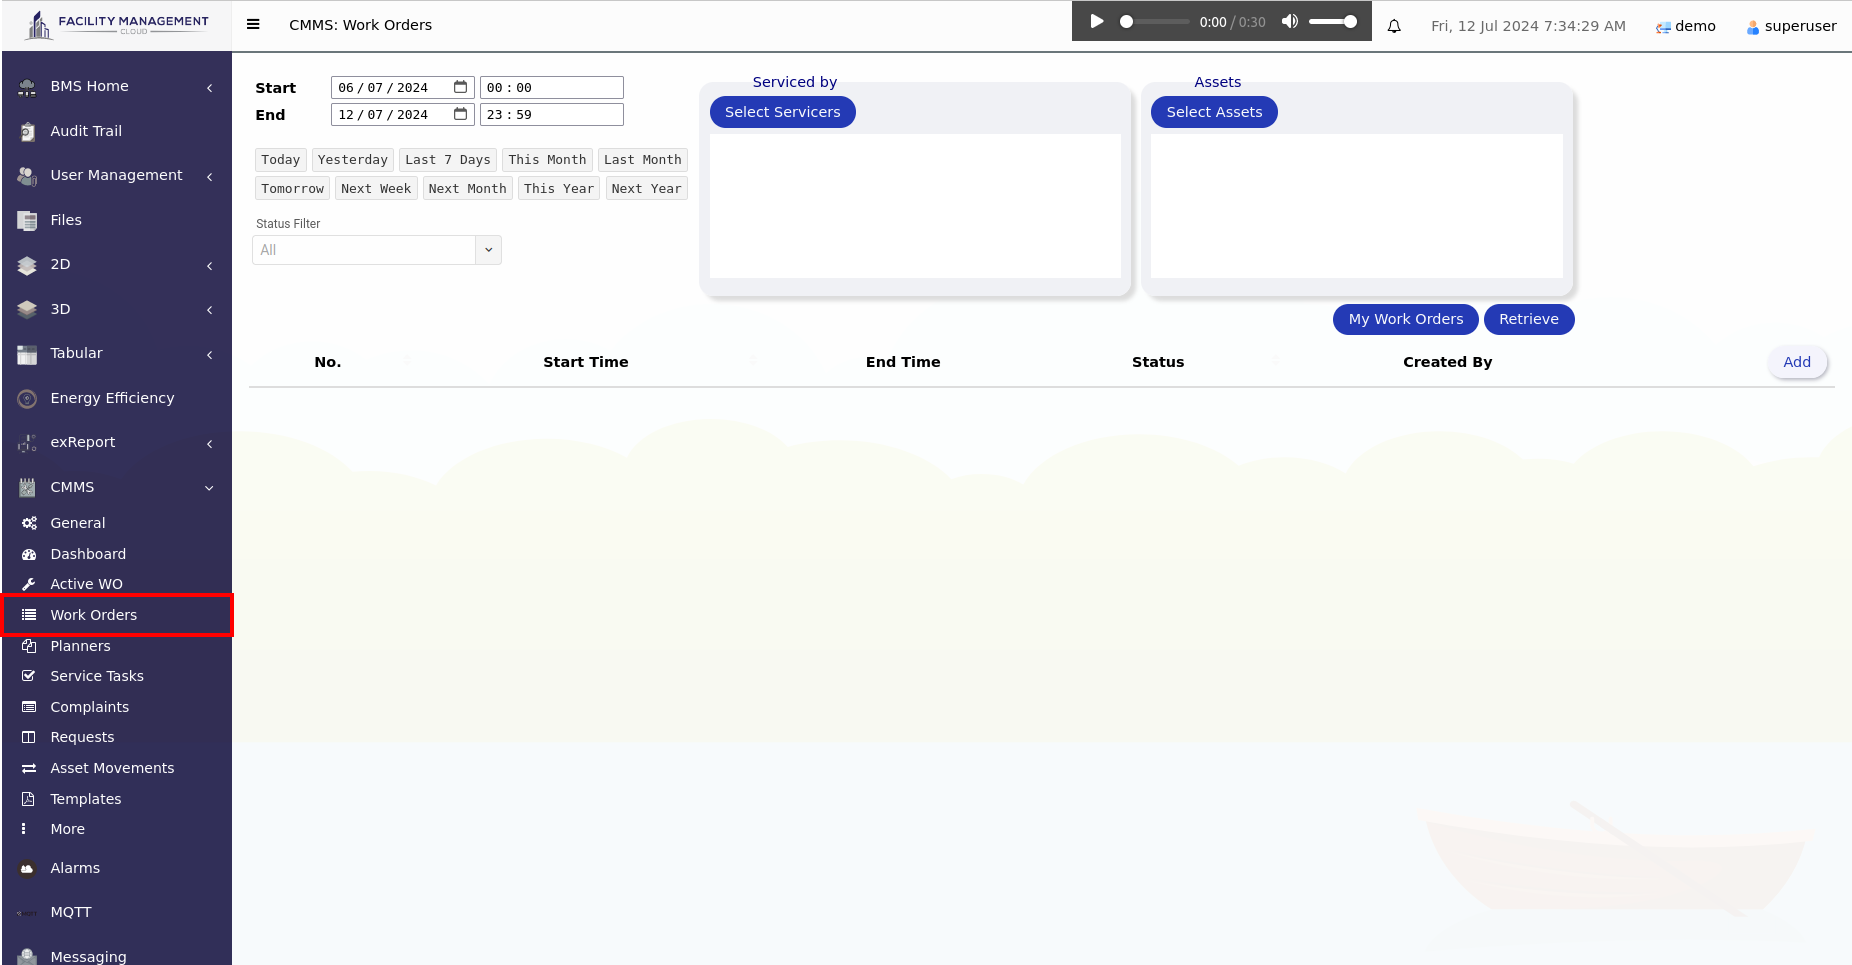
In a Computerised Maintenance Management System (CMMS), a work order is a digital record or document that initiates, tracks, and manages maintenance tasks and activities. This feature allows users to track progress, and ensure that maintenance tasks are completed as planned. It serves as a formal request or instruction for maintenance teams to perform specific work on assets or equipment within an organisation.
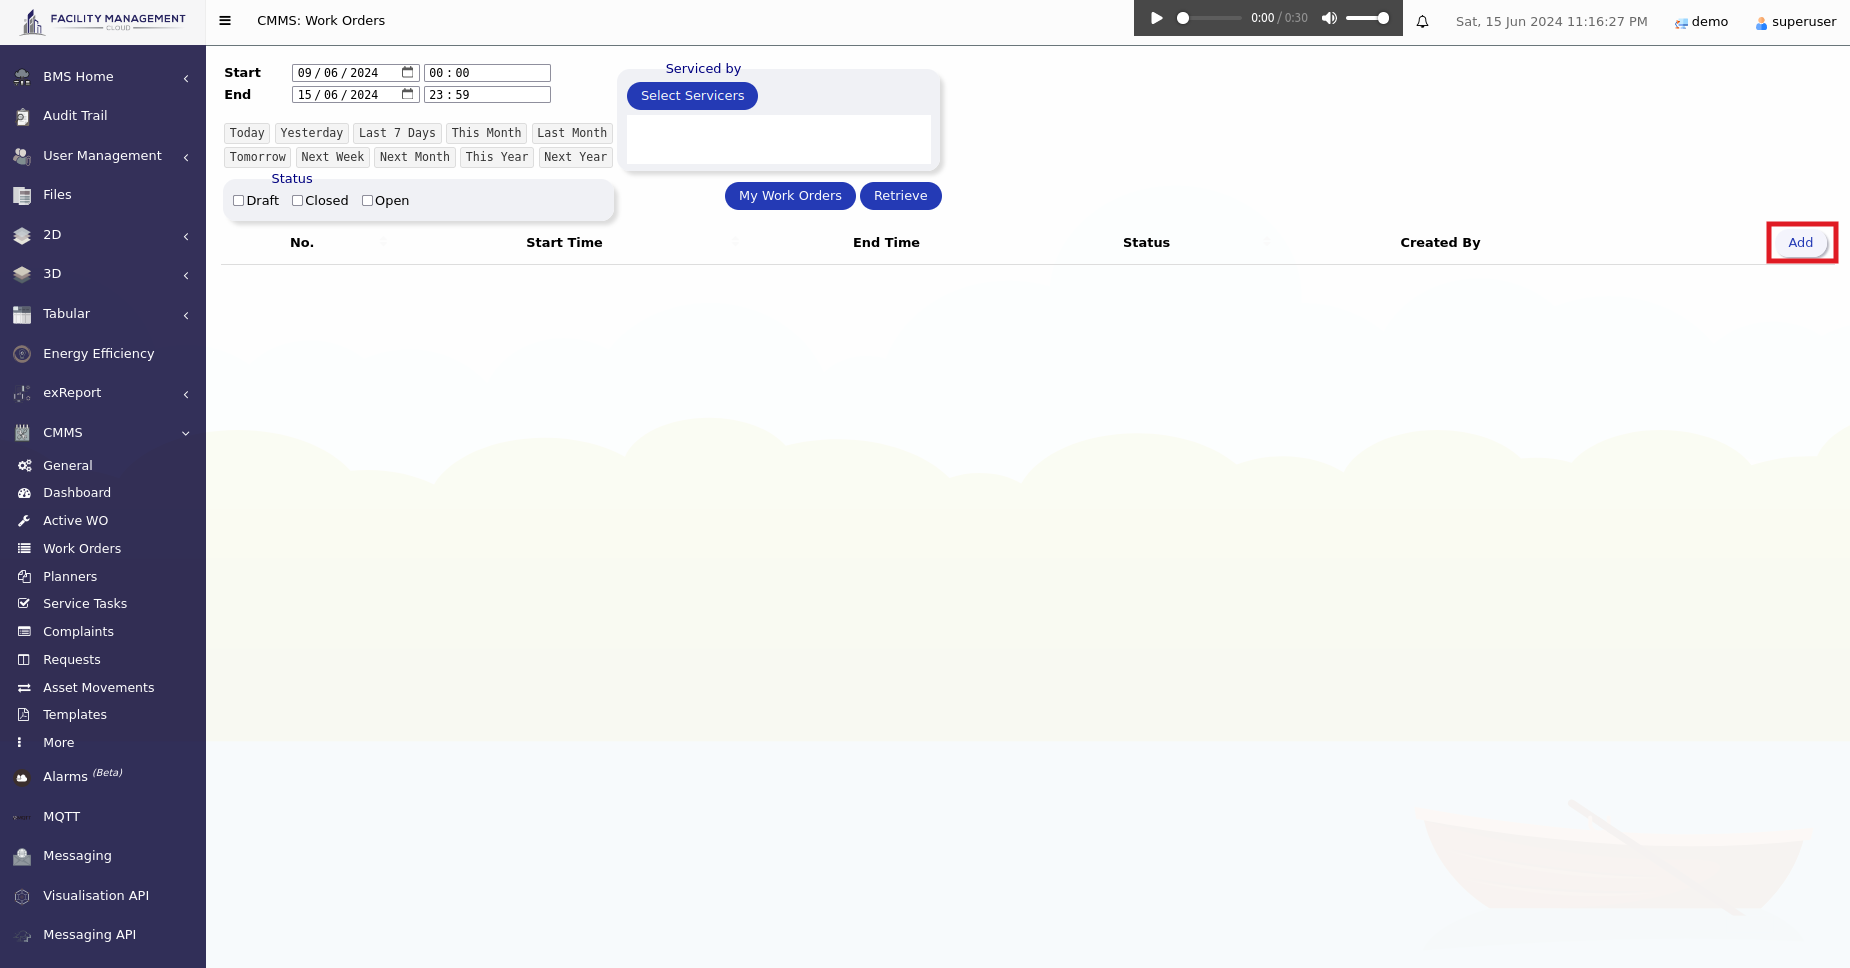
Click the "Add" button.
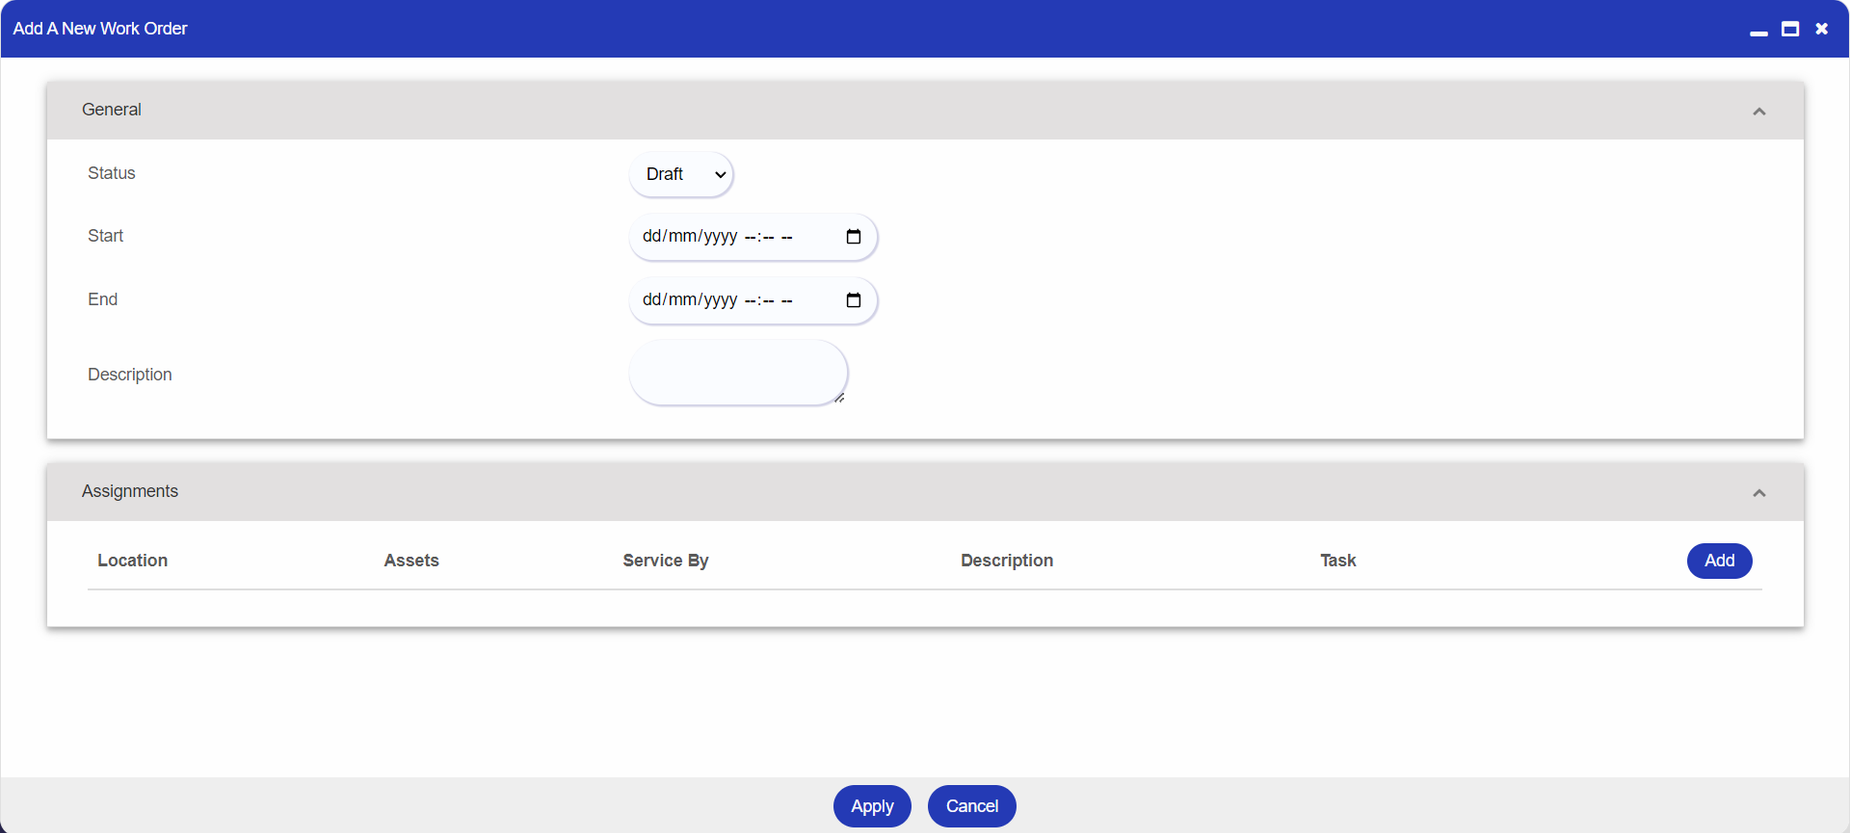
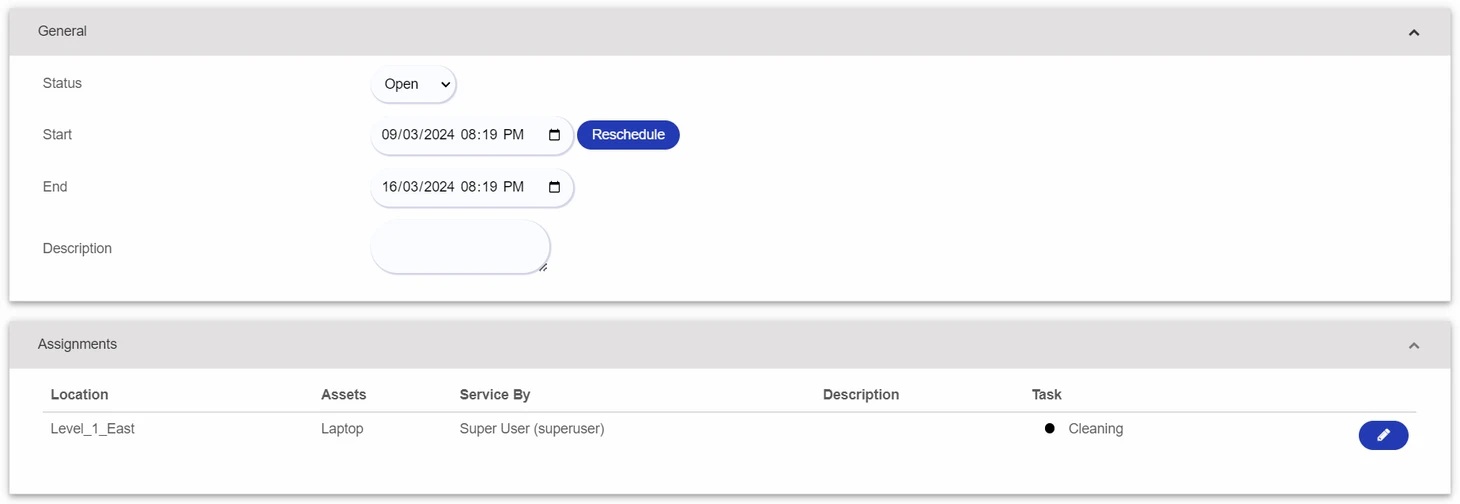
To add a work order, there are two sections: General and Assignments.
First, select the status and working time for the work order, and then proceed with the assignments inside the work order.
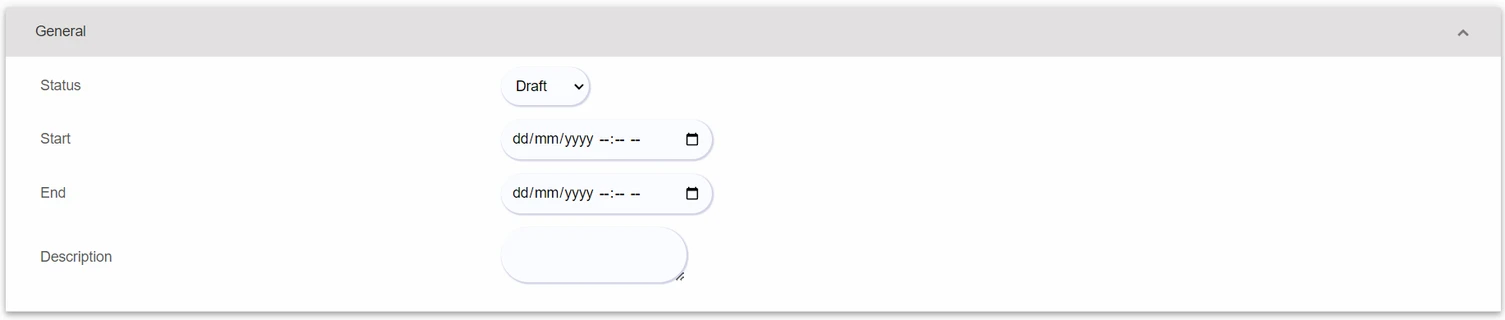
NOTE: The time picker in our system is not supported by Safari and Firefox browsers. Therefore, after users select the date, the time picker may not appear. Users will need to manually input the time.
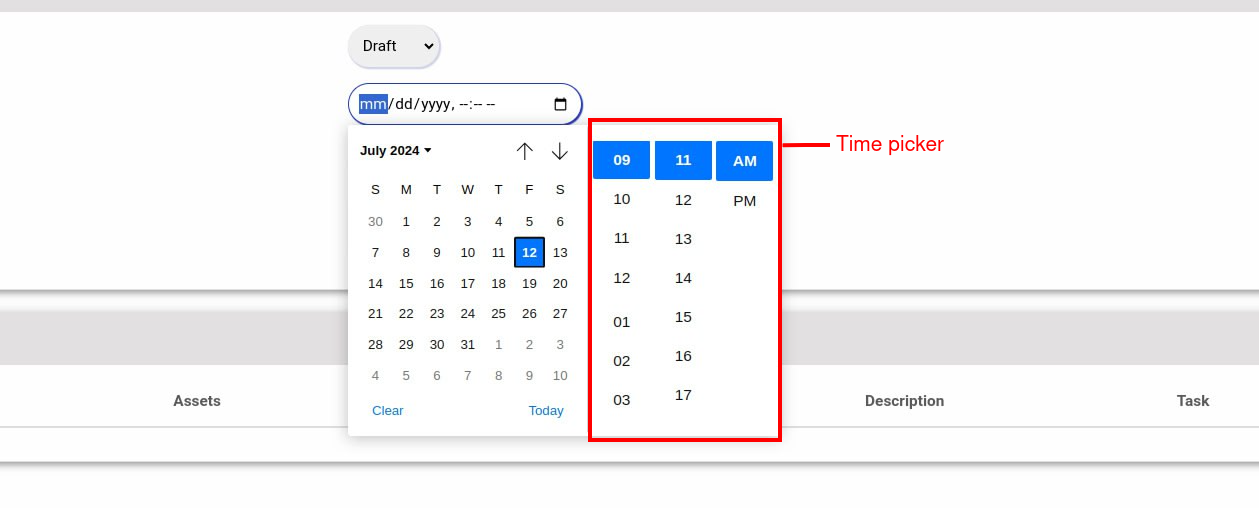
Click Add to add an assignment into the work order.

Inside an assignment, there are five sections required to key in, which are: General, Service Provider, Tasks, Complaints, and Attachments.
Asset - The asset that needs to be maintained.
Description - Additional details or information regarding when this asset occurred and the factors that caused it are needed.

The company or person who will be taking the service for the asset.

The tasks that are needed to maintain the asset, such as cleaning, repairing, etc.

The reasons and factors for maintaining the asset include occurrences such as water leakage, dim lighting, and other issues affecting its functionality.

Attachment could be evidence to demonstrate that the place or the sole asset is losing its functionality.

After you finished insert your assignments into your work order, click Apply to create a new work order.
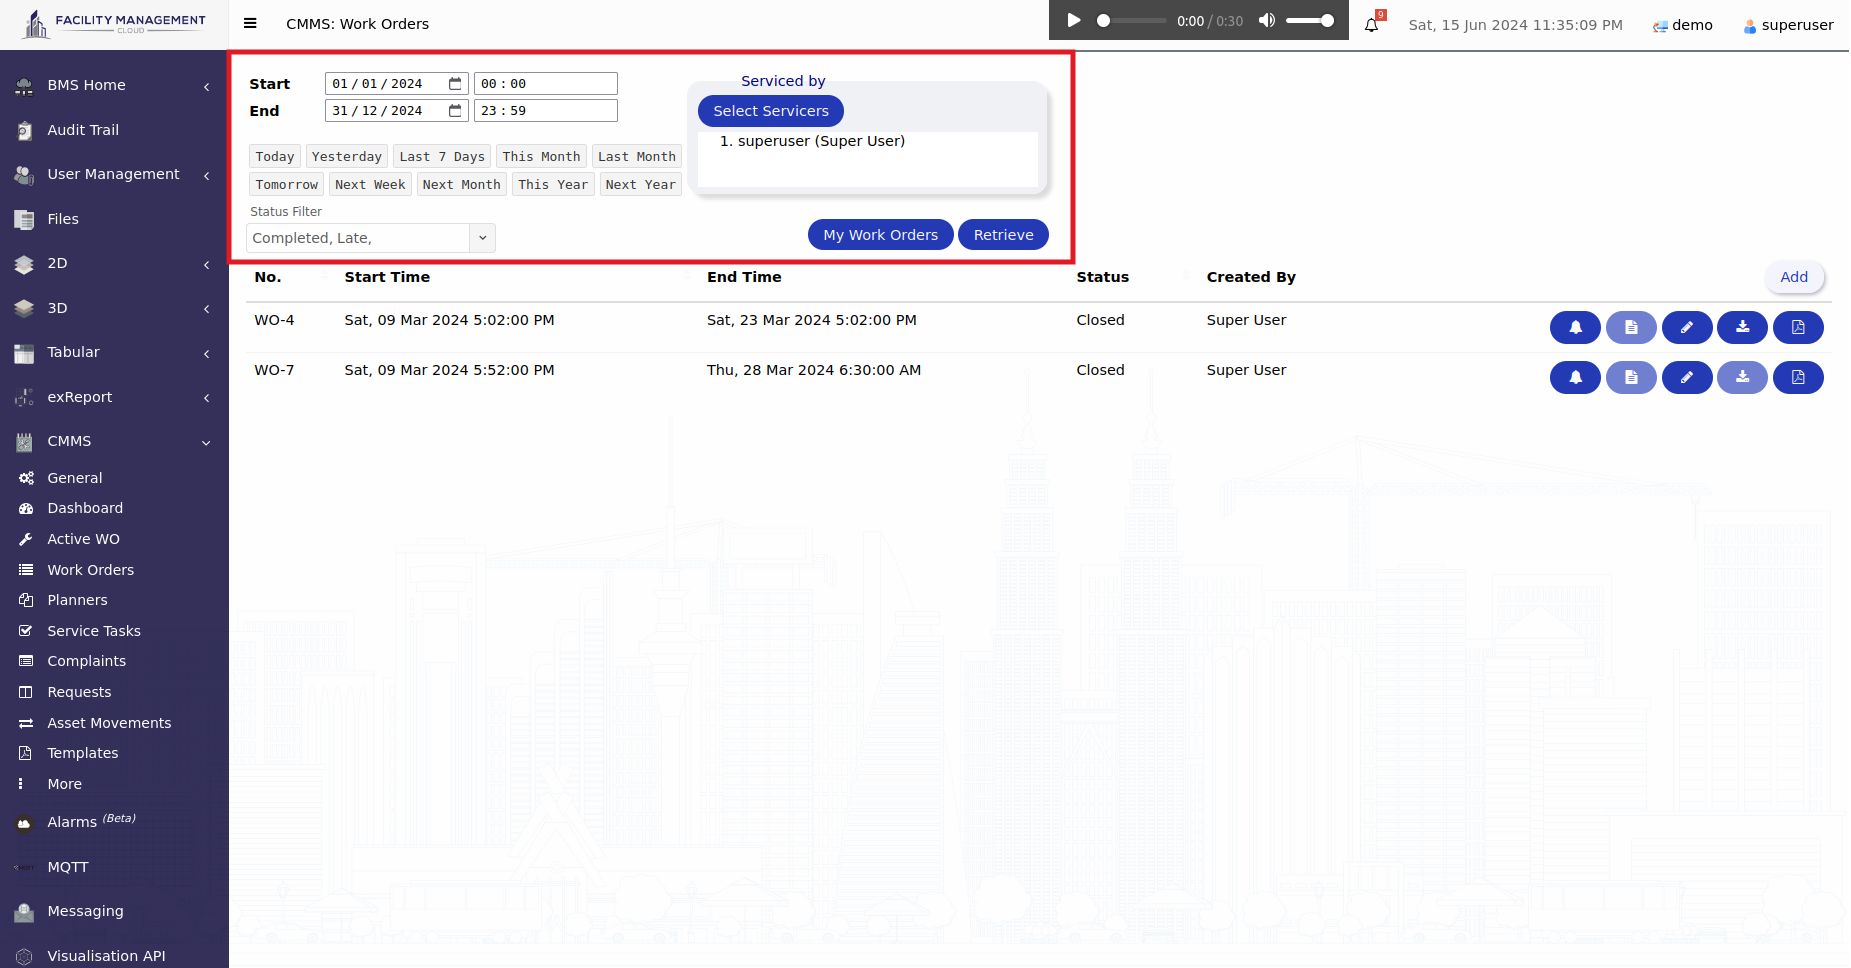
Select the start time, end time, work order status, and servicers that match the corresponding work orders you want to sort. After that, click the 'Retrieve' button. You can click directly on the 'My Work Orders' button to display all the work orders that should be serviced by you.
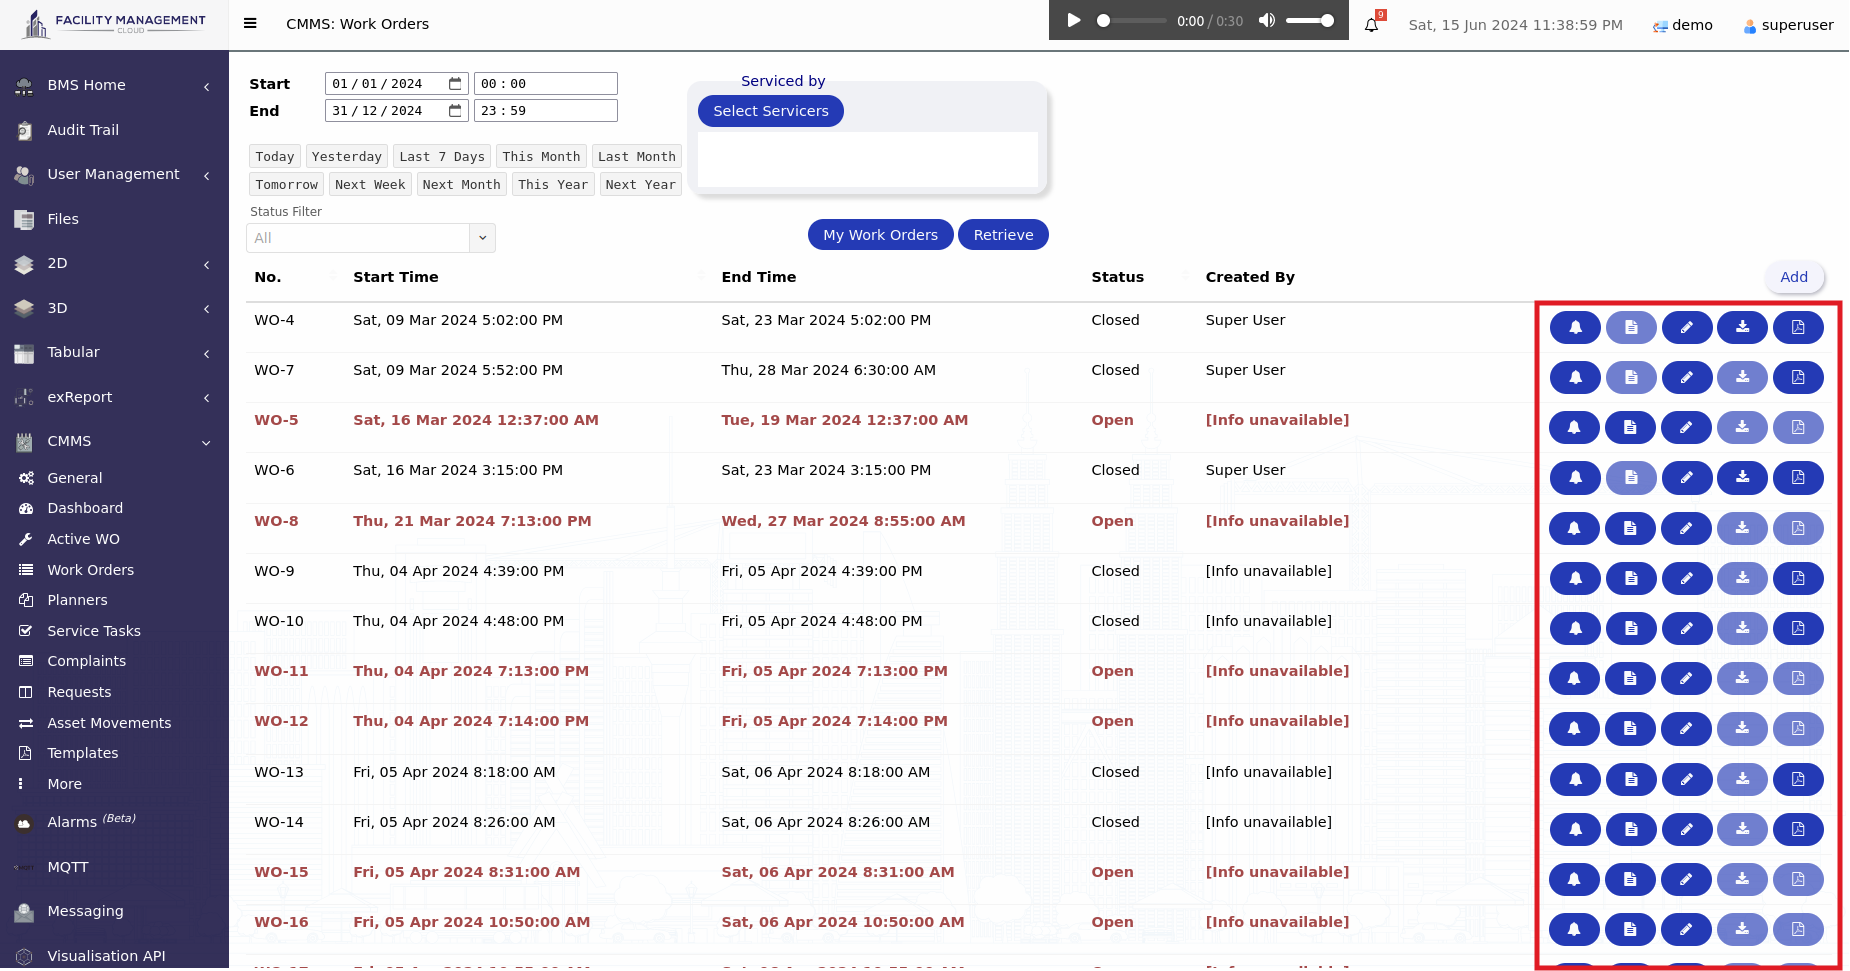
In each work order, there have five button that help to manage work orders, which is:
There are some cases that will result in a notification being sent to the service providers:
After a user makes a request for the asset, a work order will be generated with the details of the request.
Note: Only the asset with the default planner can display the request.
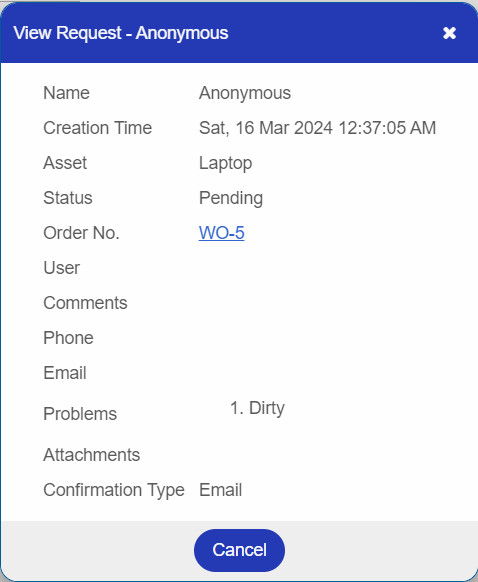
Example of the request:
Maintenance managers are allowed to edit the General and Assignments sections, but it depends on your current maintenance order status.
| Status | Permissions |
|---|---|
| Draft | You are allowed to update everything. |
| Closed | You are not allowed to update anything. |
| Opened | You are only allowed to check and remark tasks, upload attachments, and reschedule the work time. |
Note: Once the Draft state changes to another state, it cannot be reverted back to its original Draft state.
After you reset your Starting Time and Ending Time, click Reschedule to reset the time.
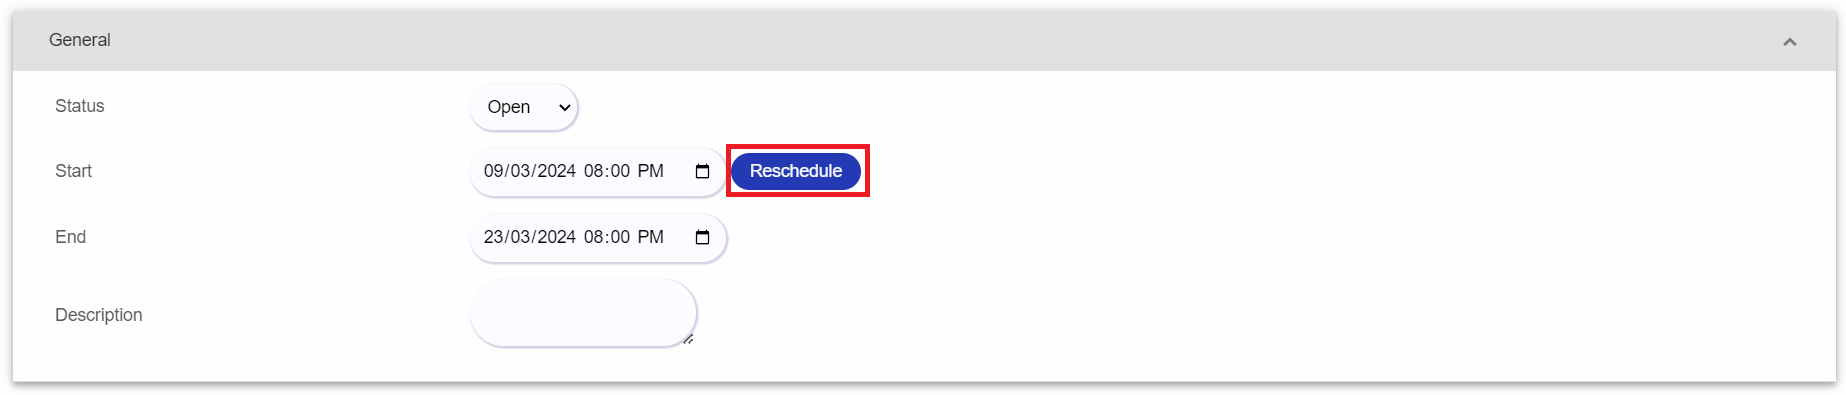
To check the tasks to represent that the tasks have been completed, click the pencil icon in the Assignment section.

Check the checkbox for the corresponding tasks that have been completed. You can upload attachments as evidence to show that the problems have been fixed. After that, click
Note: Only the task supervisor can check the checkboxes.

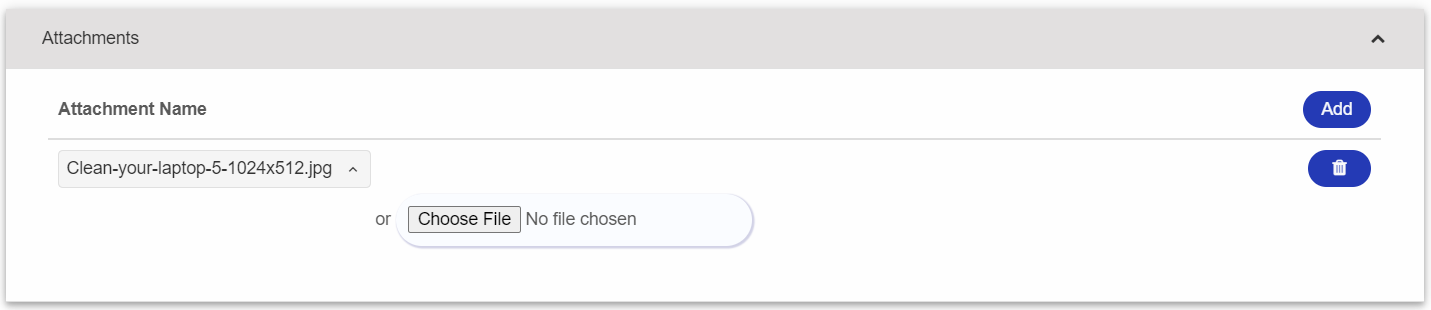
Click Apply to update your work order.
User can download the attachment from the work order.
NOTE: Only the work orders in closed state are able to download the attachments.
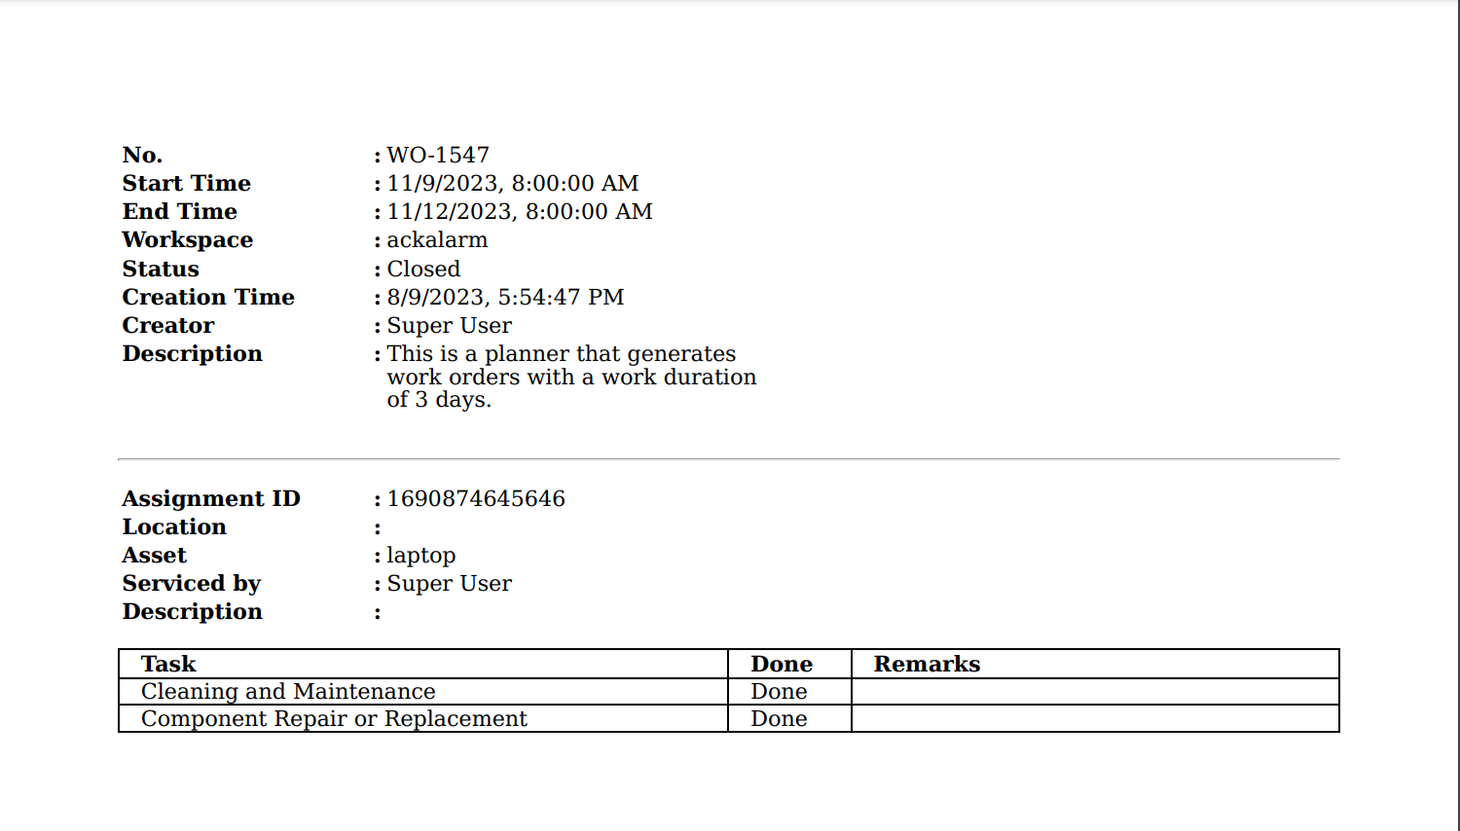
INFO: Only work orders that are in closed state are able to generate the report.
After you click EXport button, a PDF will be generated with the format below:
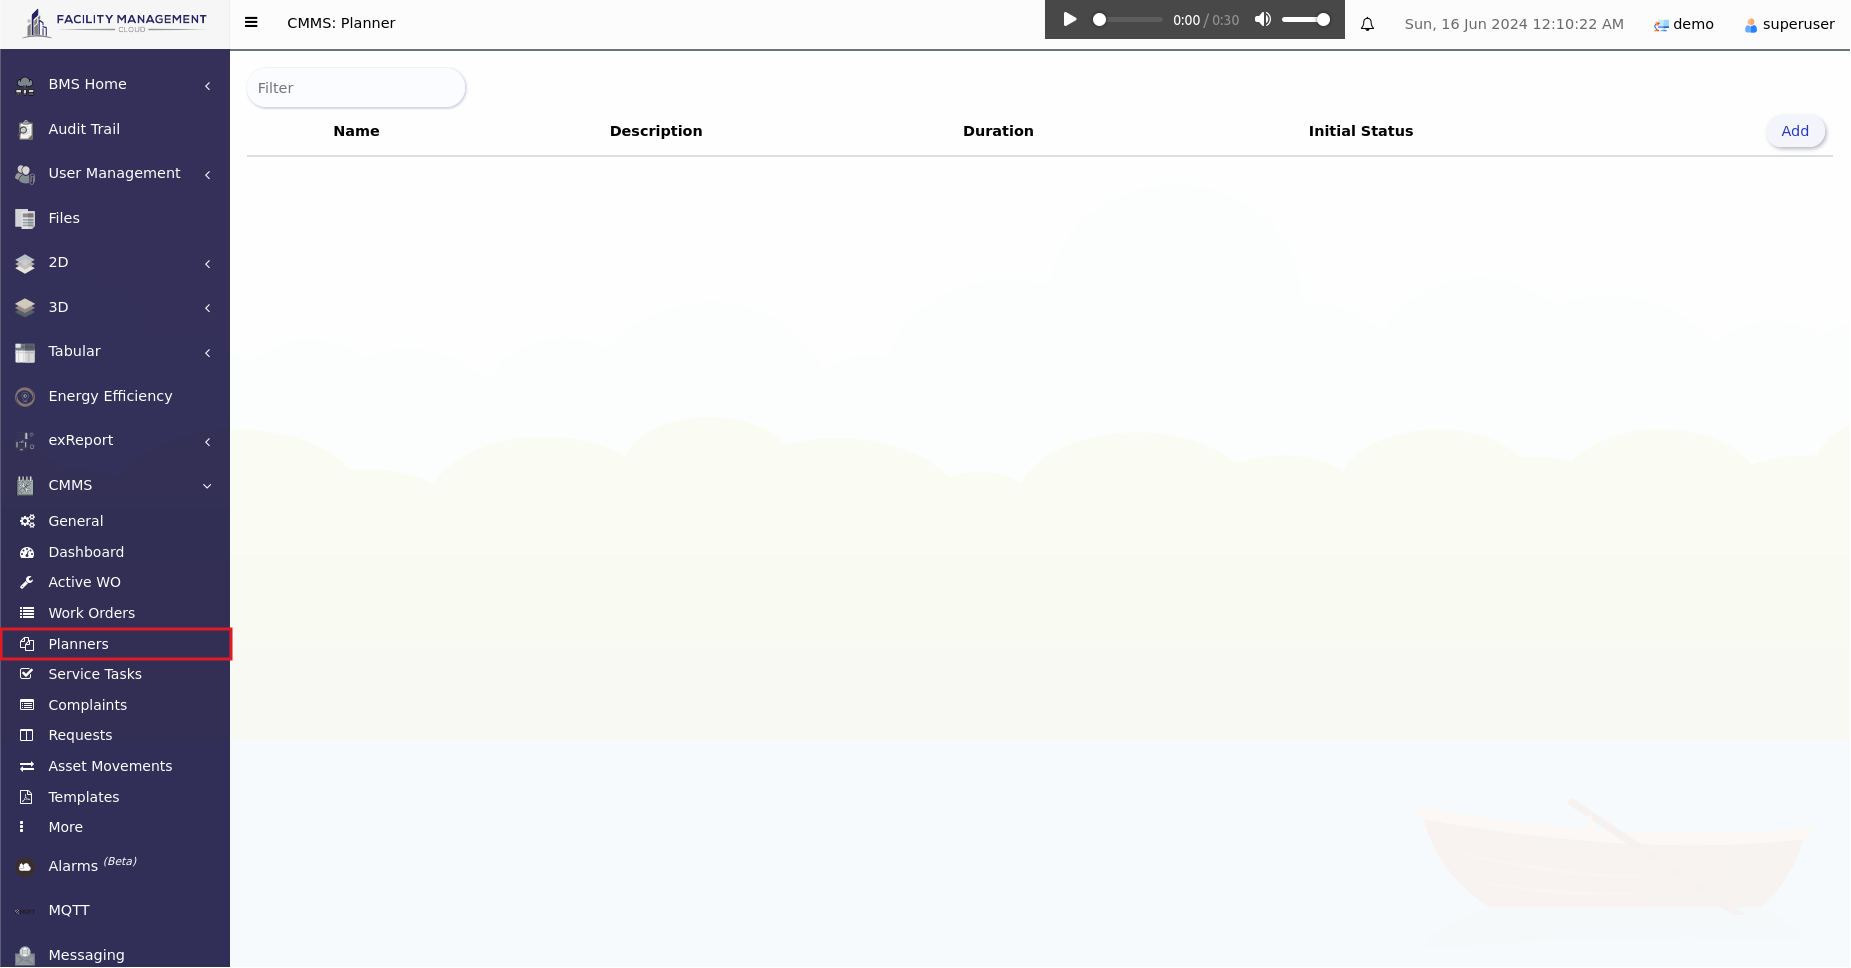
In CMMS, a planner is a very important feature that helps management efficiently plan and schedule maintenance work. By setting up planner templates, management can predefine maintenance schedules for specific equipment or assets, including maintenance tasks, frequencies, and execution times. These templates can be based on equipment runtime, usage, or manufacturer-recommended maintenance intervals. Once the templates are set up, the CMMS system automatically generates work orders according to the predefined schedule and assigns them to the appropriate technicians or teams. This ensures that maintenance work is carried out on time, contributing to increased equipment reliability and production efficiency. Additionally, the planner can generate relevant maintenance reports and records, aiding management in the evaluation and optimization of maintenance plans.
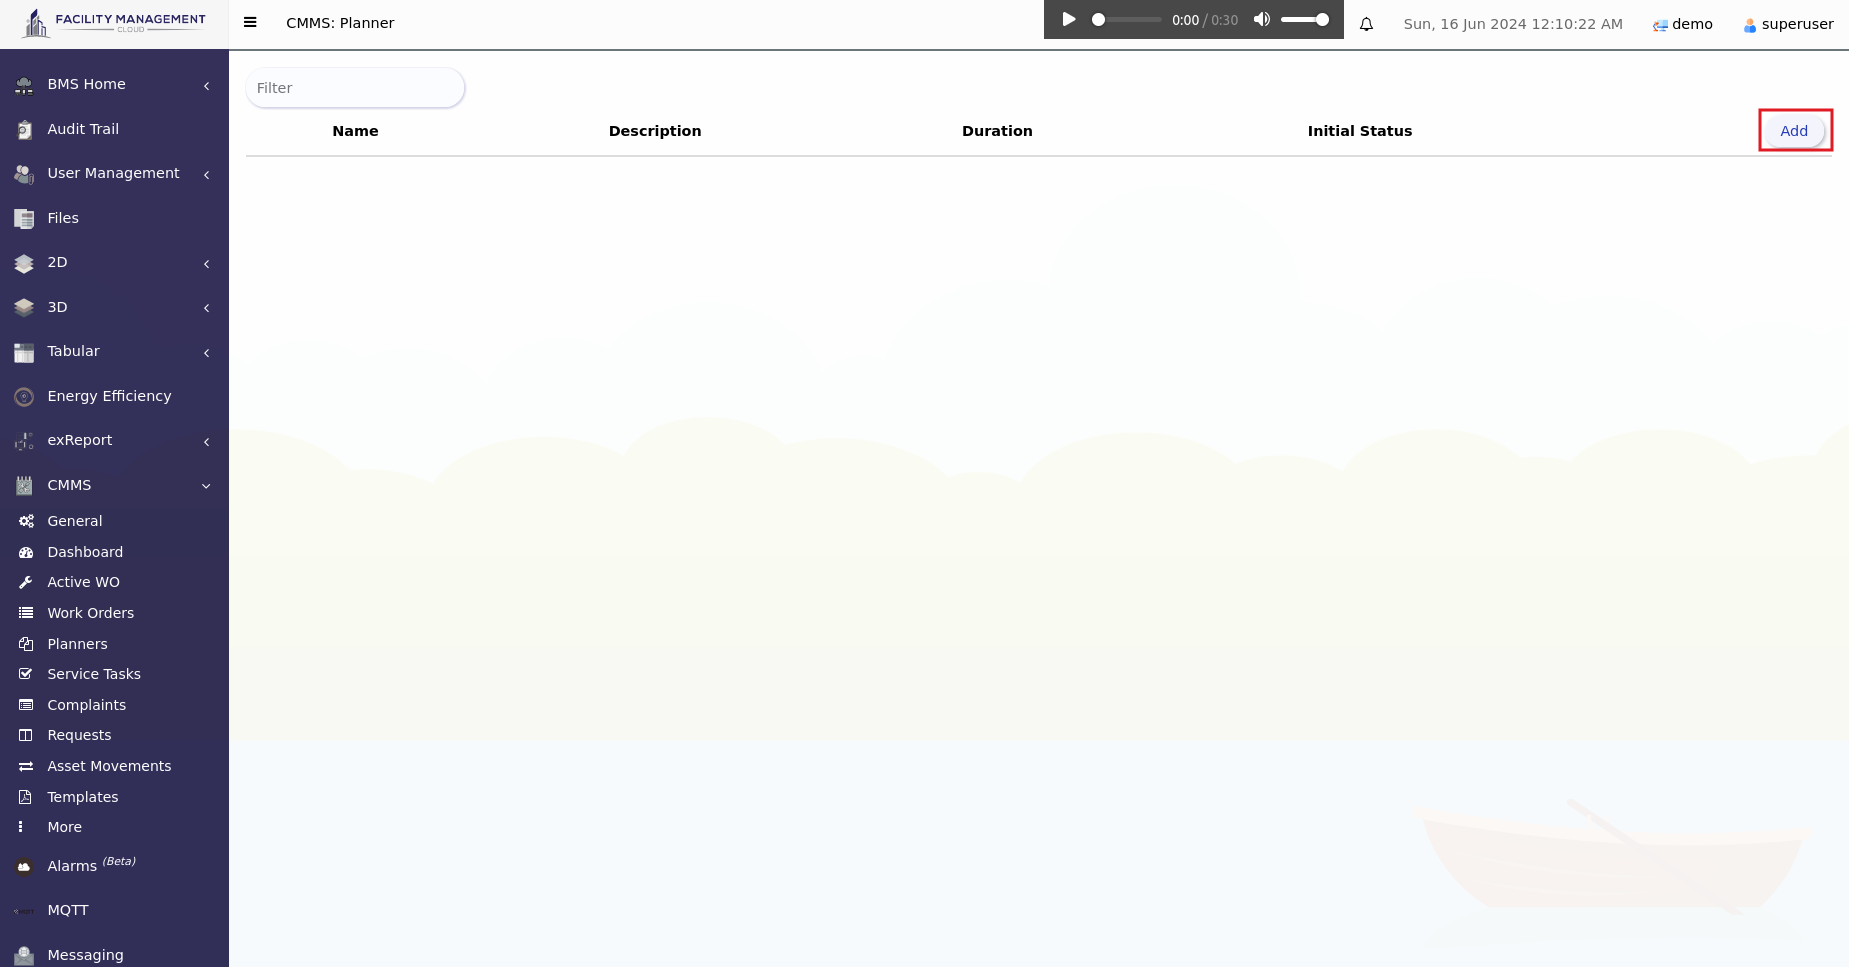
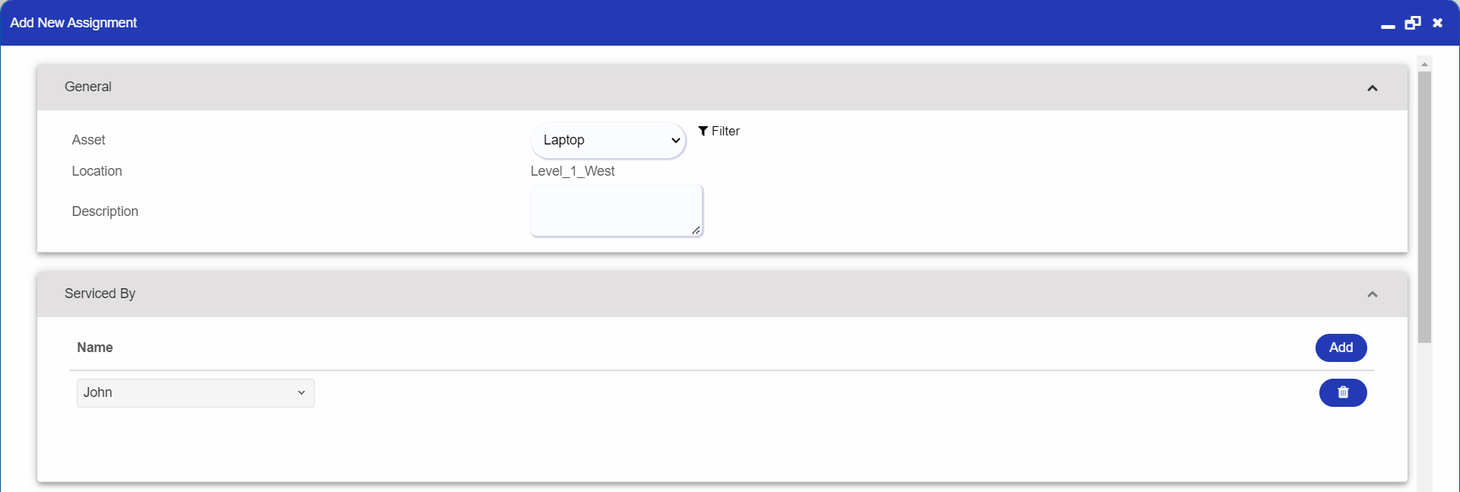
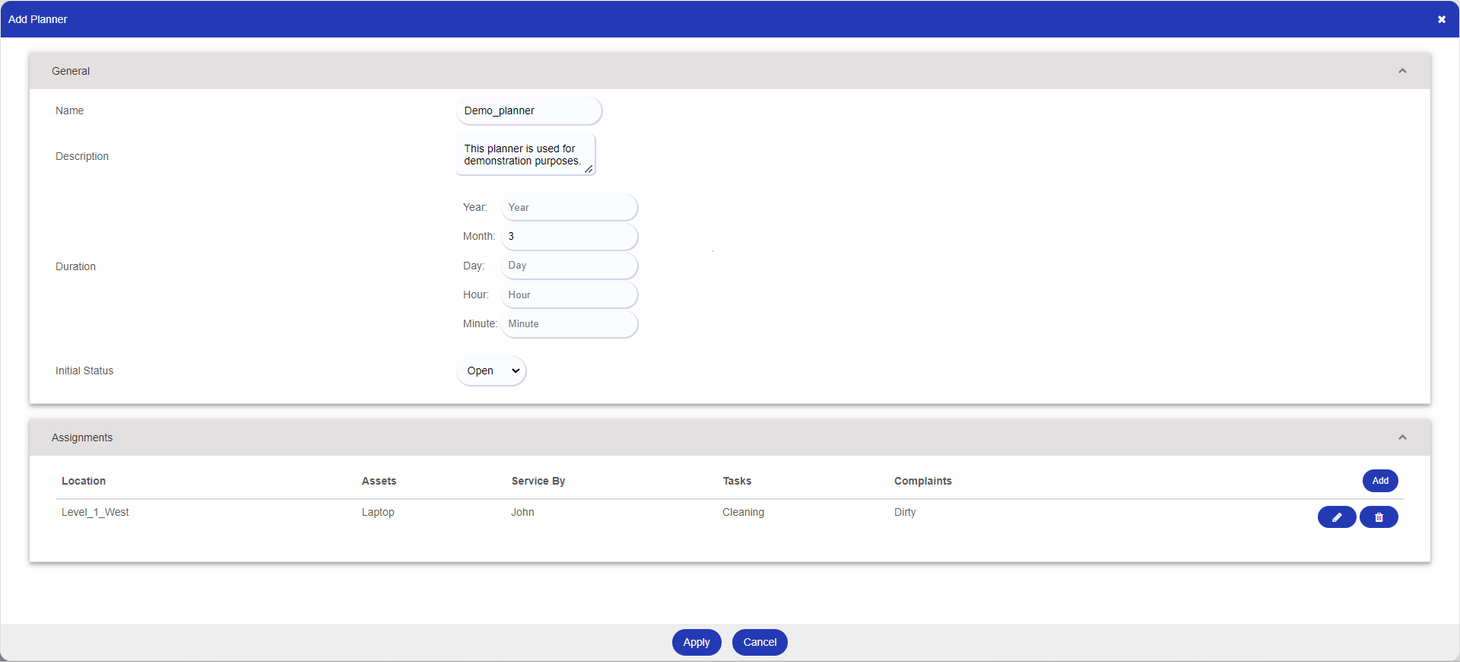
| Name | The name of the planner. |
|---|---|
| Description | Details about the planner. This description also will be applied to your created work orders. |
| Duration | The default time allotted for completing an assignment. |
| Initial Status | The status of work orders when they are created. |

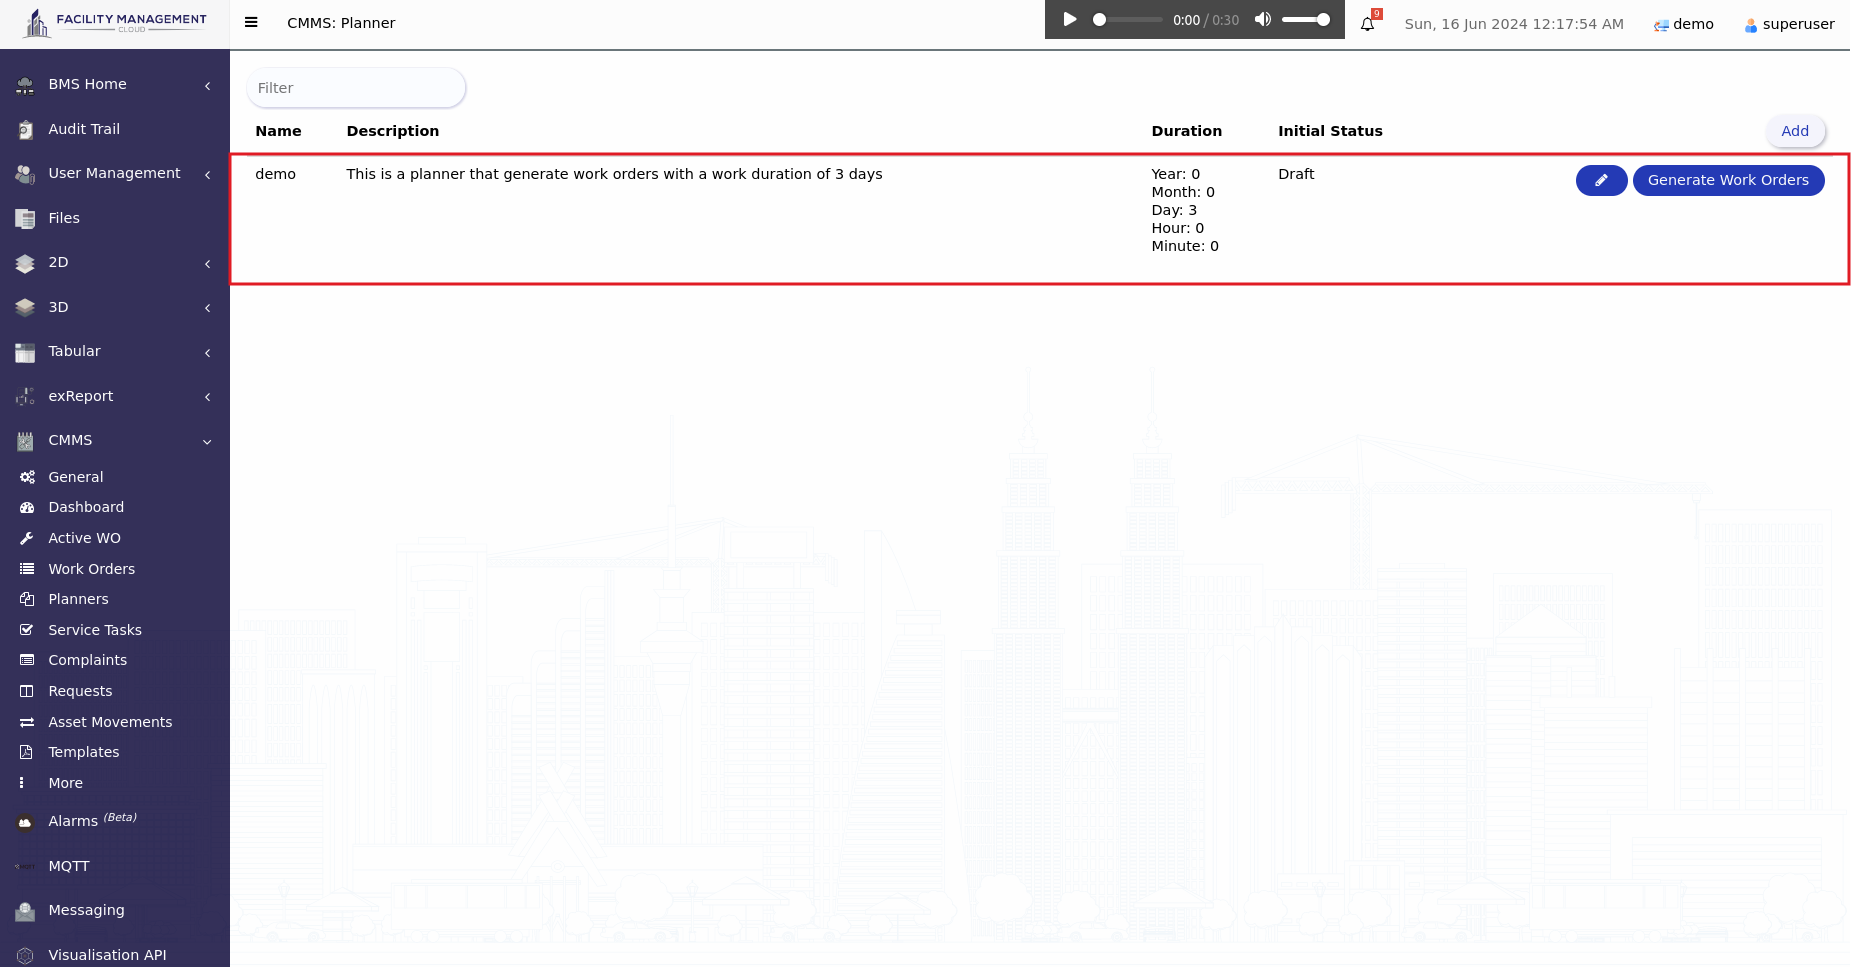
After learning how to create a planner, the next step is to learn how to generate multiple work orders at once at specific intervals.
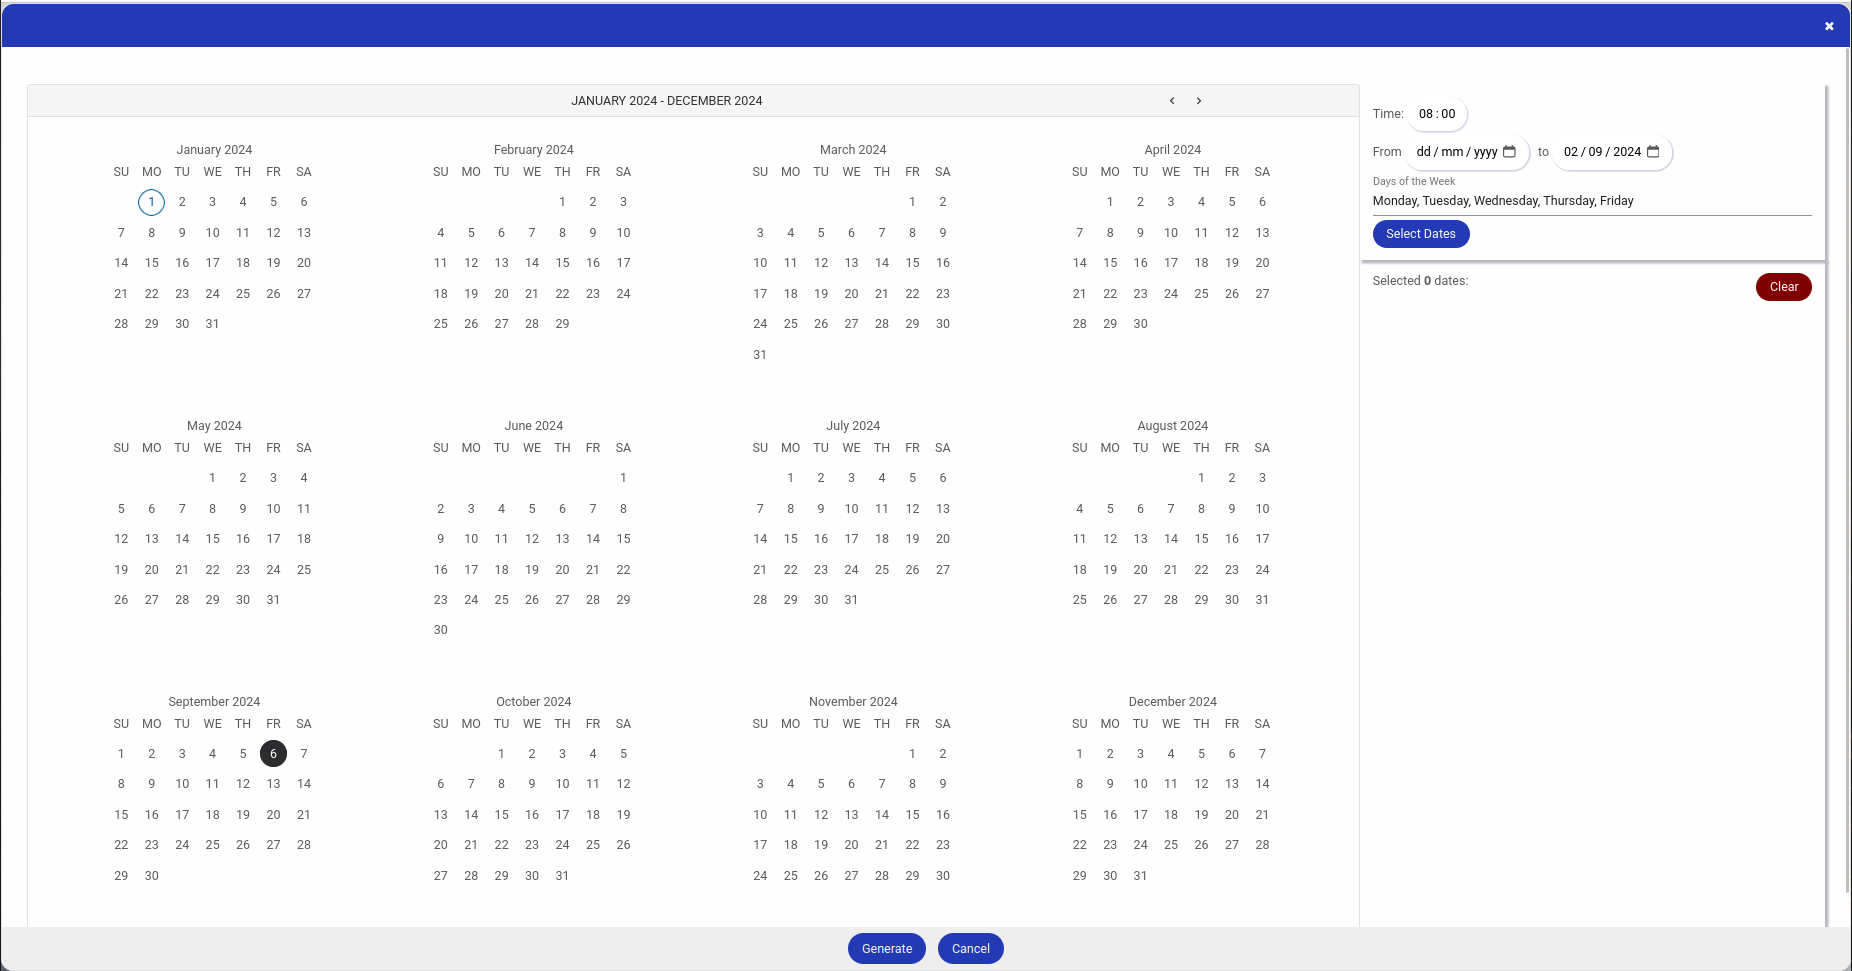
This feature allows users to create multiple work orders with predefined work order templates by selecting specific dates, times, and days of the week. This helps ensure that these work orders are generated without requiring manual intervention.

After you create a planner, click the "Generate Work Orders" button. A dialogue will appear as shown below:
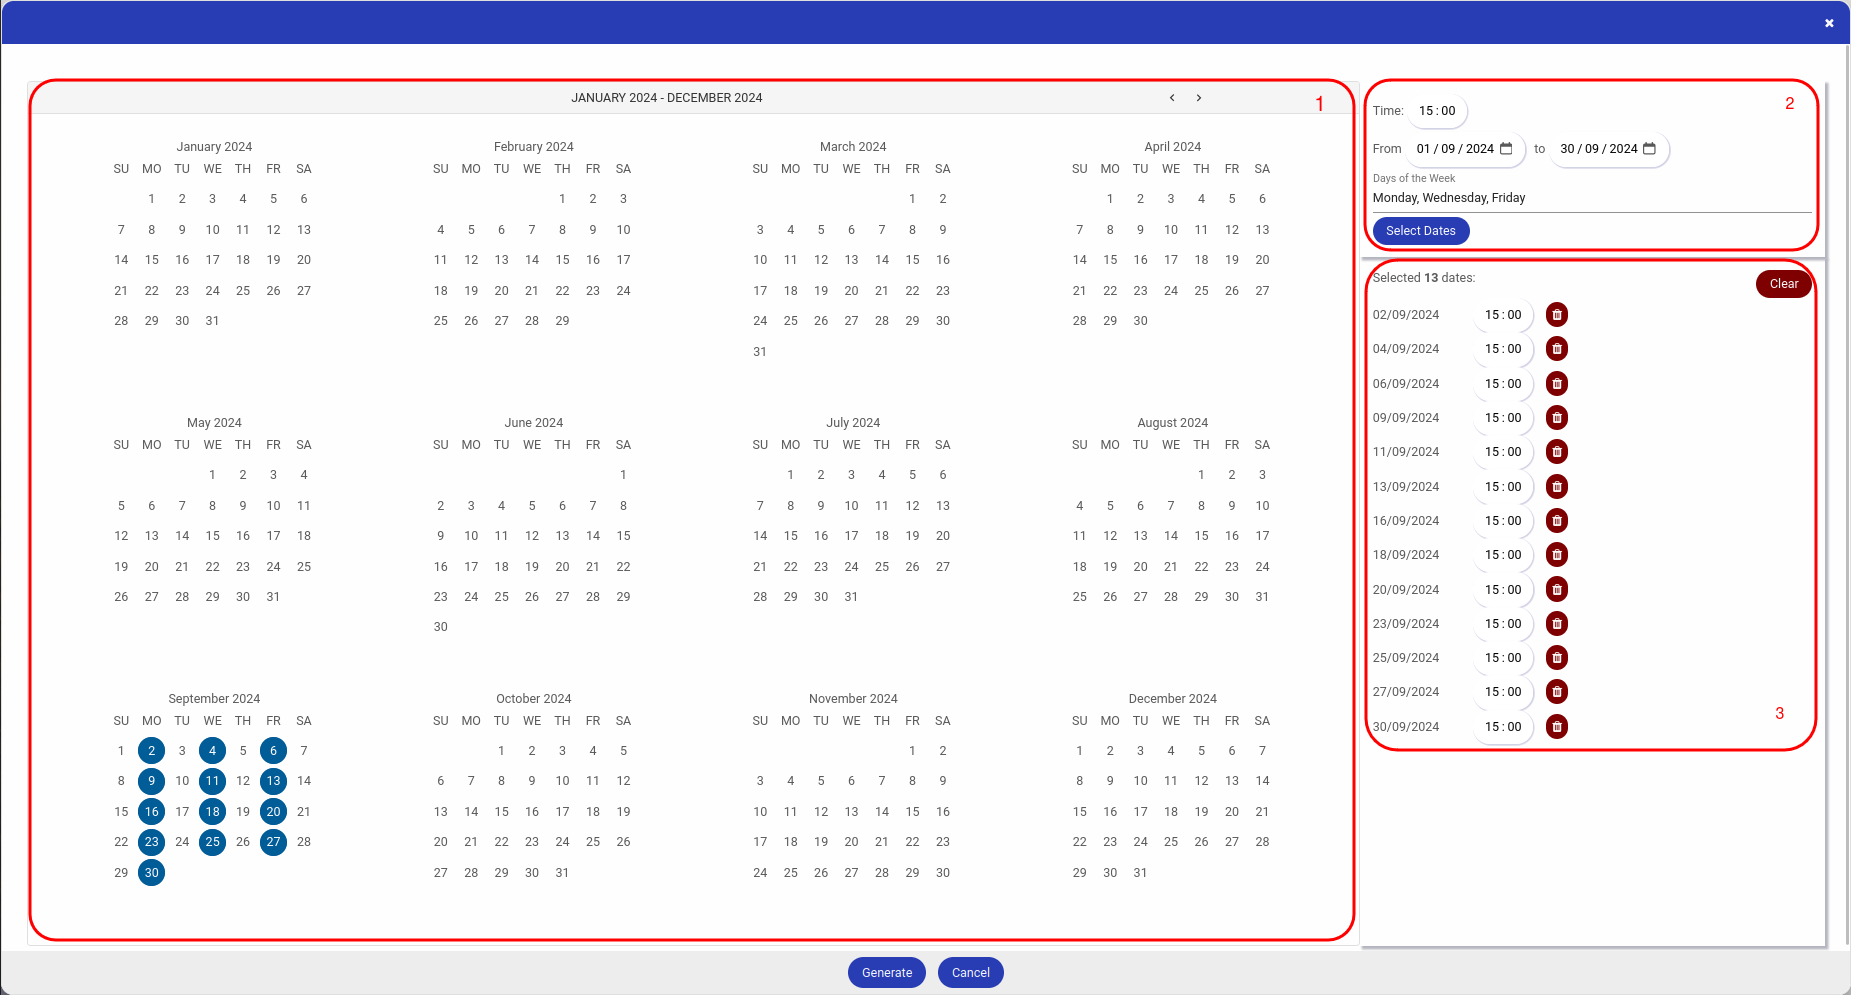
Example:
Example:
A service task refers to a specific type of task that is performed within a business or operational context to provide a service or carry out a particular action. It often involves delivering a service to customers, clients, or internal stakeholders. Service tasks can encompass a wide range of activities and may vary depending on the industry or sector.
In the context of maintenance management or Computerised Maintenance Management Systems (CMMS), service tasks typically relate to activities performed to ensure the proper functioning, repair, or maintenance of equipment, machinery, facilities, or assets. These tasks are designed to keep assets in optimal condition, prevent breakdowns, and ensure the longevity of the equipment.
Service tasks in CMMS may include activities such as routine inspections, preventive maintenance, repairs, calibration, cleaning, and other actions aimed at ensuring the efficient operation of assets. These tasks are often scheduled, assigned to specific personnel, and tracked to ensure that maintenance activities are completed in a timely and effective manner.
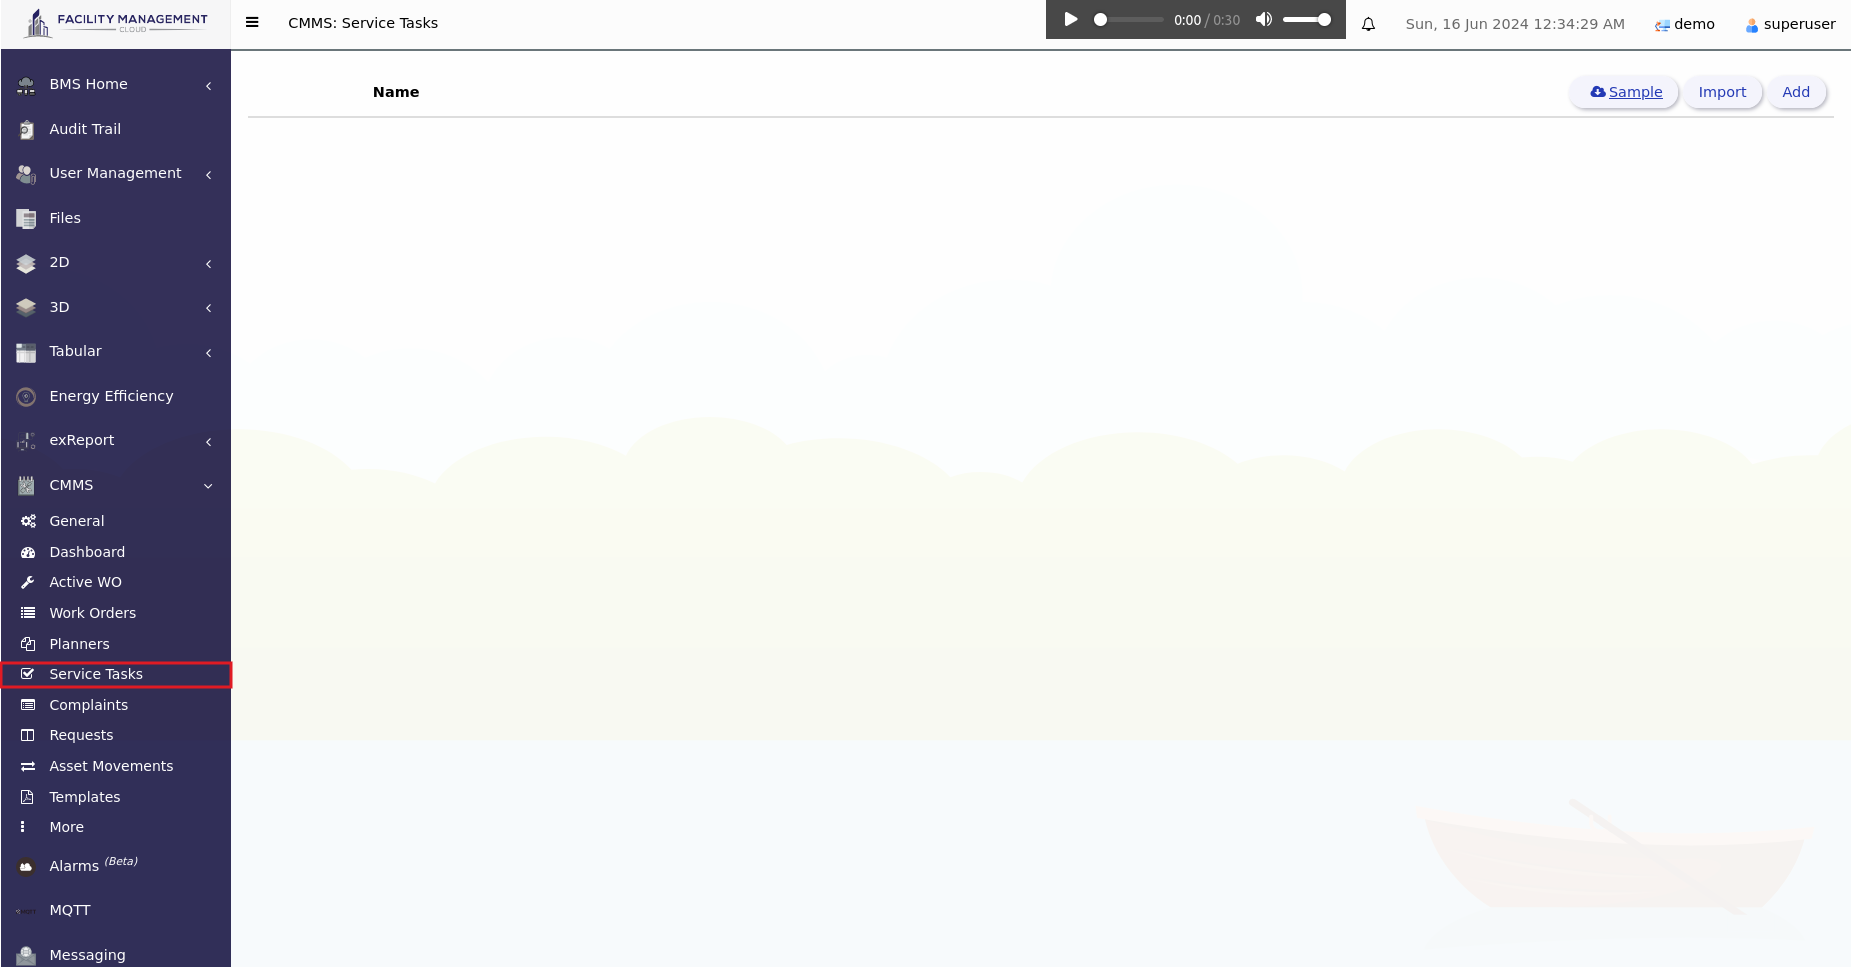
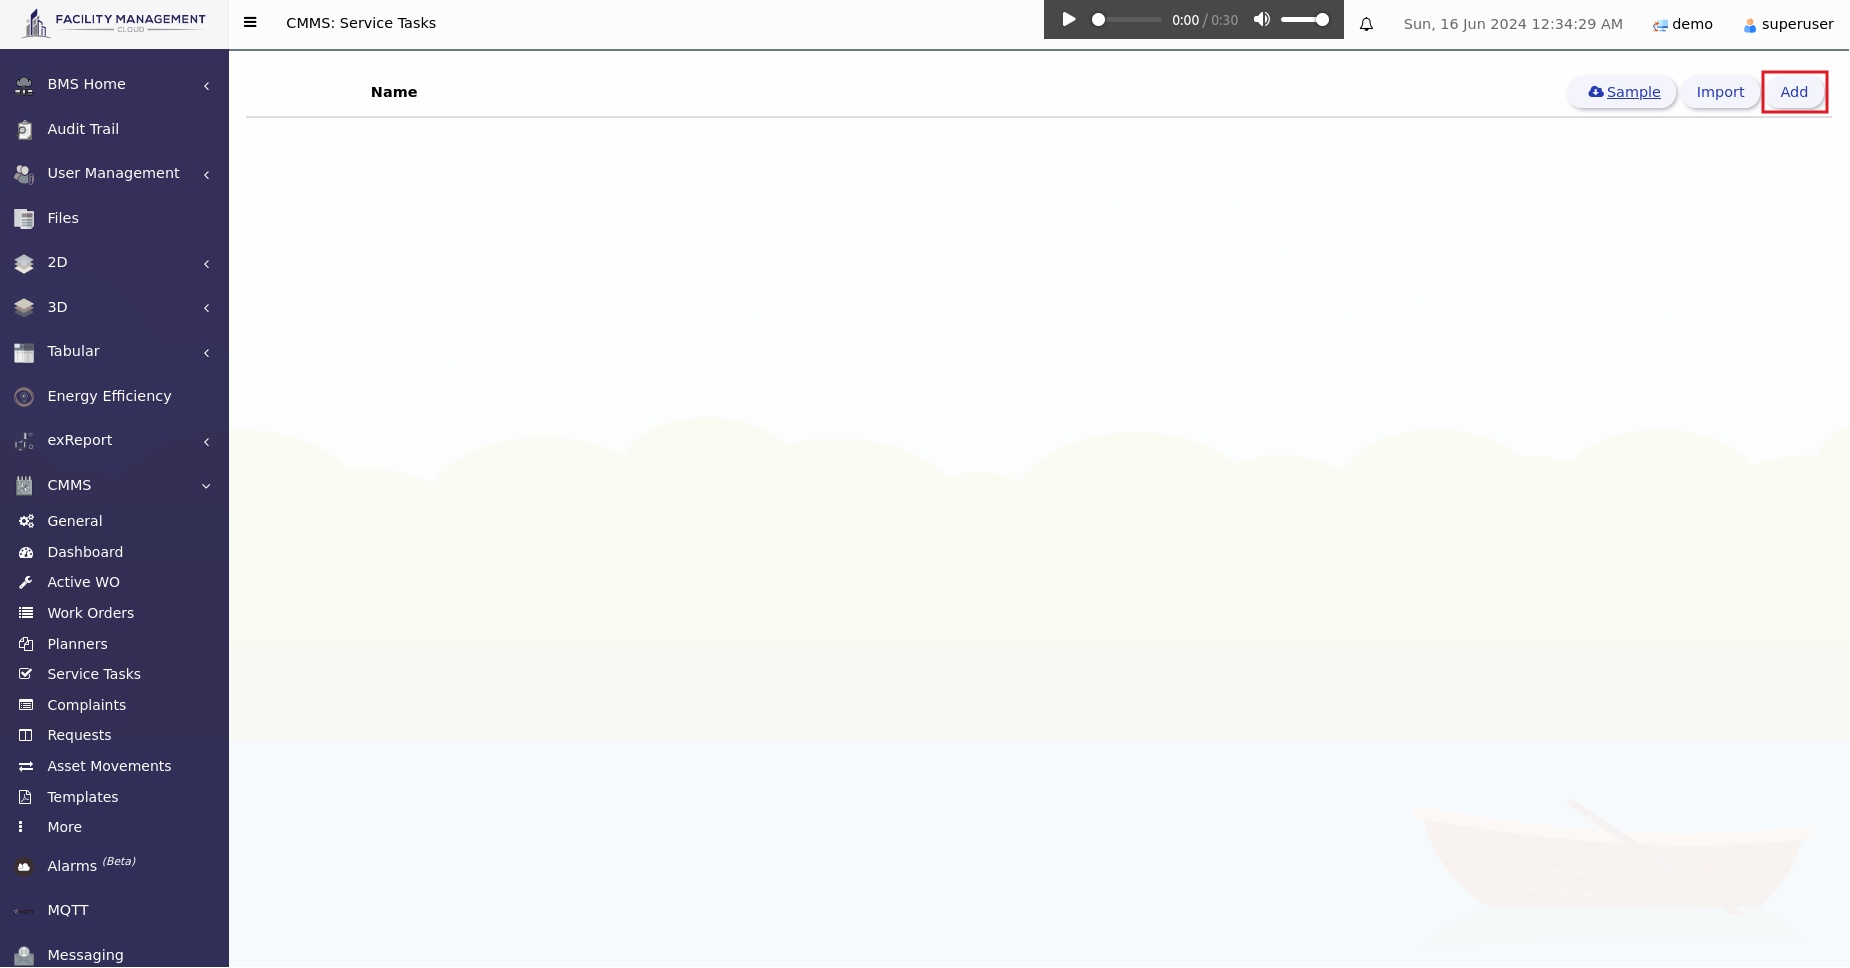
Click Add on the right corner.
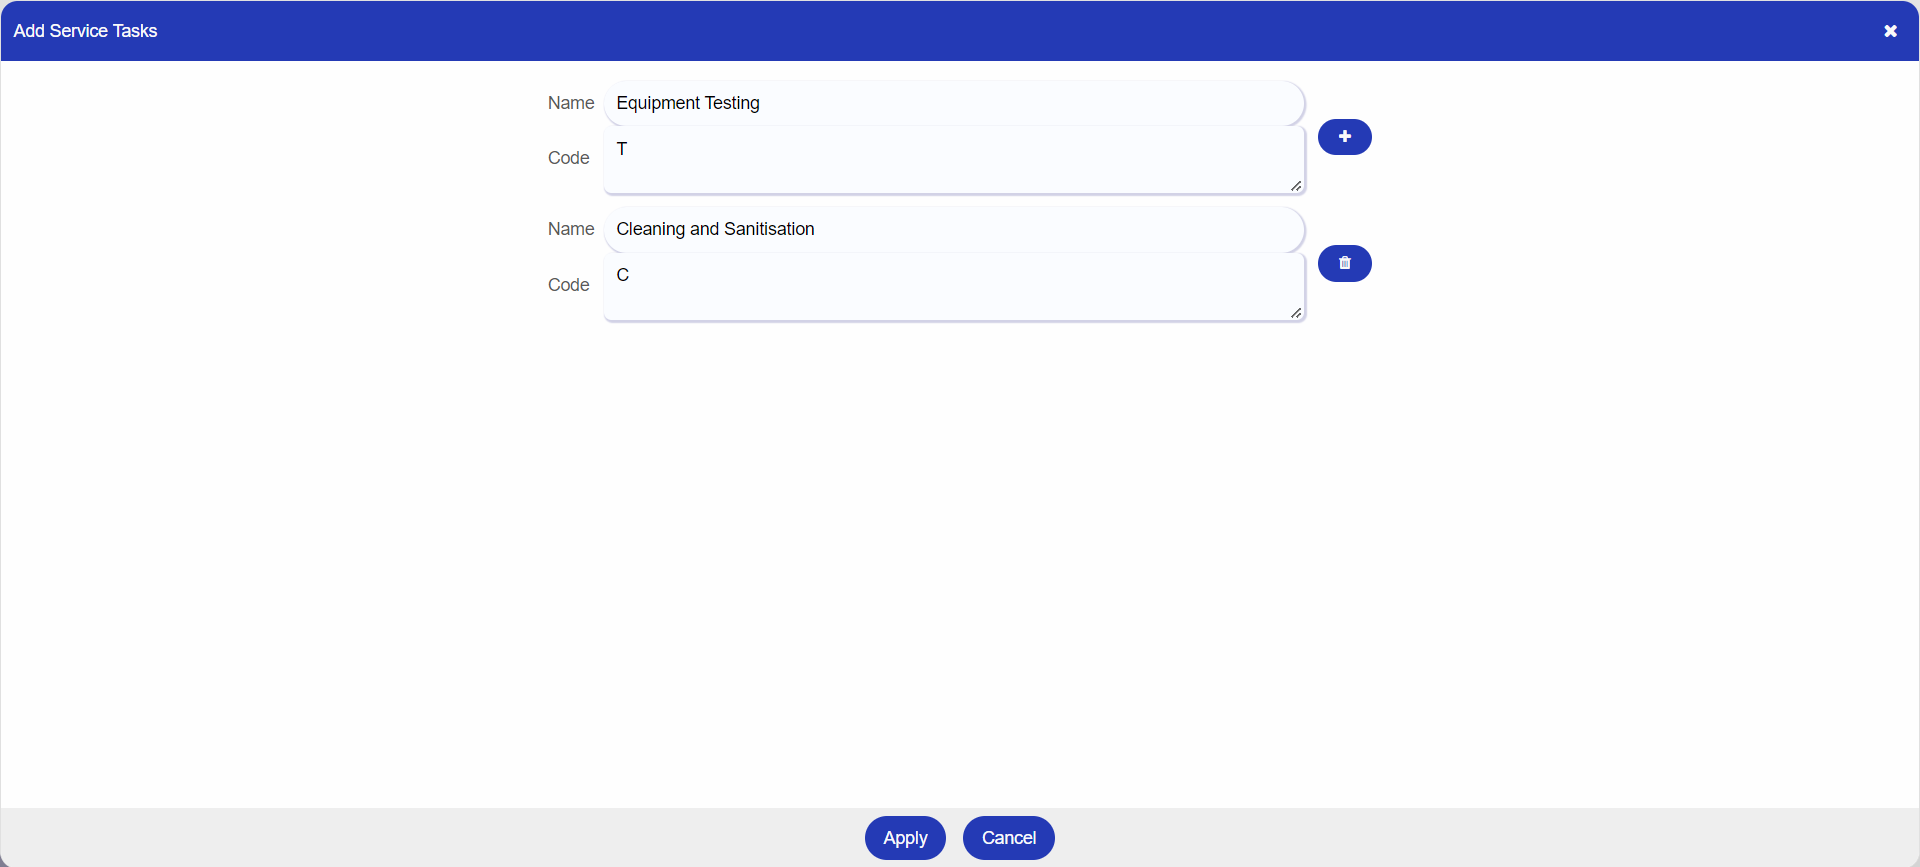
Fill in the name of the service tasks, then click apply.
 : Adding task.
 : Delete task.
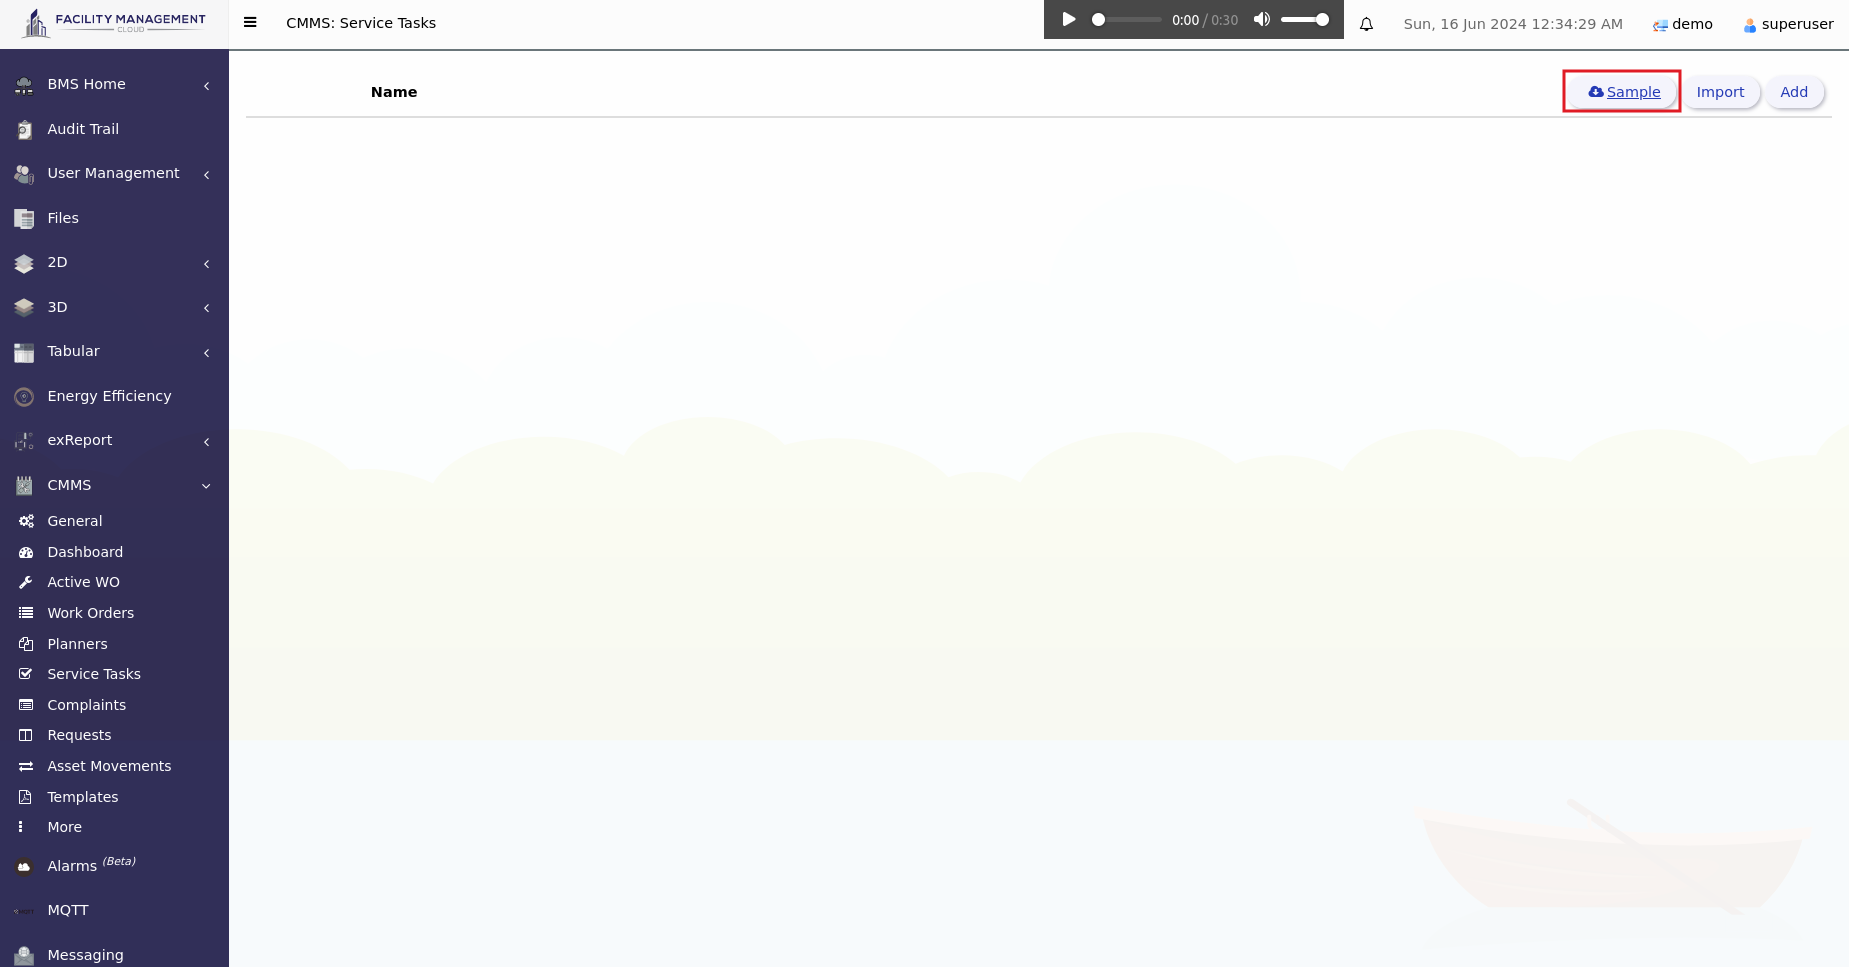
Click on the sample to download the sample excel file.
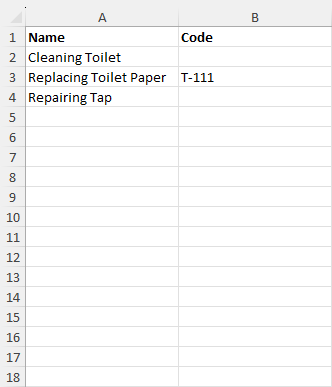
Fill in the name and the code(optional) of the service tasks with the following format as shown as left
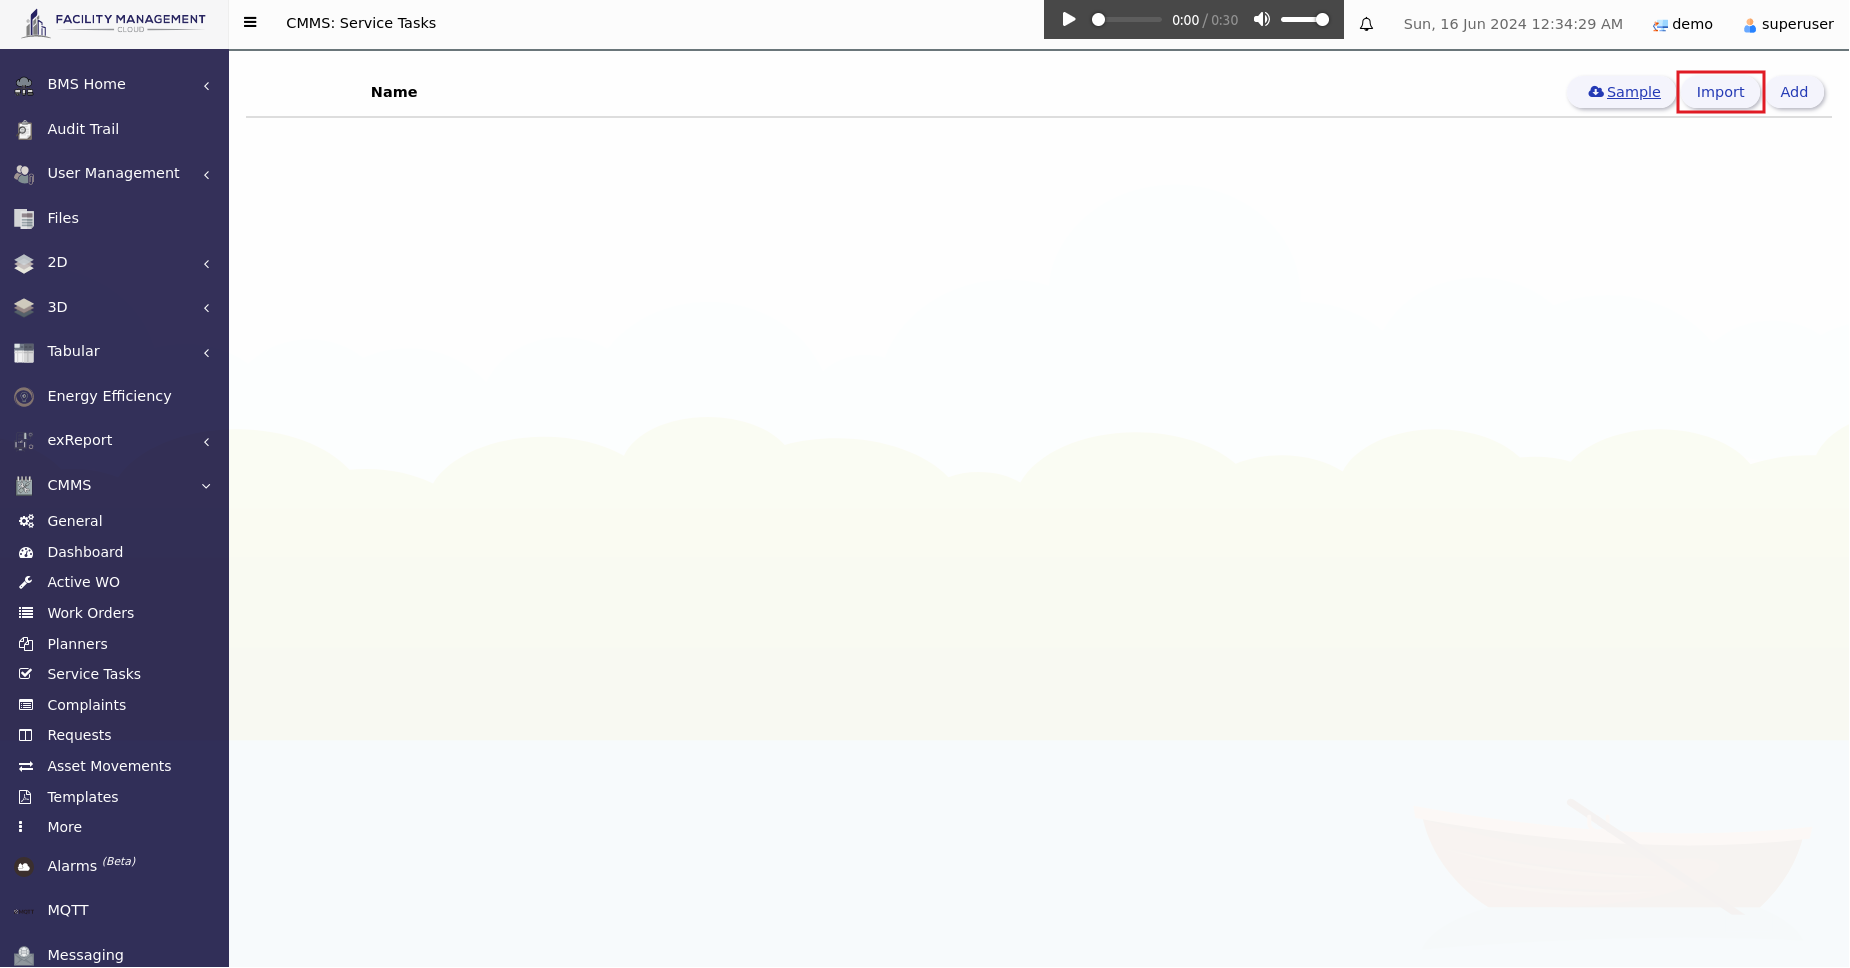
After you finished editing your table, save it. Then, click  button to import your Excel file.
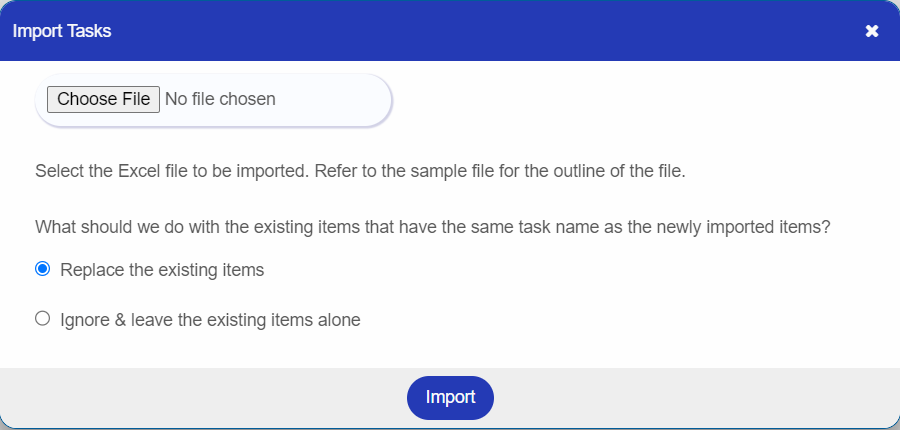
Choose the assets Excel file that you desire to import, then click Import.
Finally, the tasks from the list are imported successfully.
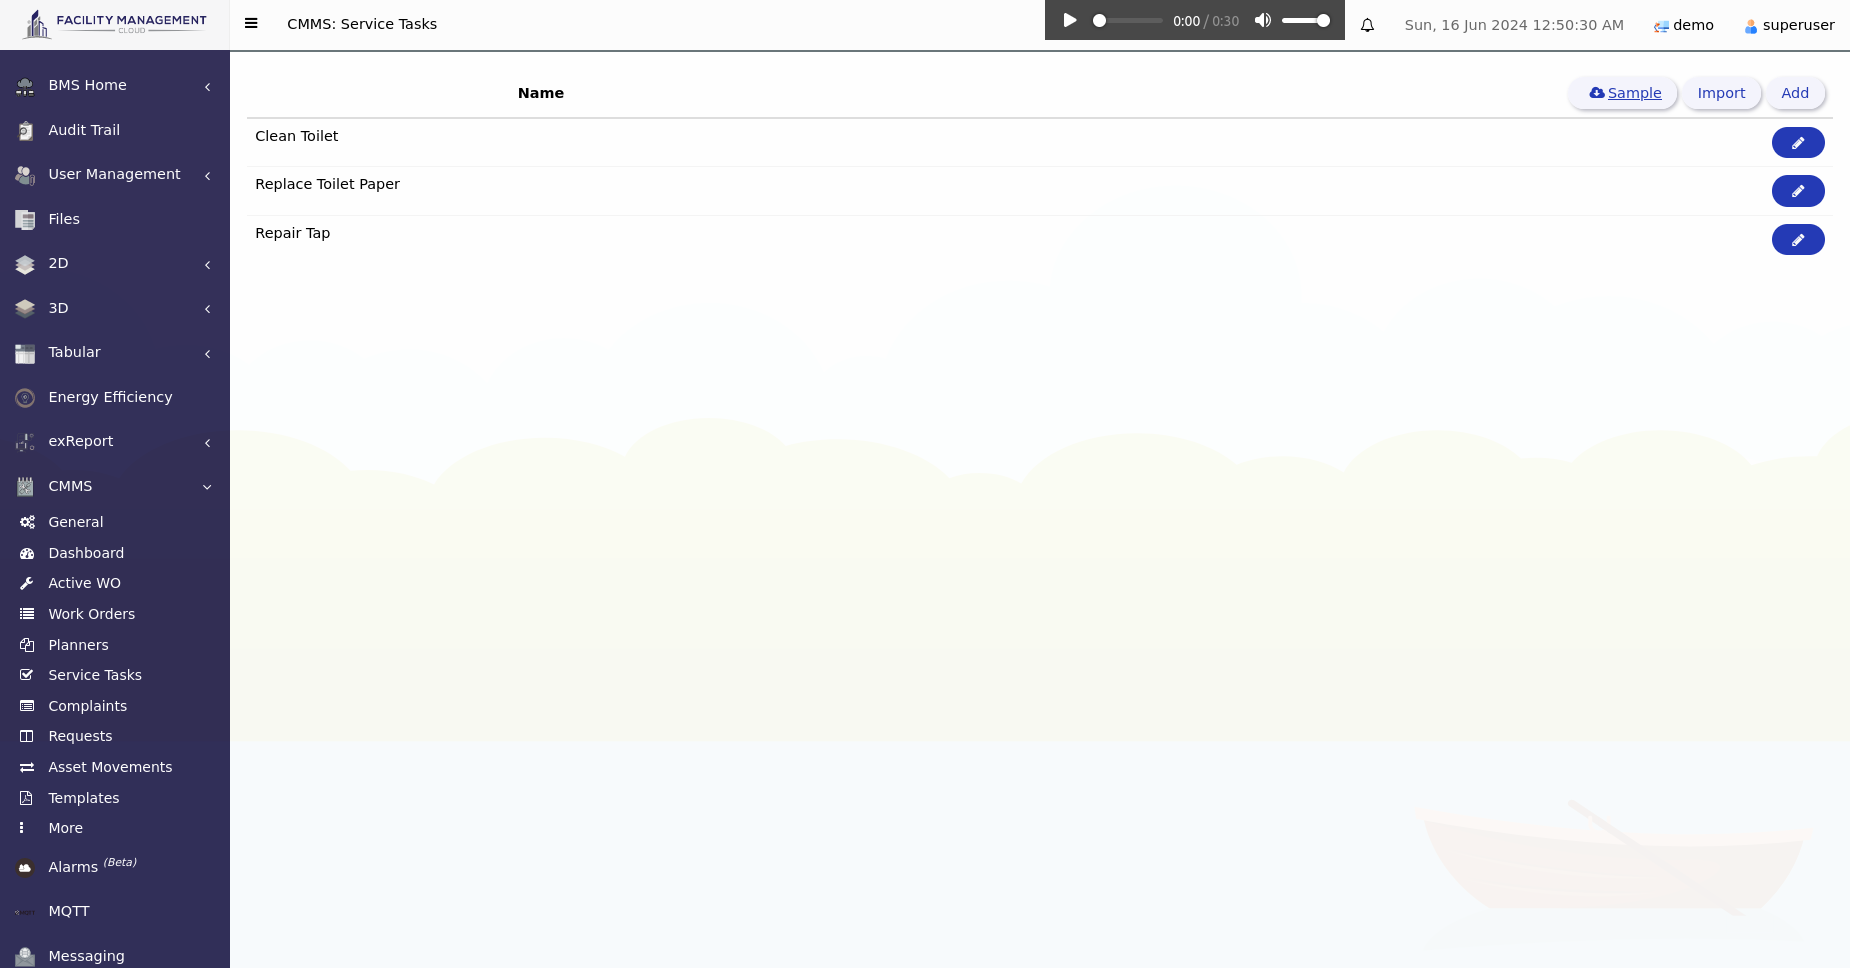
In CMMS, complaints refers to the issues, problems and concerns that are reported by the users, maintenance managers or stakeholders regarding the condition and situation of an asset. Complaints can arise from various sources, including employees, customers, residents, or anyone interacting with the assets in question. CMMS systems often include a feature to manage and address these complaints effectively.
Maintenance managers can predetermine the complaints that would happen in the future, and associate the possible complaints to the respectively assets.
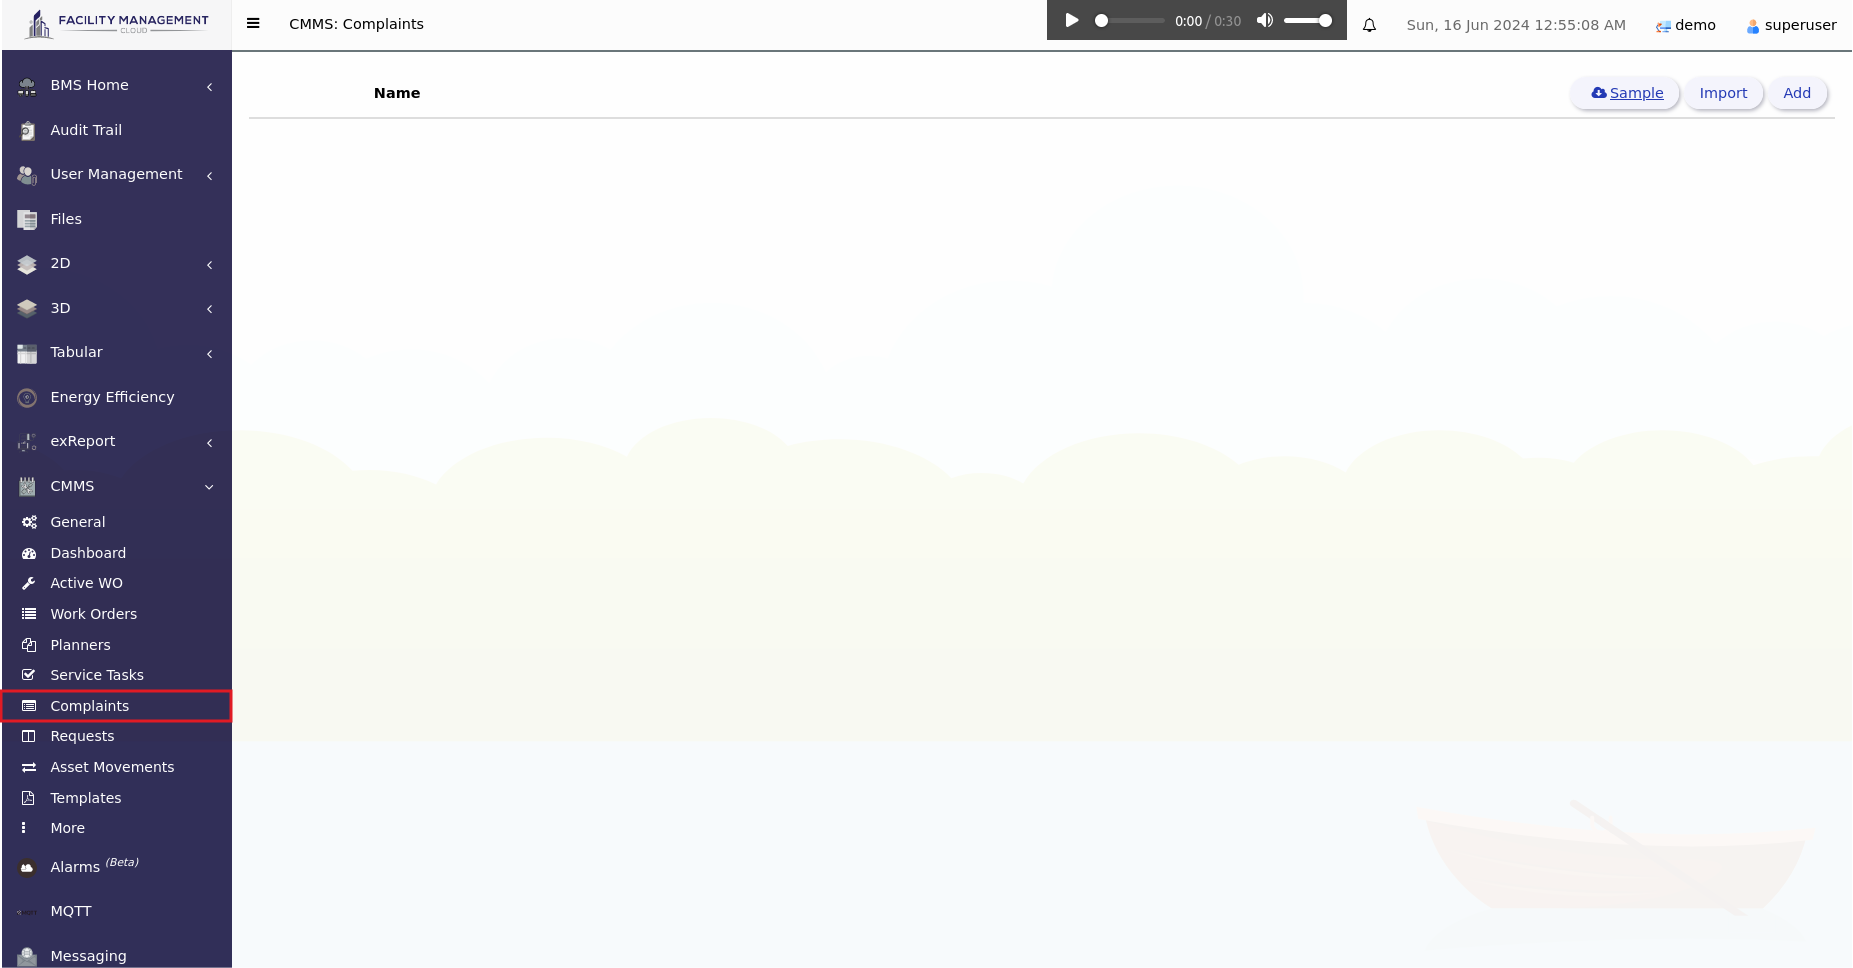
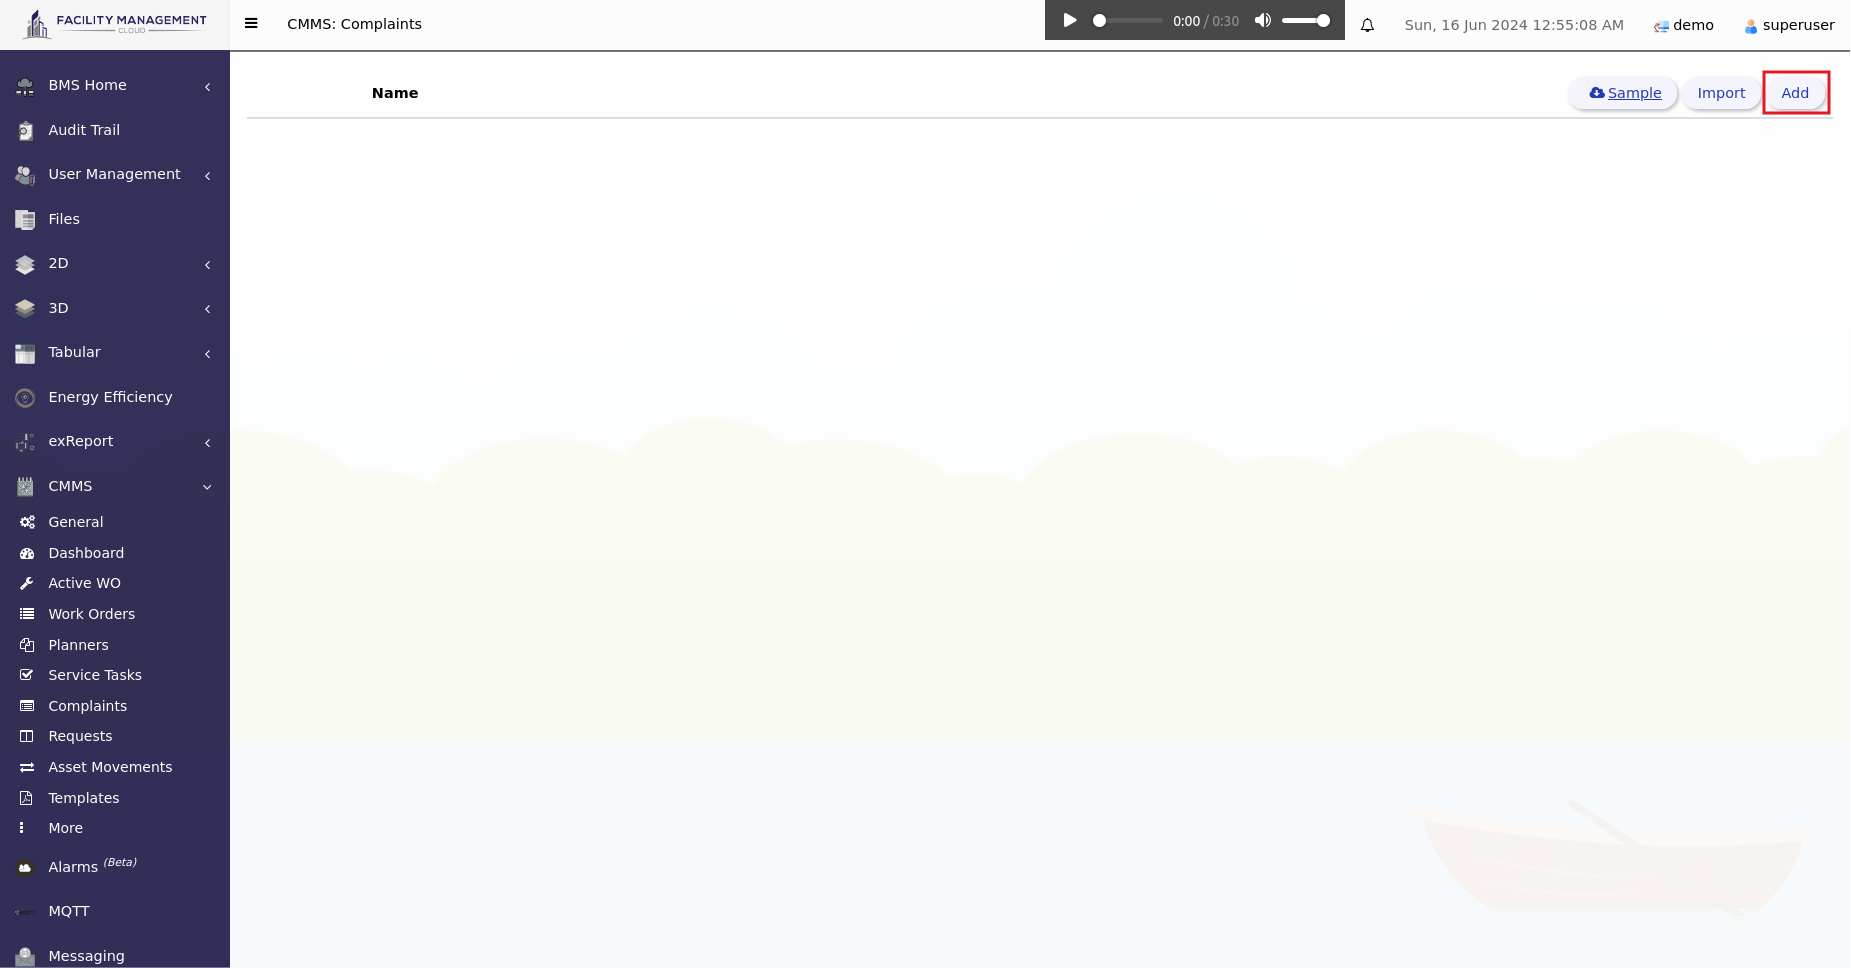
Click Add on the right corner.
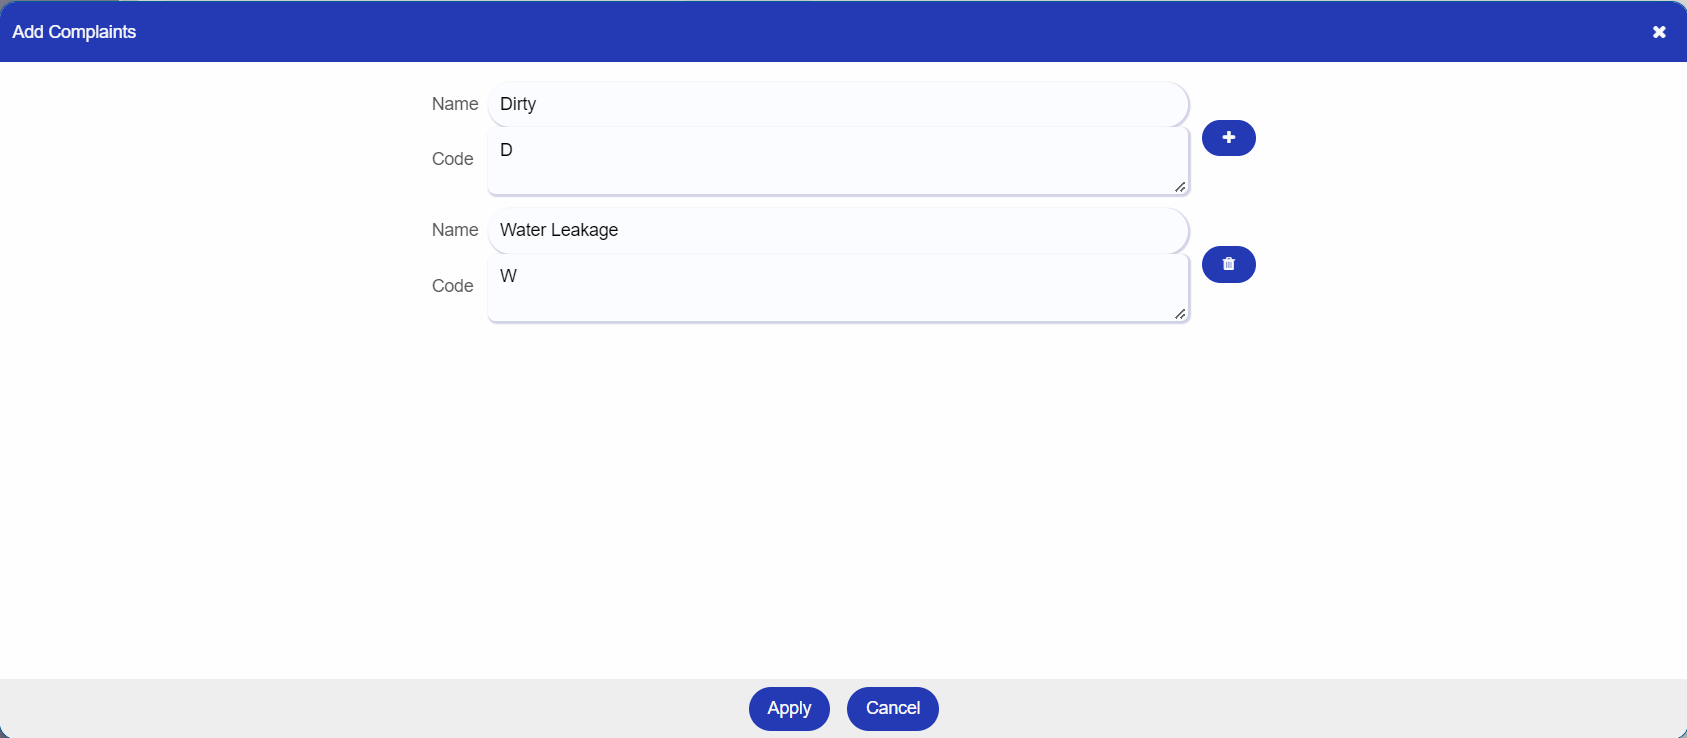
Fill in the name of the service tasks, then click apply.
: Adding task.
: Delete task.
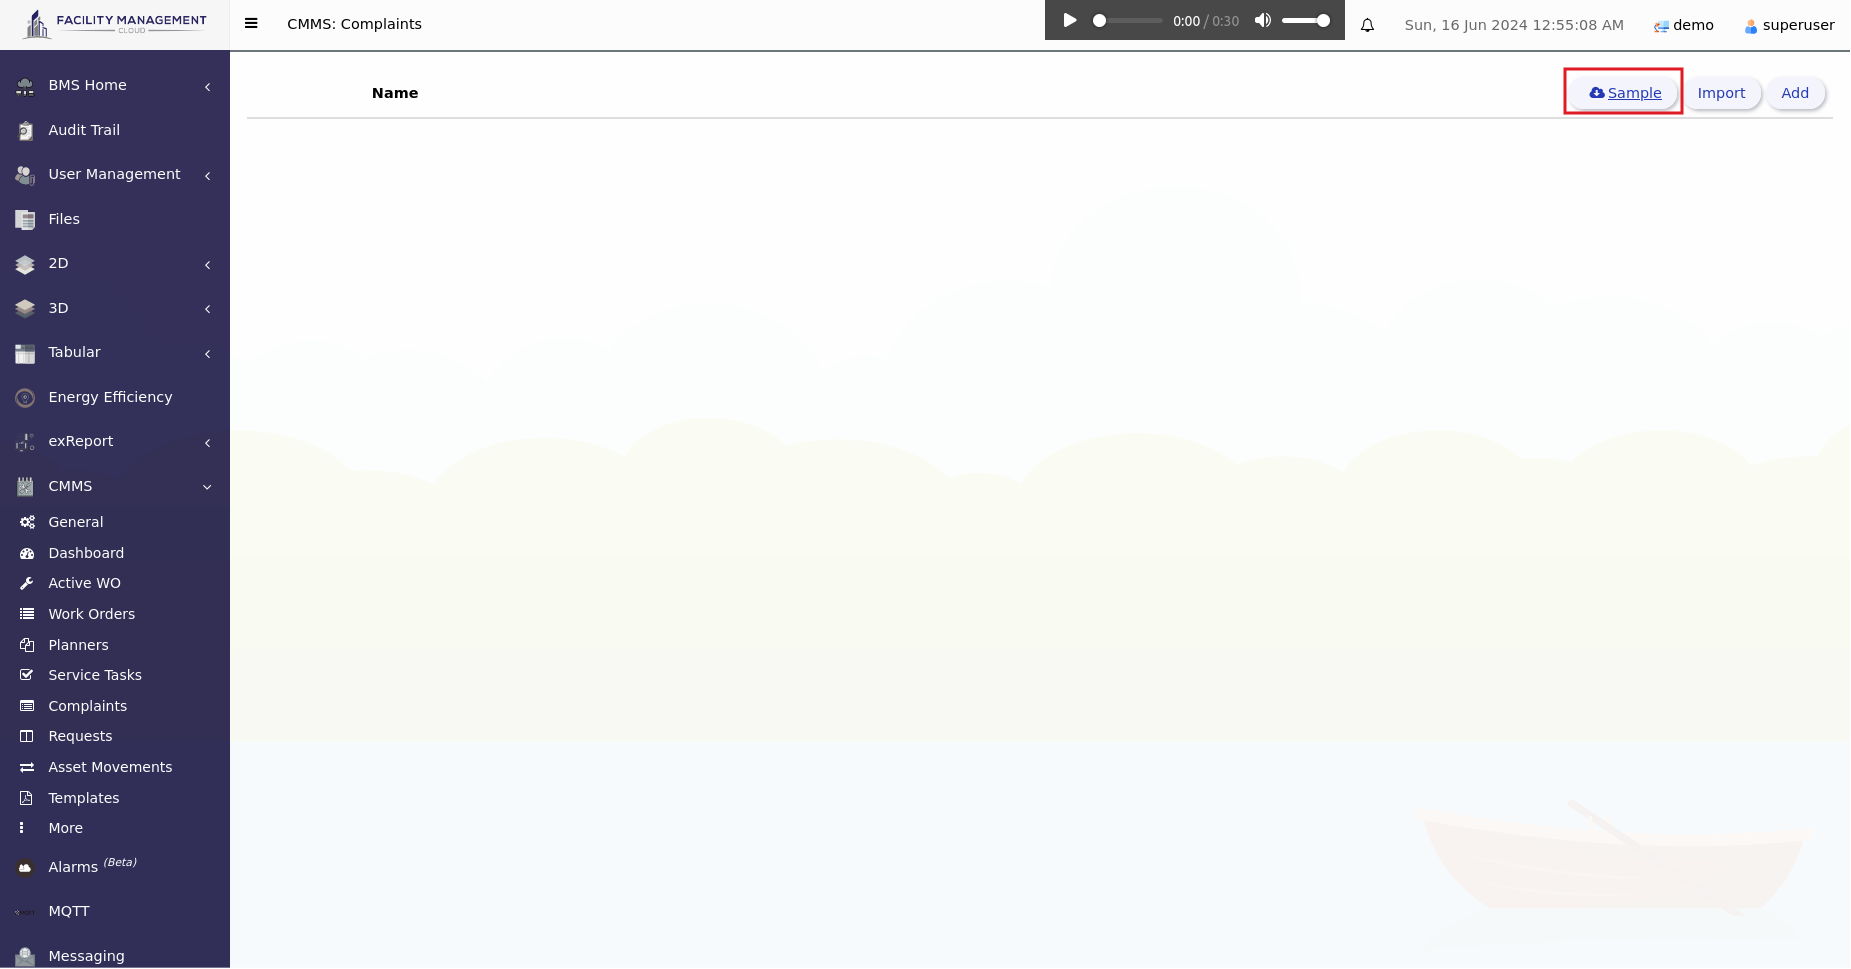
Click on the sample to download the sample excel file.
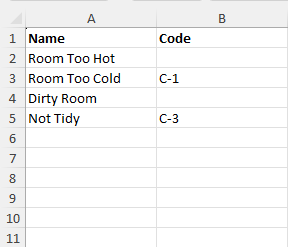
Fill in the name and the code(optional) of the service tasks with the following format as shown as left
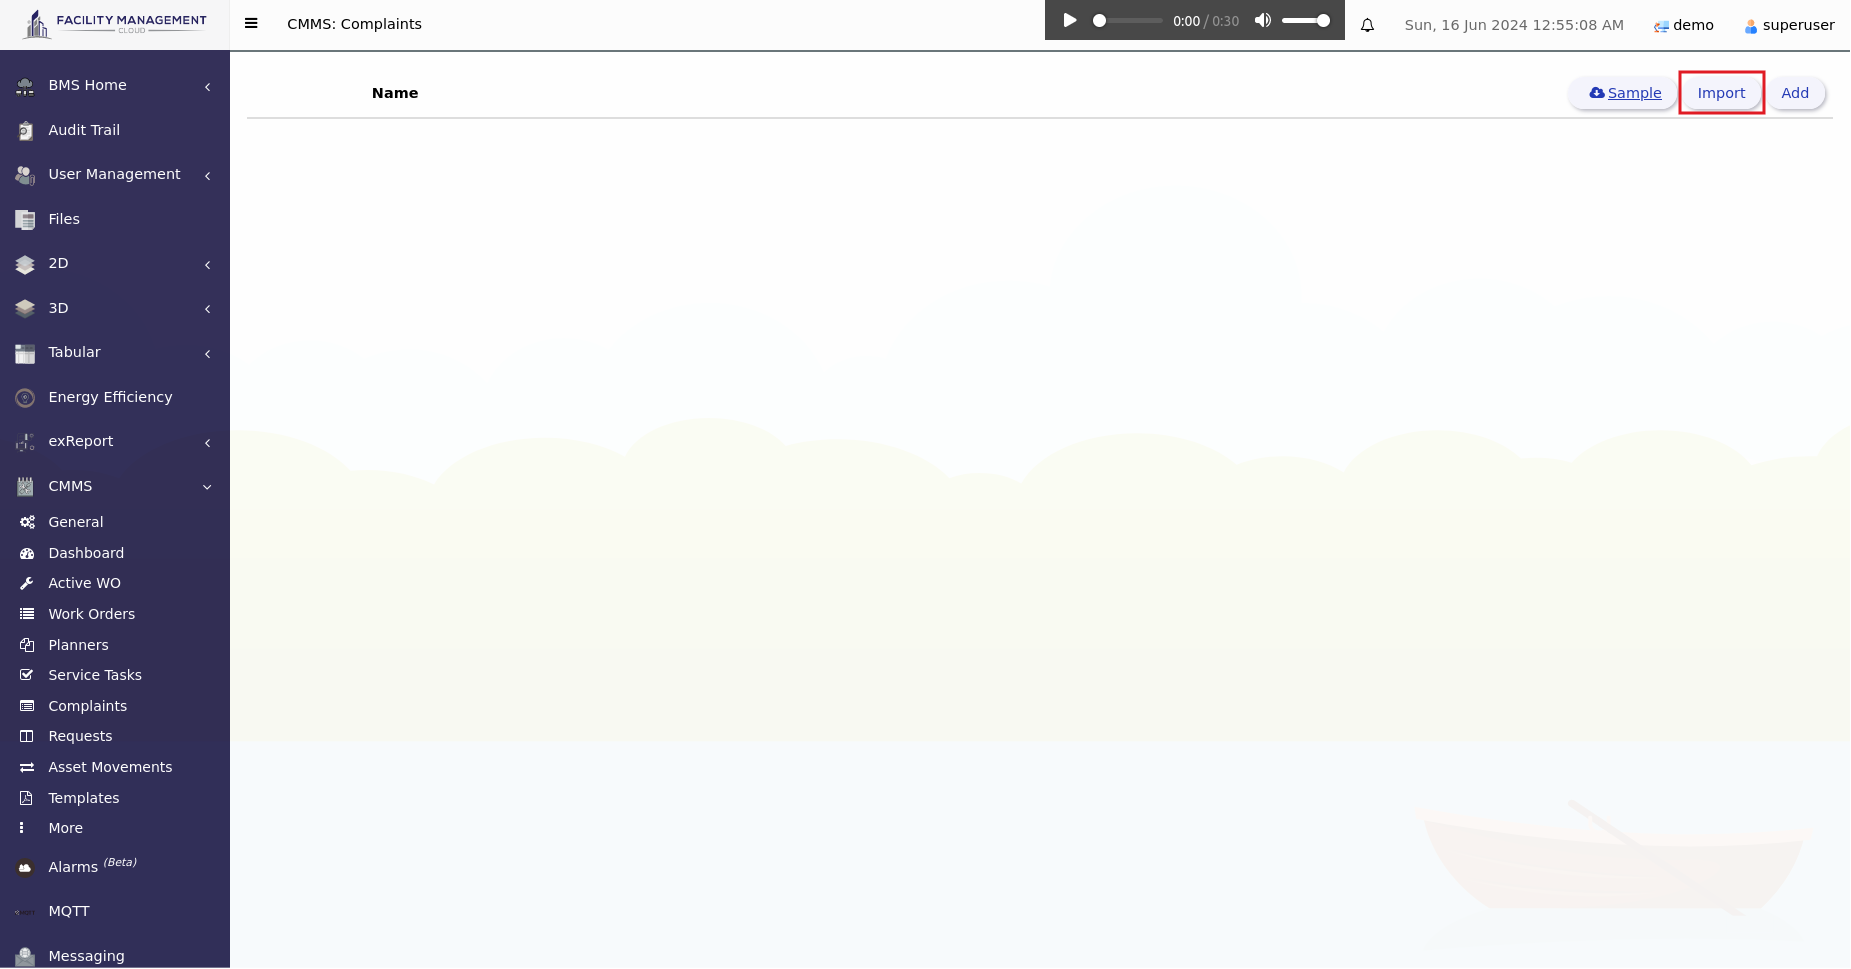
After you finished editing your table, save it. Then, click button to import your Excel file.
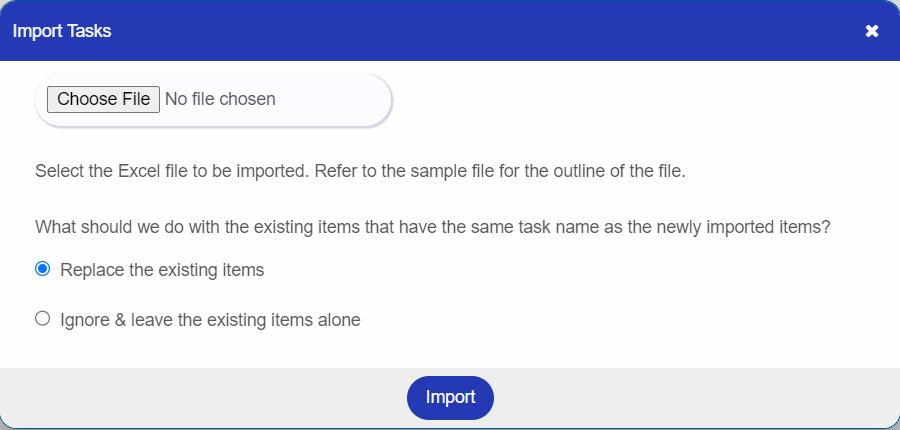
Choose the assets Excel file that you desire to import, then click Import.
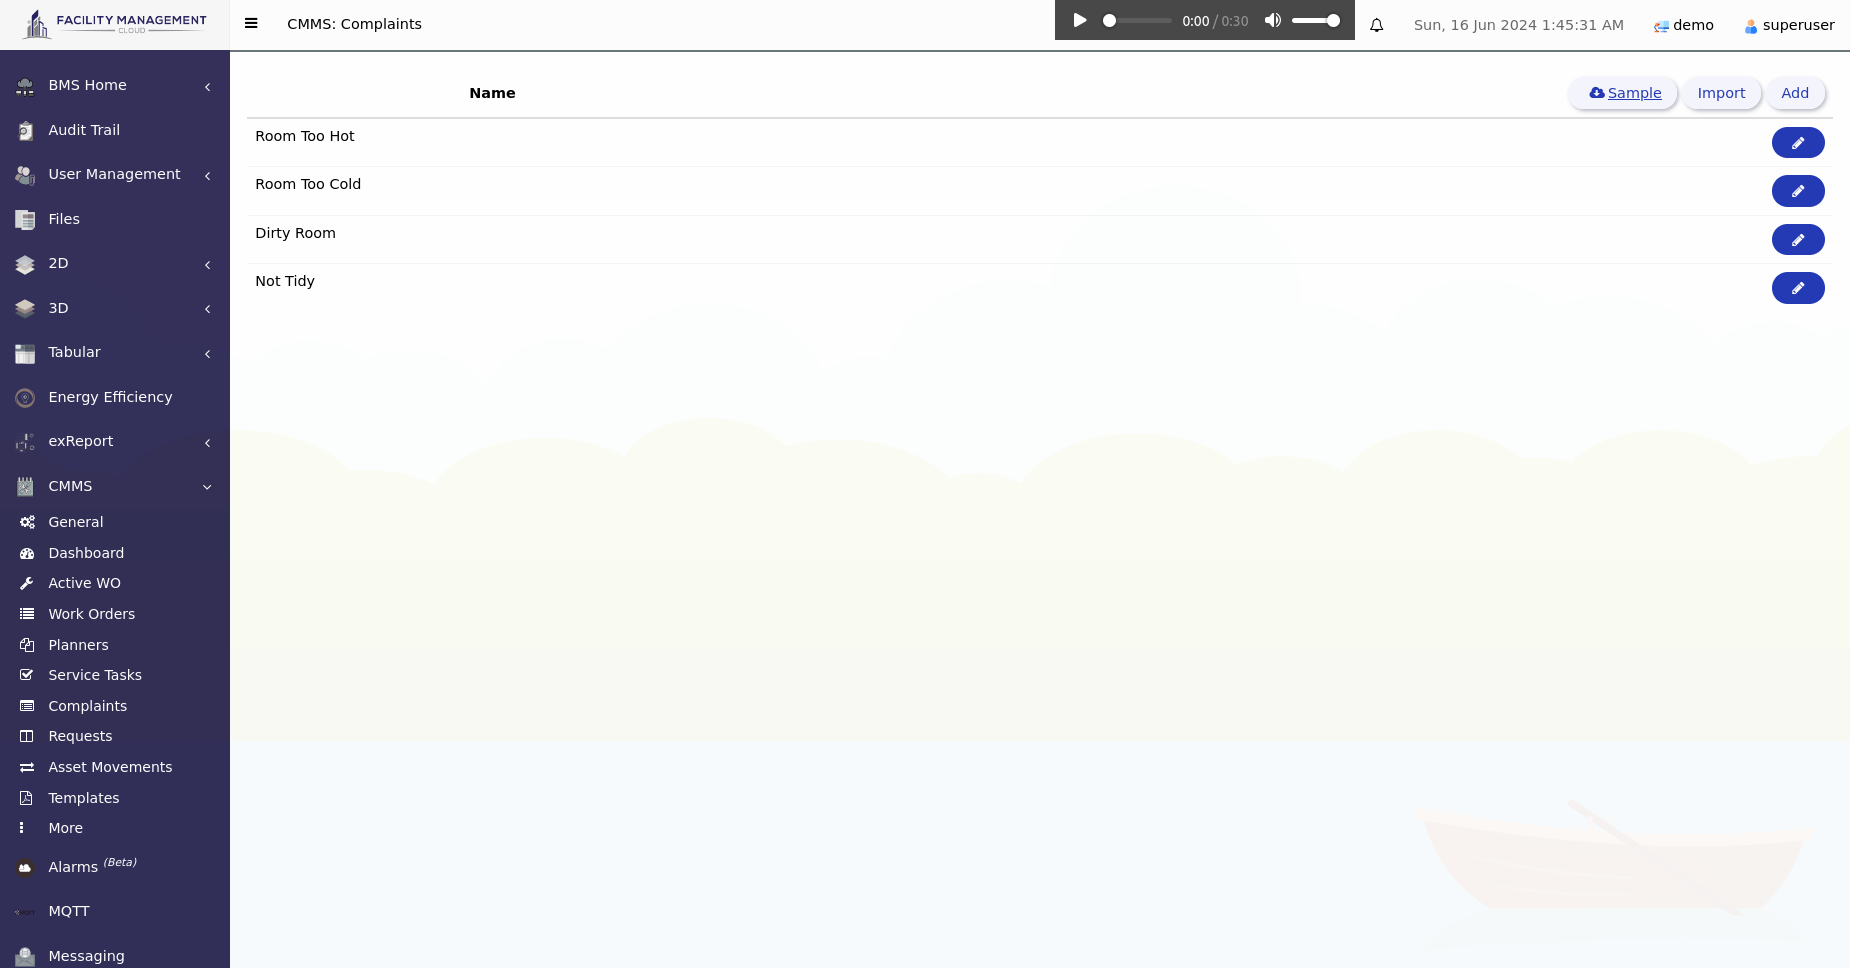
Finally, the tasks from the list are imported successfully.
In CMMS, the vendor is an external user within the workspace. A vendor can typically be an asset supplier, a professional maintenance provider, or other roles. The vendor will have less permission accessibility than the workspace users.
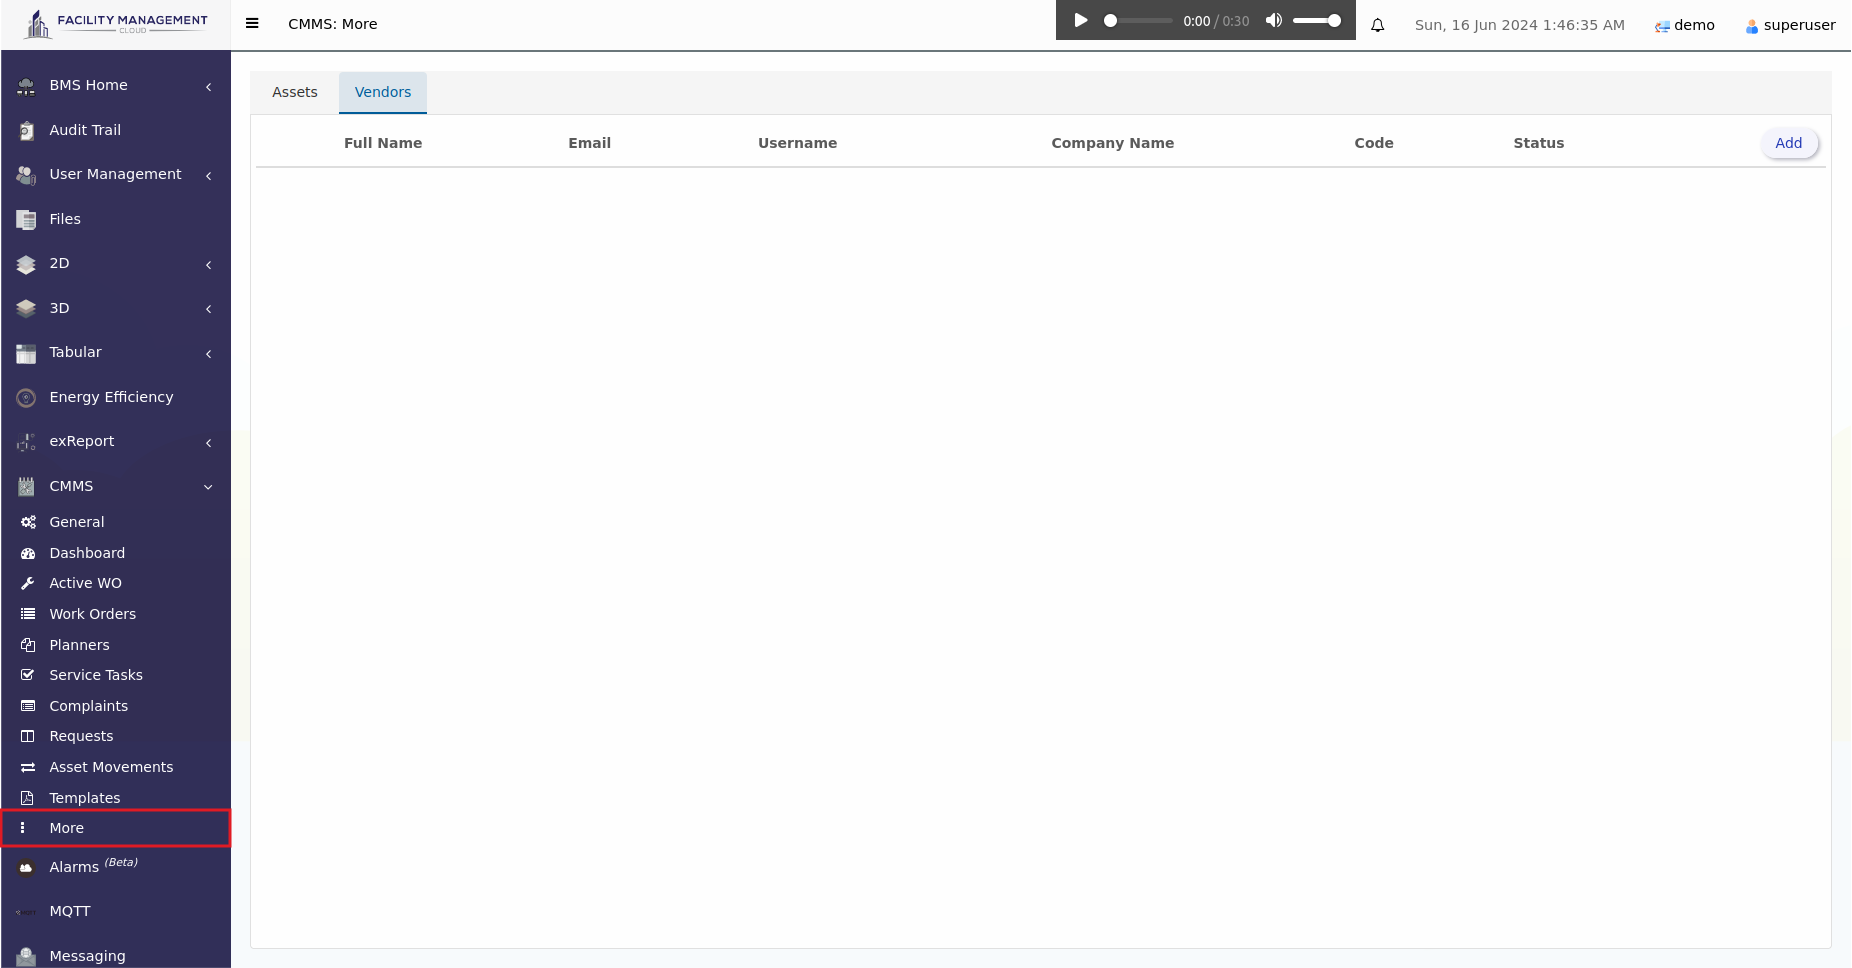
Click on the "Add" button.
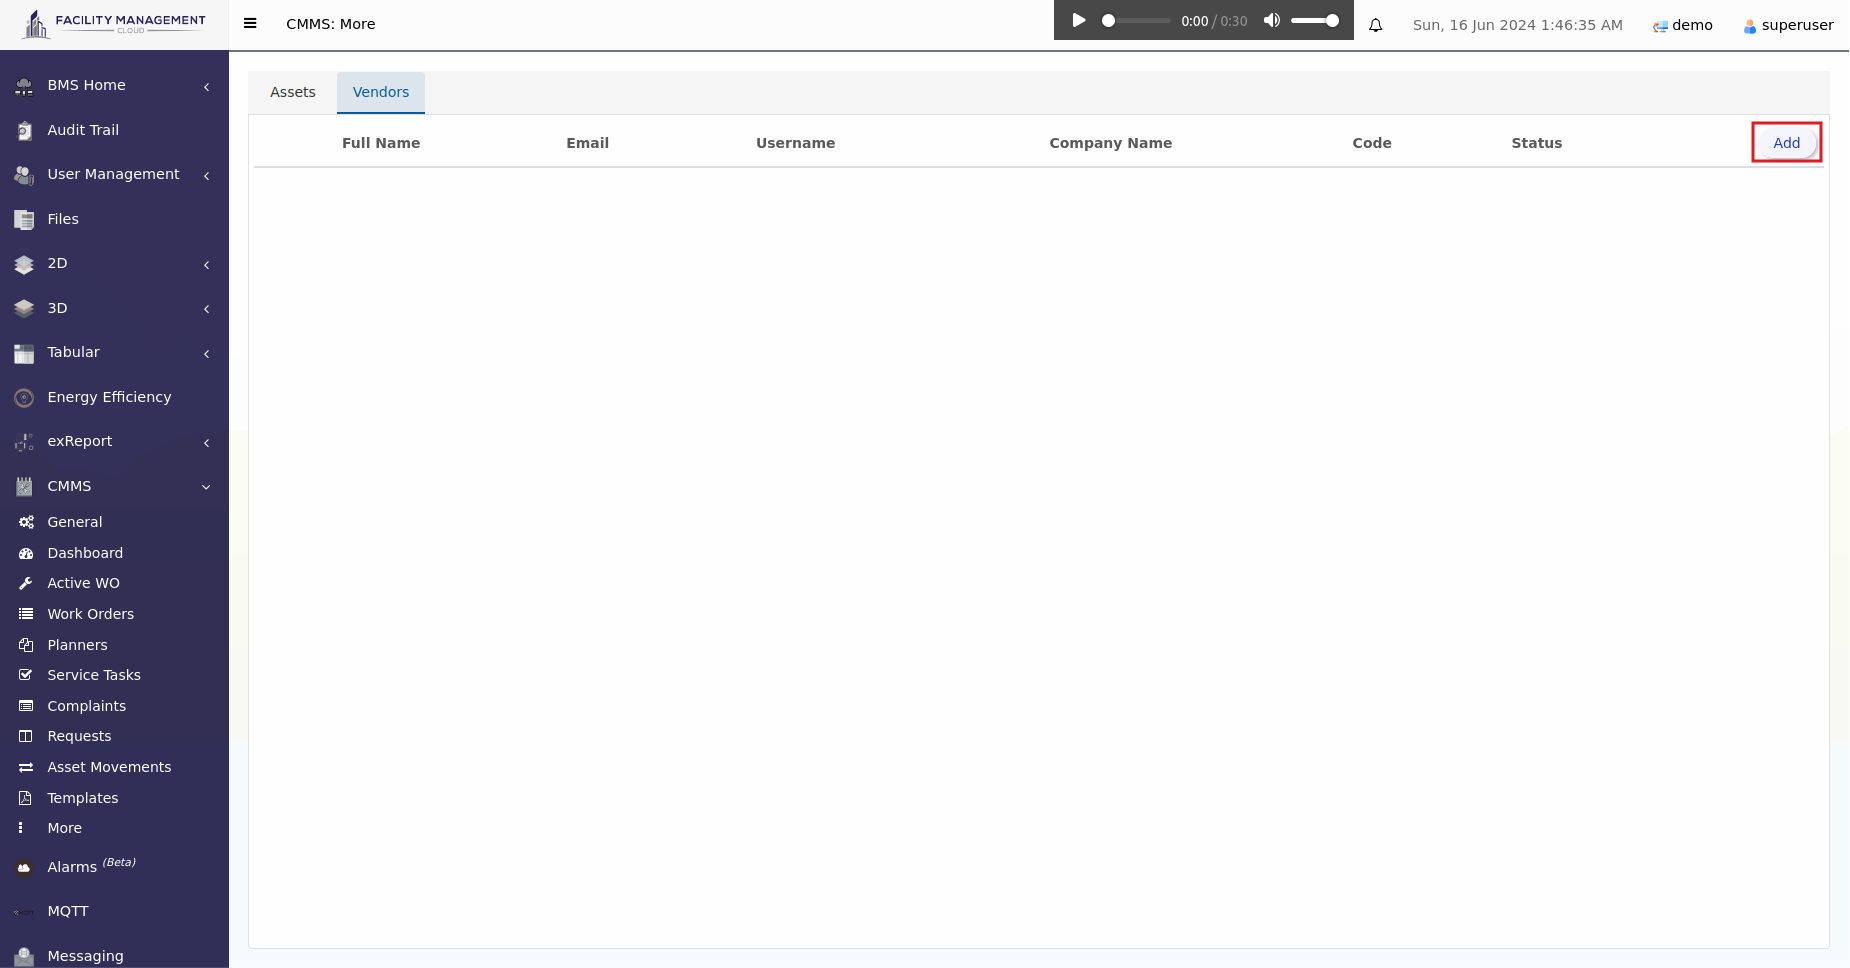
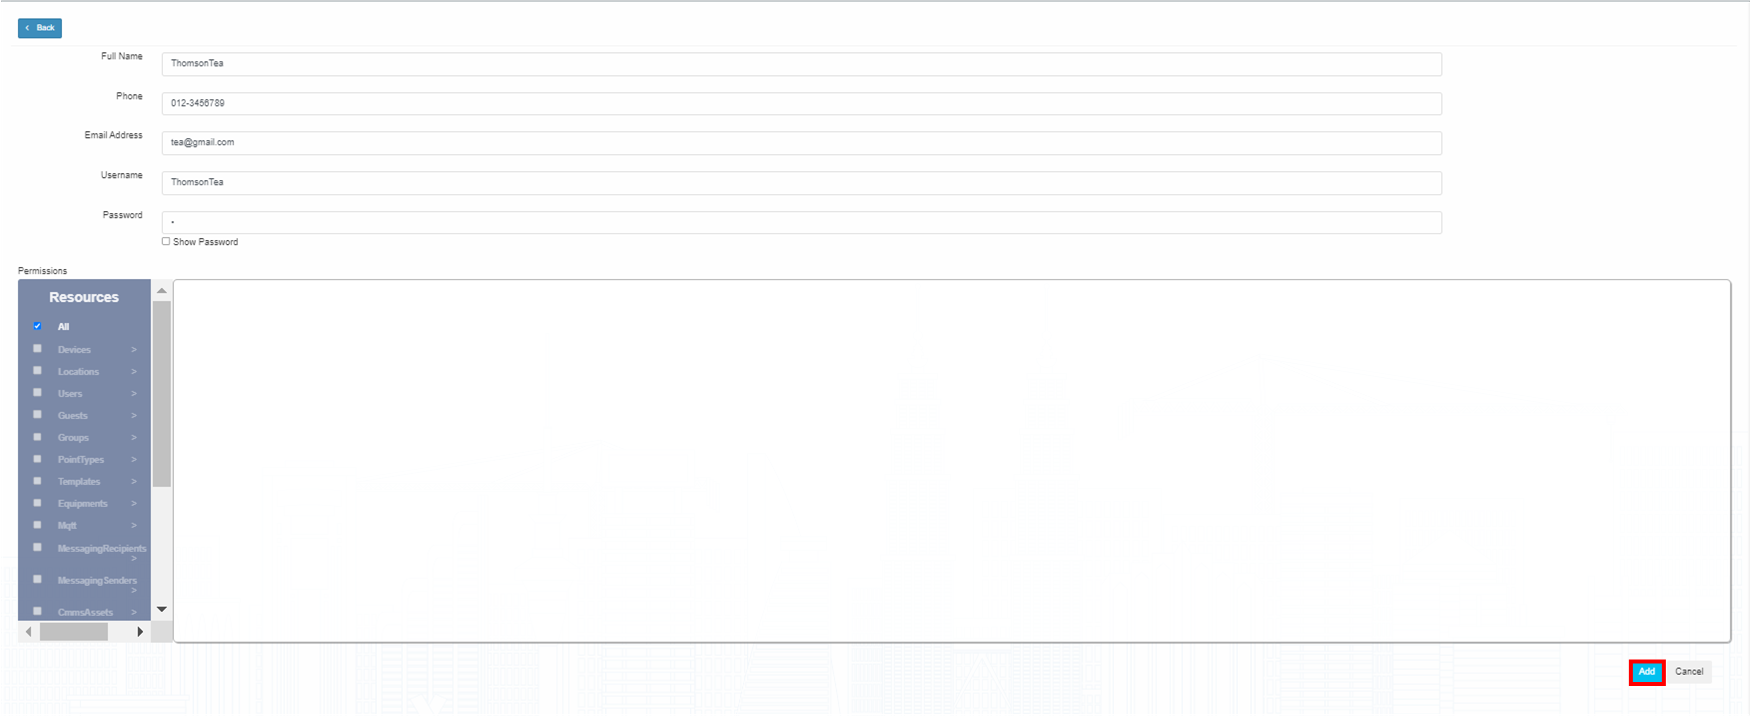
There have two section need to fill in by user, that is Vendor Info and Vendor Permissions:
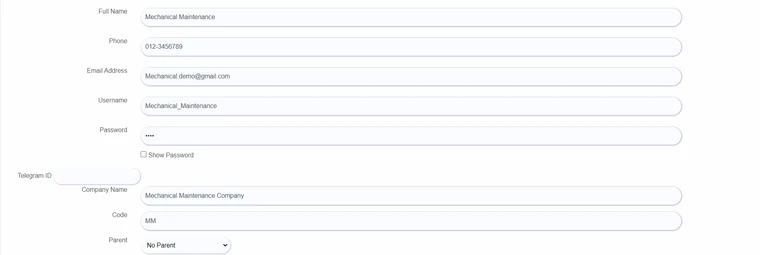
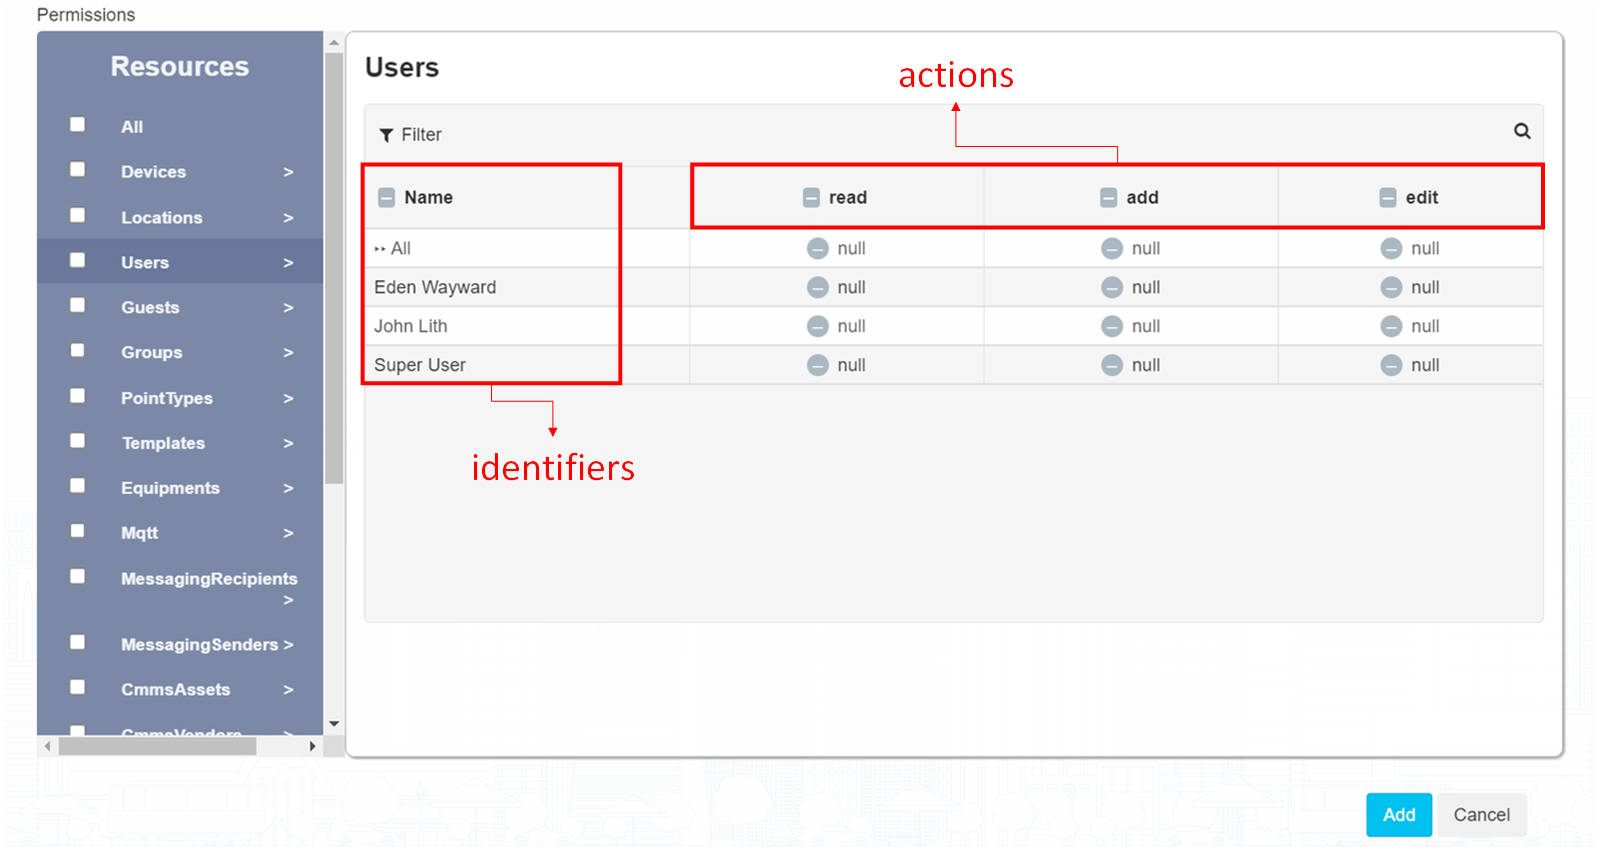
To authorise permissions for the vendor, you can grant the necessary permissions by clicking on the respective actions and identifiers.
Quick Guide:
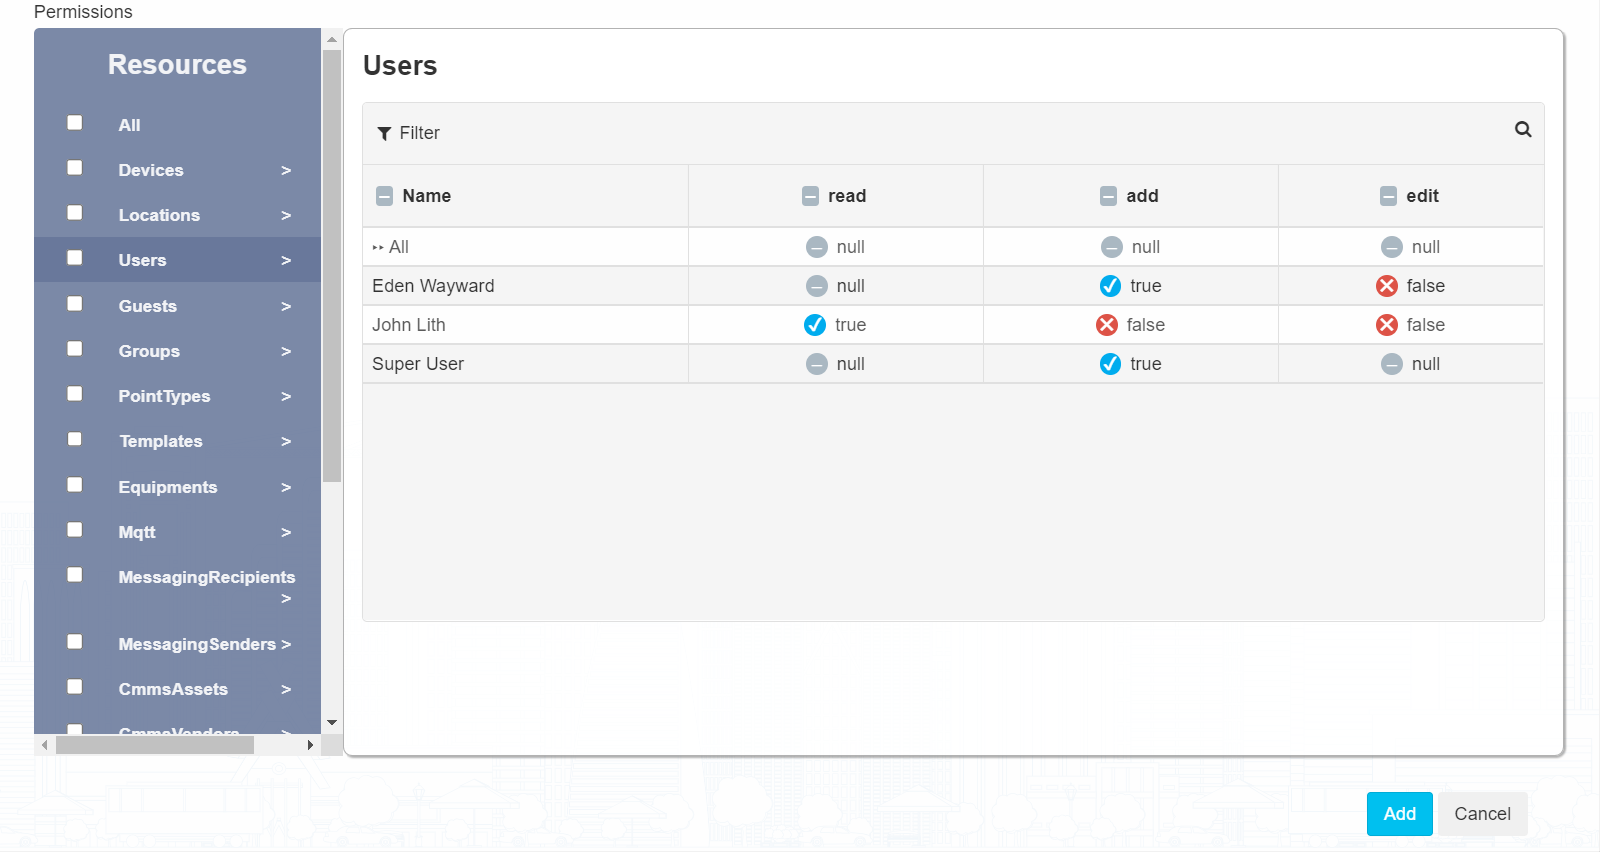
You can click on the identifiers (name) or the actions (read, add, edit, etc) to simply make changes of the permission by row and column.
If you want to assign all permissions for a particular resource, simply check the checkbox next to the resource's name. This will grant the user access to all available permissions for that resource.
Example:
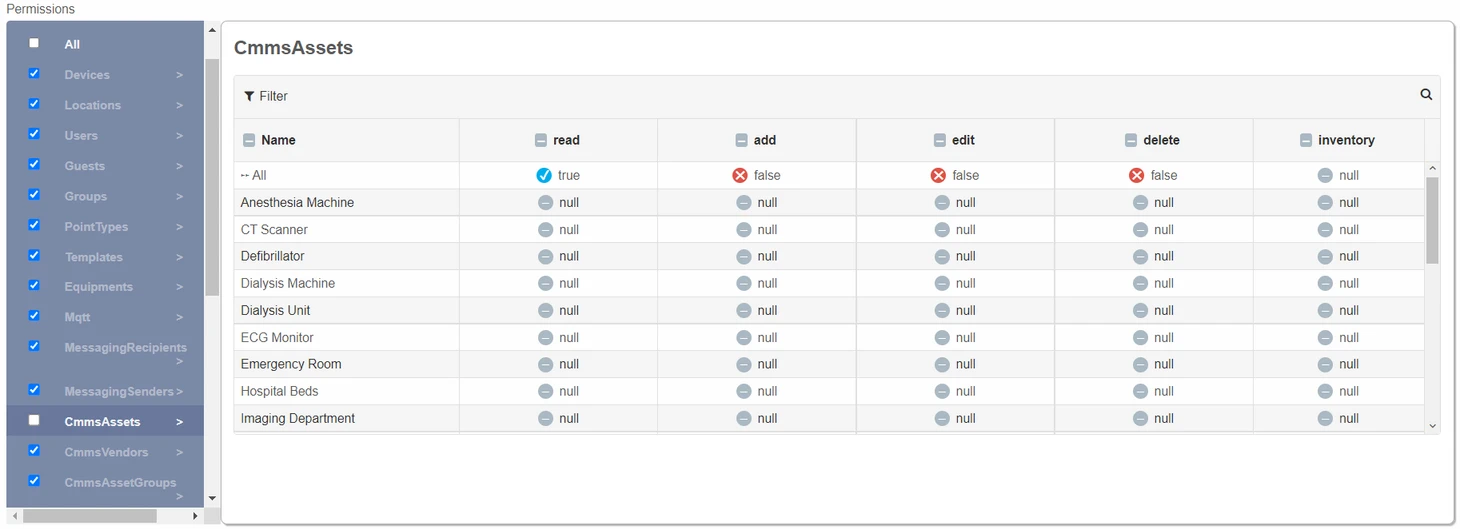
After you finished editing your configuration, click Apply.
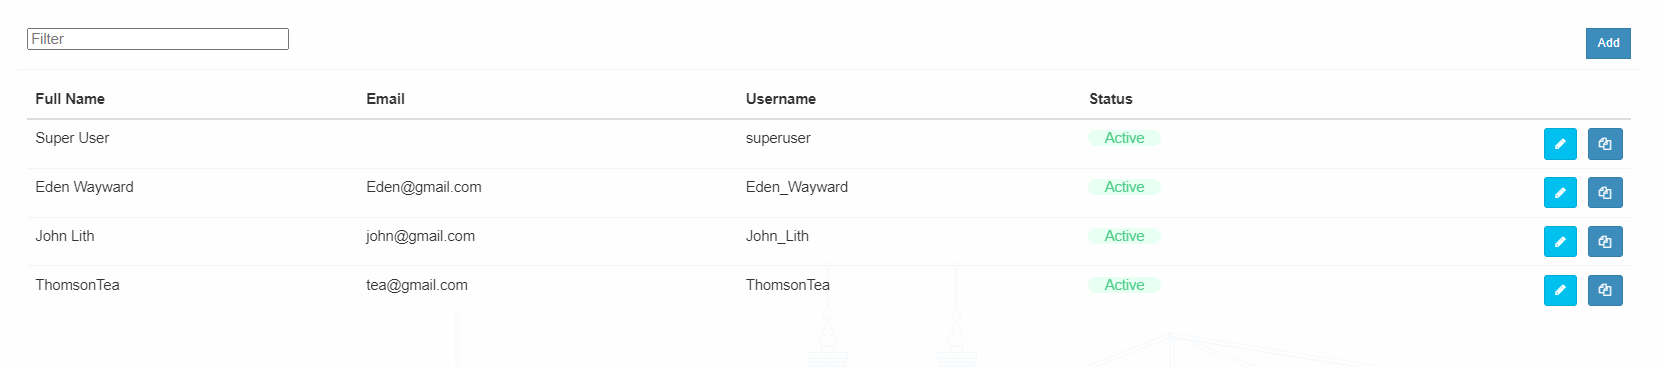
Finally, your vendor has been added successfully.

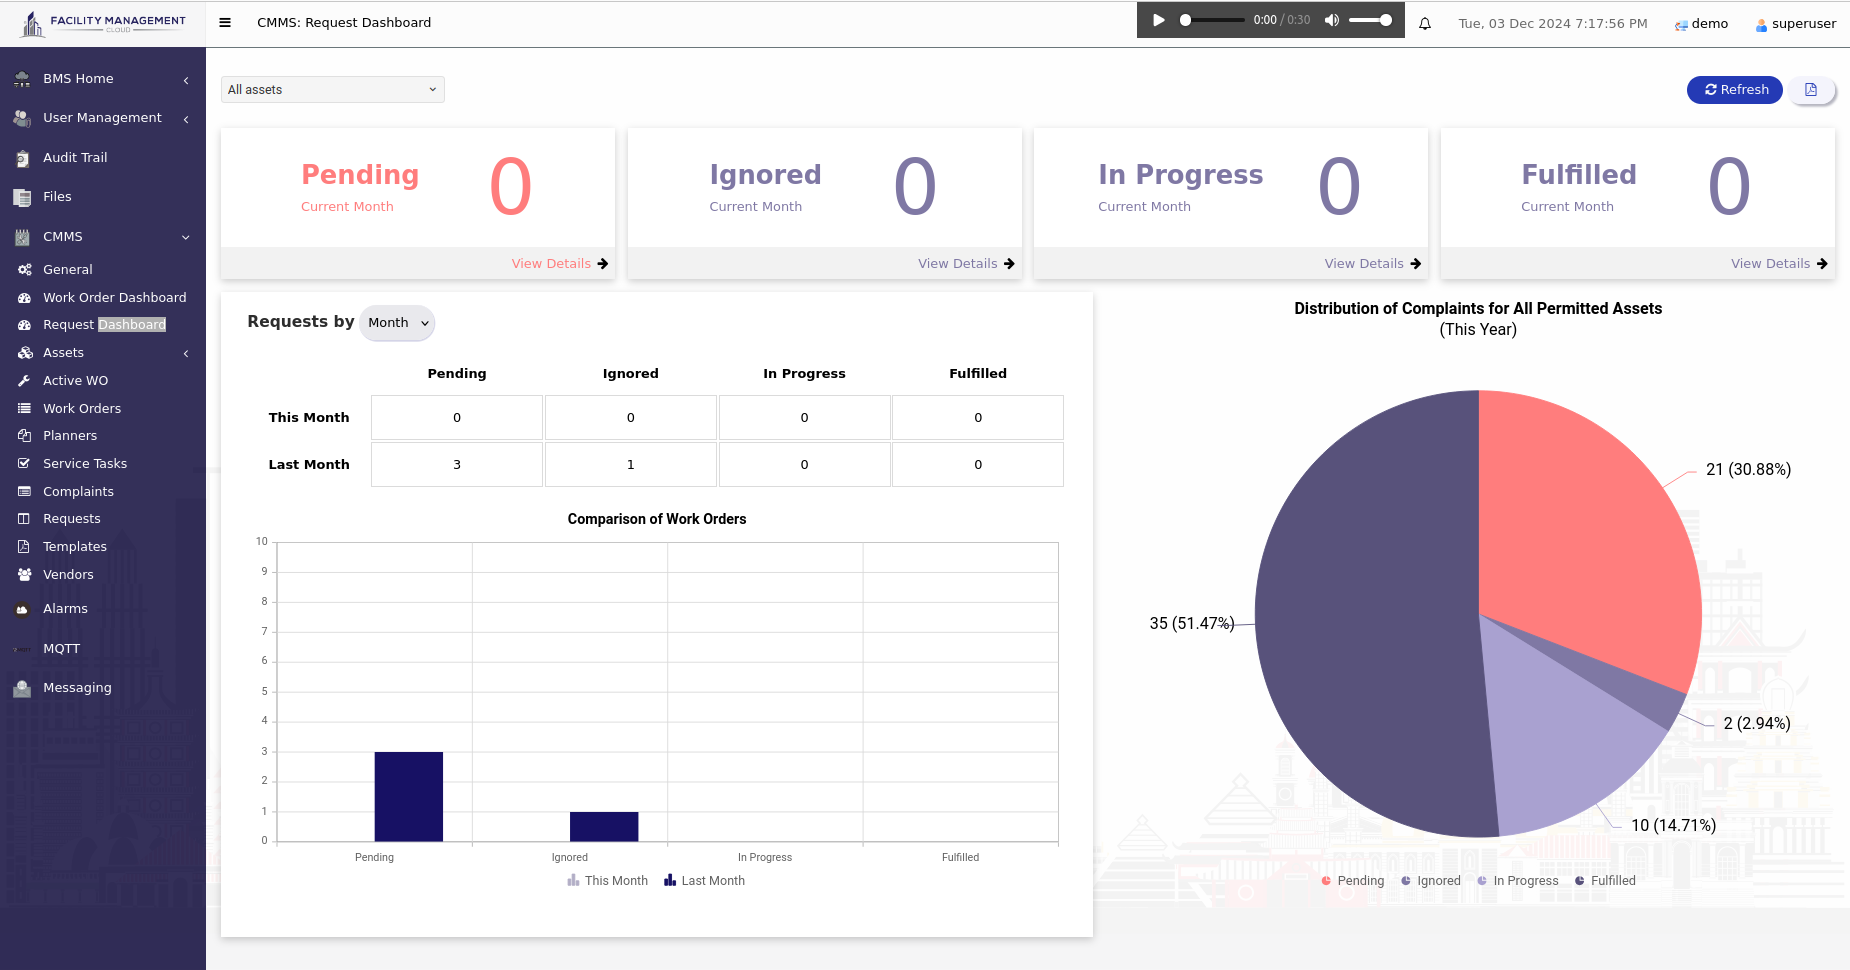
A request is the application for maintenance of the corresponding asset when an asset is encountering problems or issues. It will be generated when a person who has scanned an asset's QR code and makes a complaint to a specific asset, the corresponding requests for the assets are generated. Consequently, CMMS will generate a draft work order concurrently with the request if an asset has the default planner associated with it. Otherwise, a work order will not be generated through the request.
This feature acts as preventive maintenance that helps institutions extend the lifespan of their assets effectively. For instance, asset users could notice an issue on the assets, directly submit the complaint to the maintenance managers through the QR code for requesting the improvements or maintenance work. Simultaneously, maintenance managers can swiftly prescribe the best solutions for maintenance, resulting in avoiding assets from becoming critical.
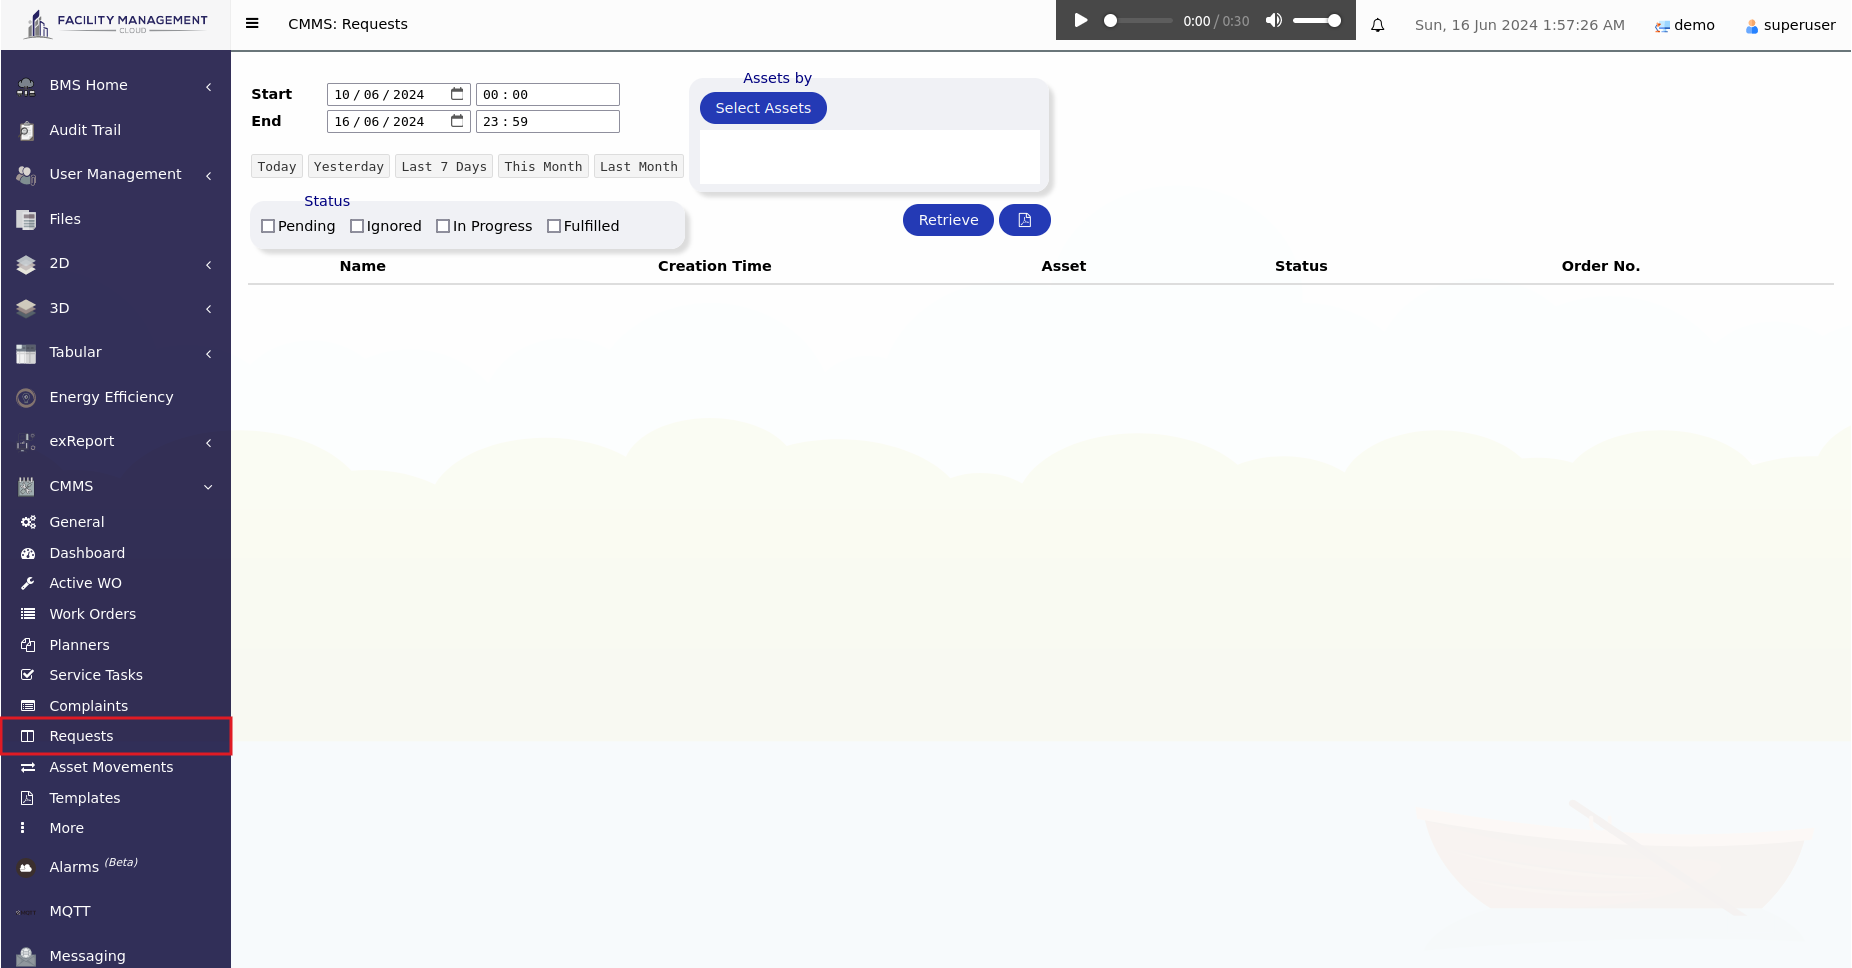
Pending - The corresponded work order of the request is in DRAFT status.
In Progress - The corresponded work order of the request is in OPEN status.
Fulfilled - The corresponded work order of the request is in CLOSED status.
Click  , you will see the detail about the request, for example:
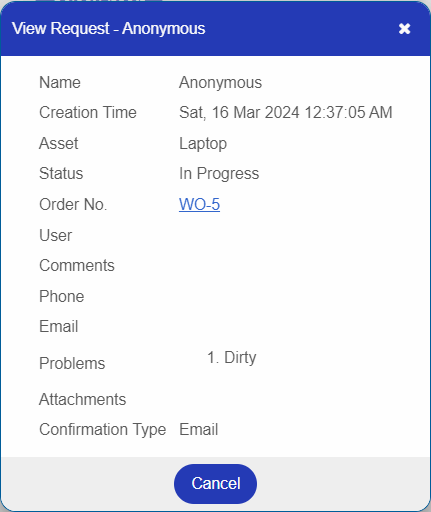
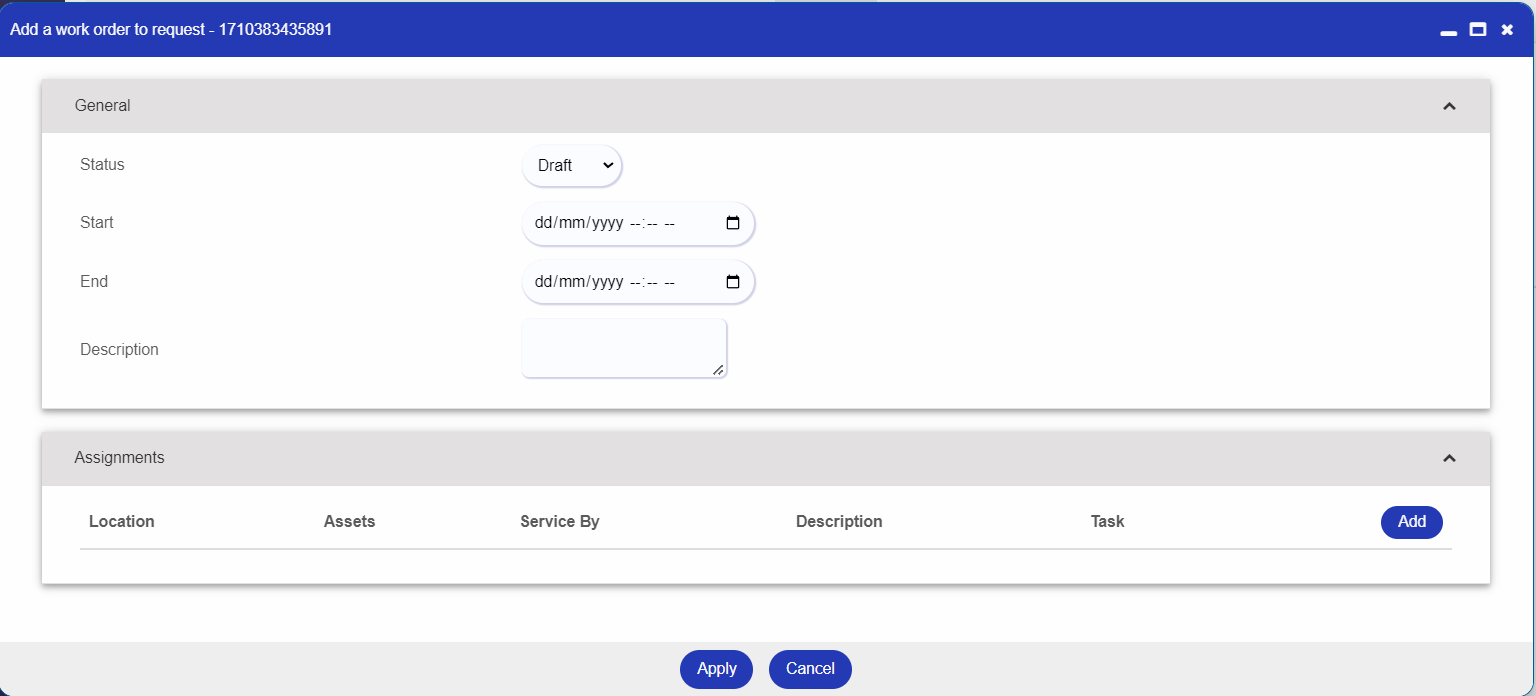
When an asset is not associated with any default planner, you are able to assign tasks for the request by creating Work Order.
After you click  , a window will pop out:
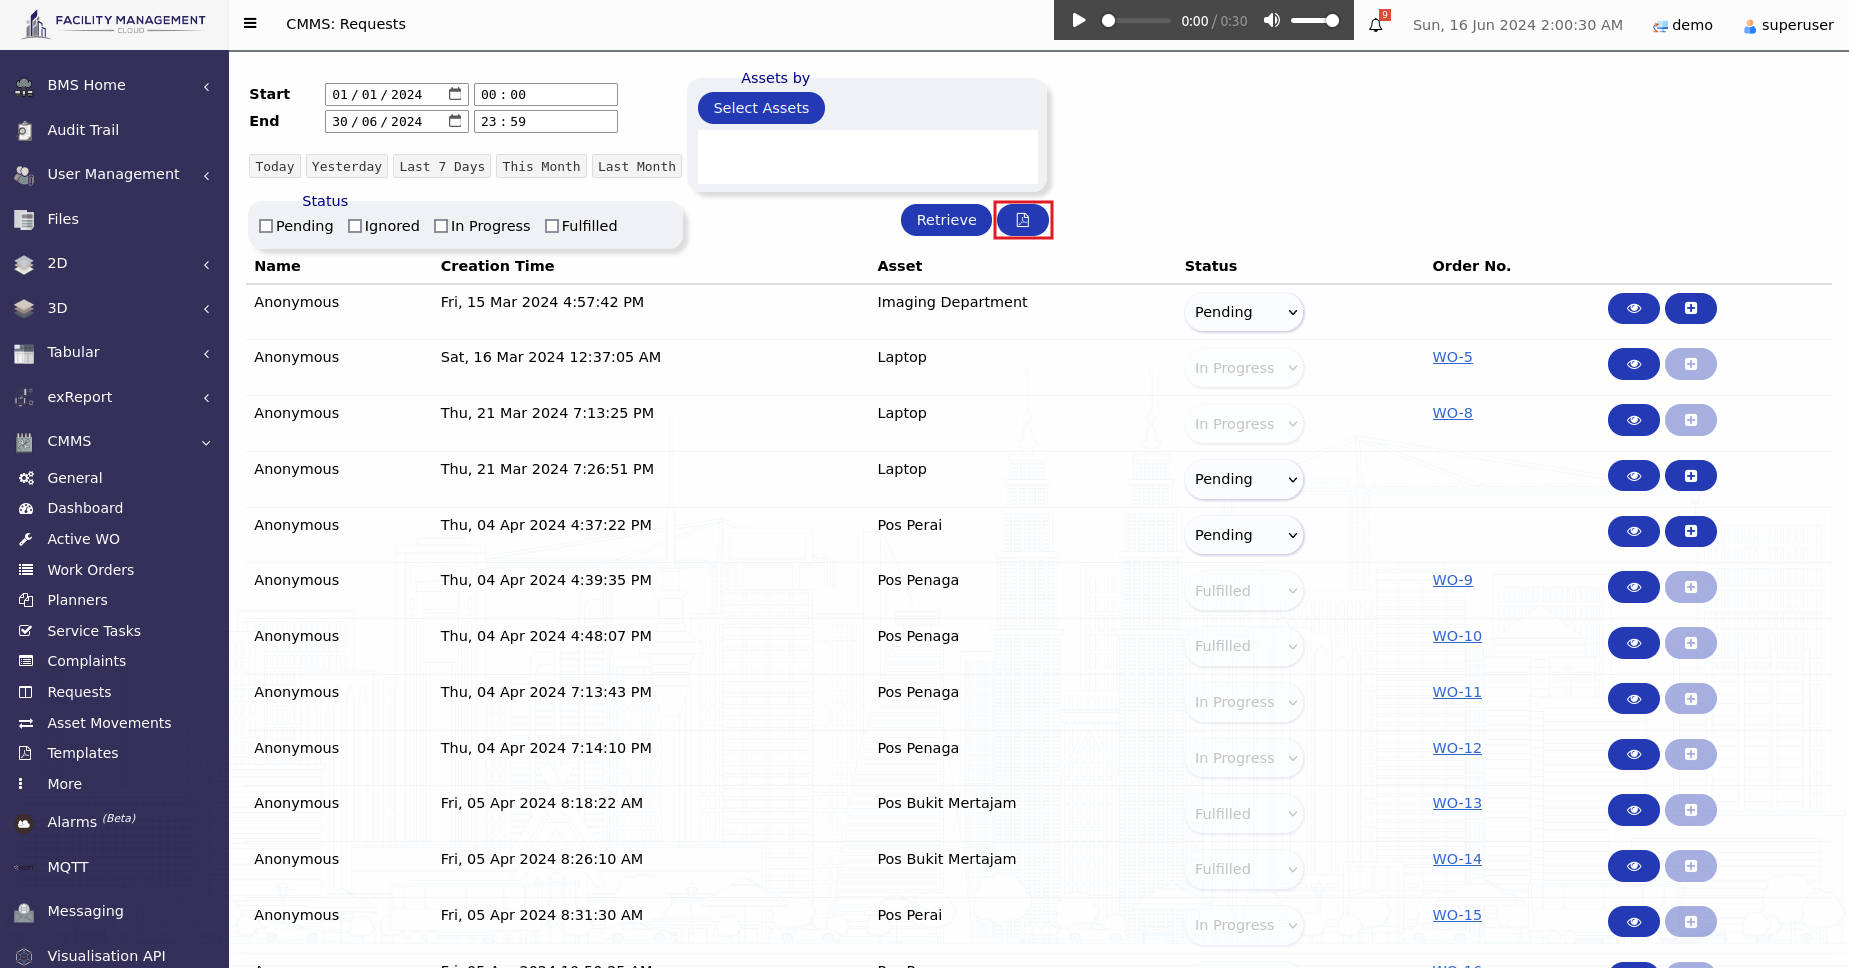
Click  to generate a report of requests in pdf format:
Asset Movement is a system feature that enables users to document the transfer of assets between various locations. This functionality allows for precise tracking of asset locations, thereby mitigating the risk of loss and eliminating uncertainties regarding their current whereabouts. By utilising asset movement tracking, organizations can ensure better inventory management, enhance accountability, and maintain accurate records of asset allocation and usage.
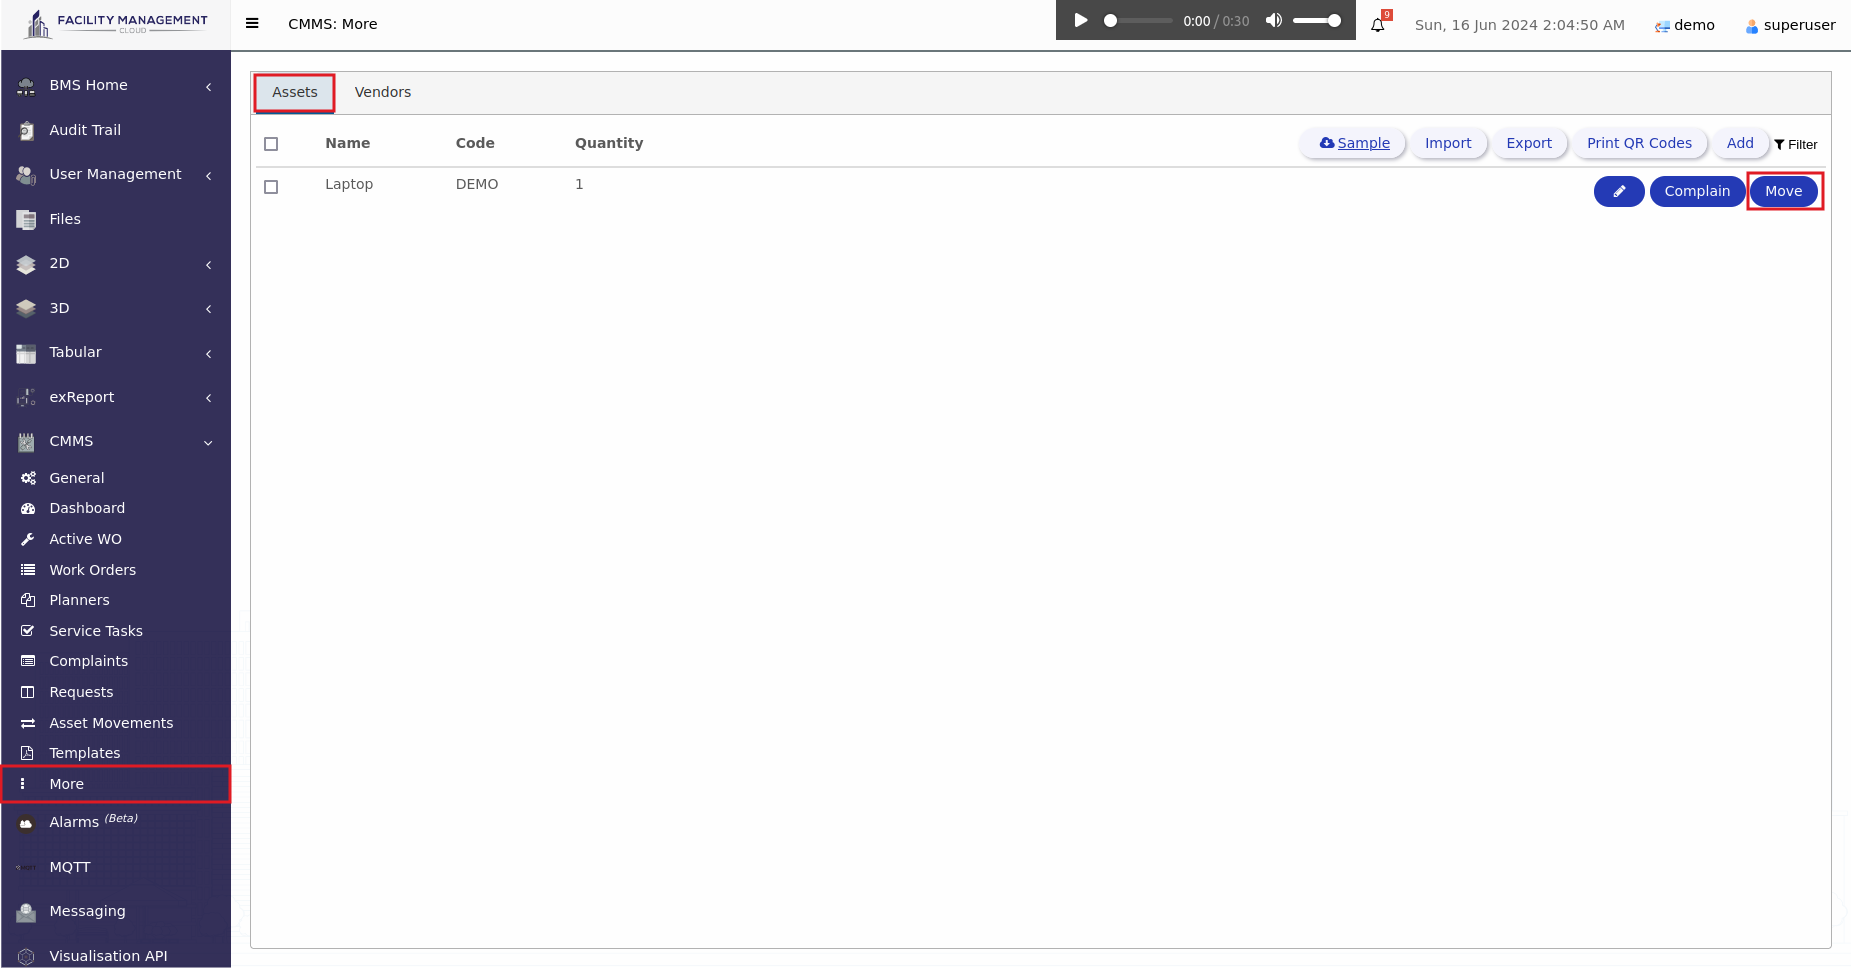
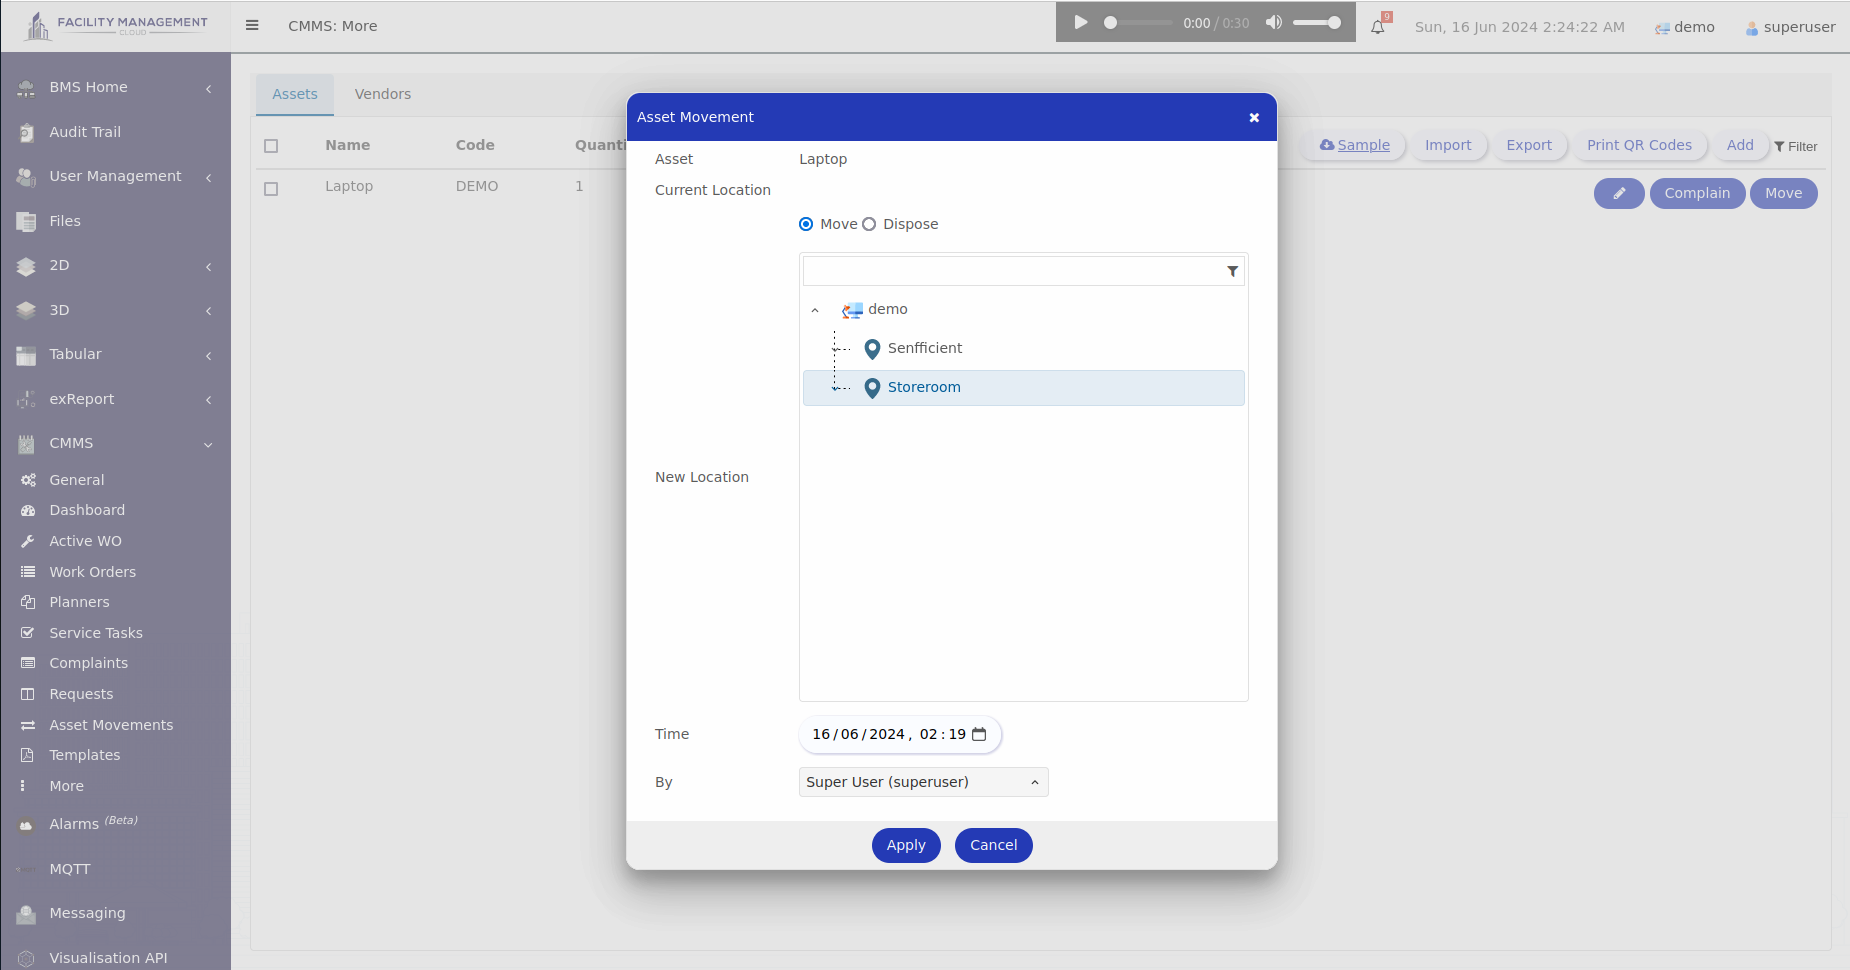 Tips: By default, the moving time will be set based on the current time, users can reset the asset moving time by clicking on the time.
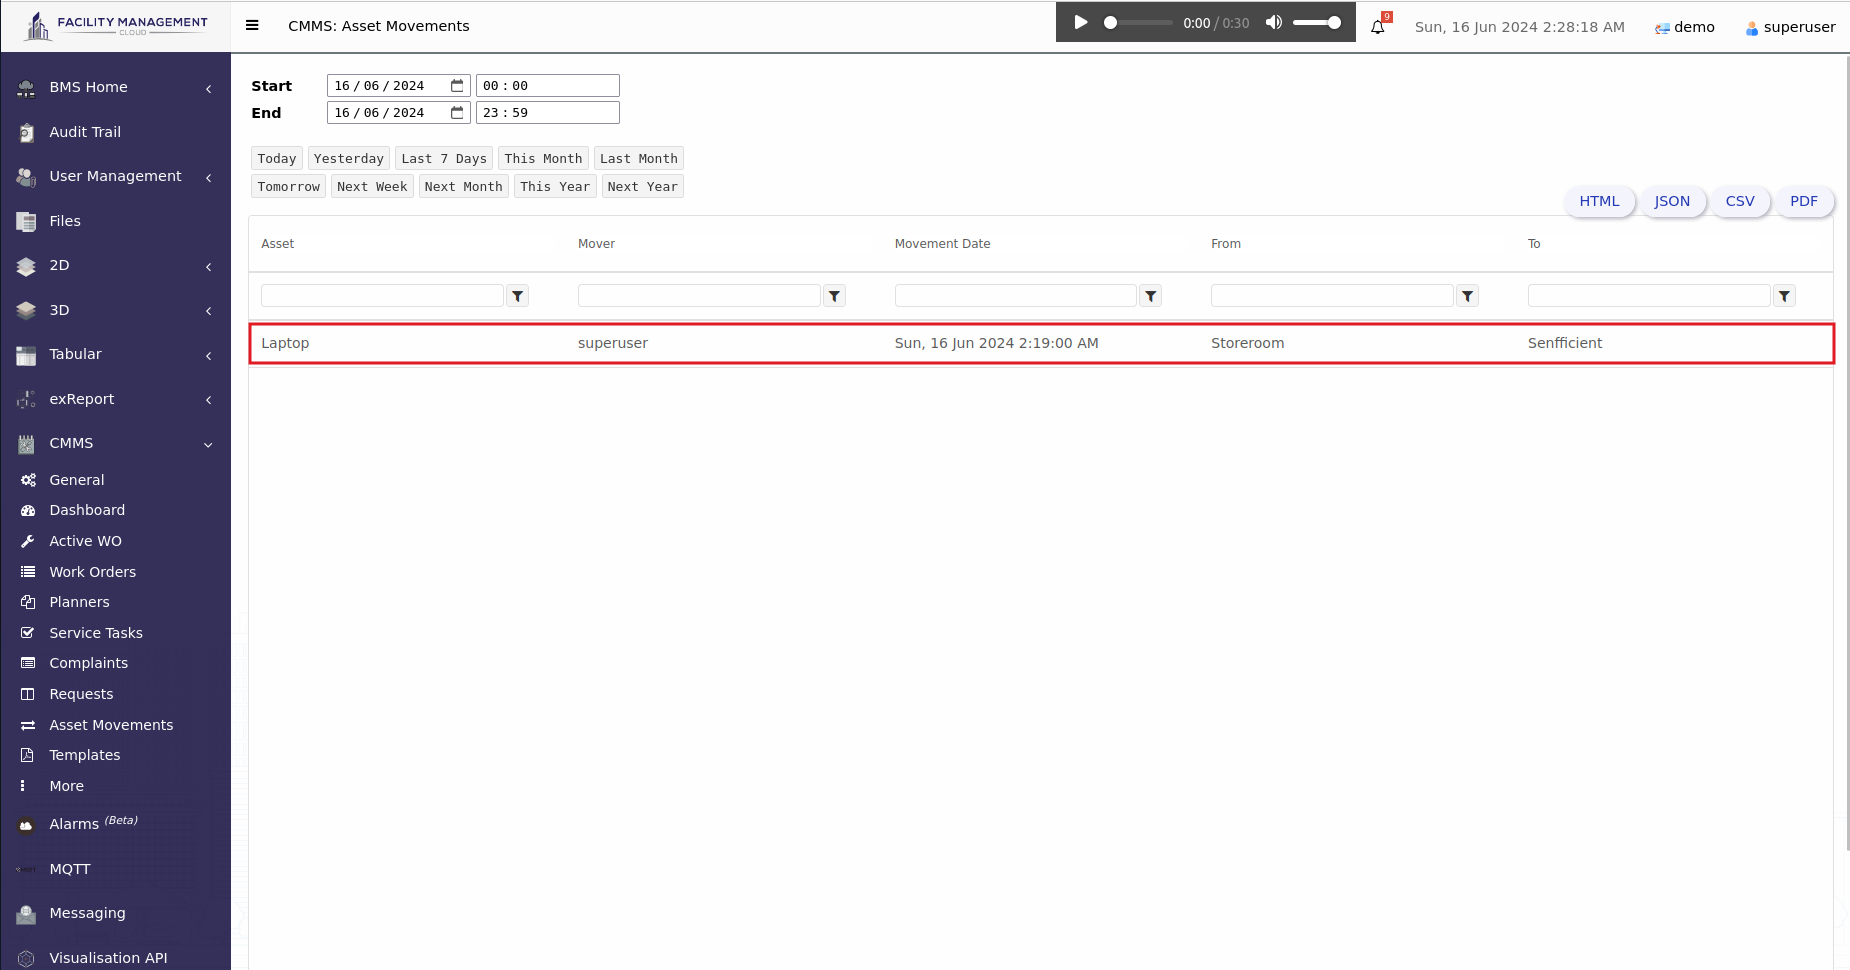
The History visual is a timeline that shows the values for a selected attribute in chronological order. Select your Starting Time and Ending Time. The table below will show out the assets that have been moved within your set time.
In addition, you can export the table into HTML, JSON, CSV and PDF type files by clicking it to their corresponding button at the top right of the table.
A schedule is a feature that automate your device action based on time, it automate device behavior by setting specific value on state (ON/OFF) at scheduled time. Key benifits of using schedules are:
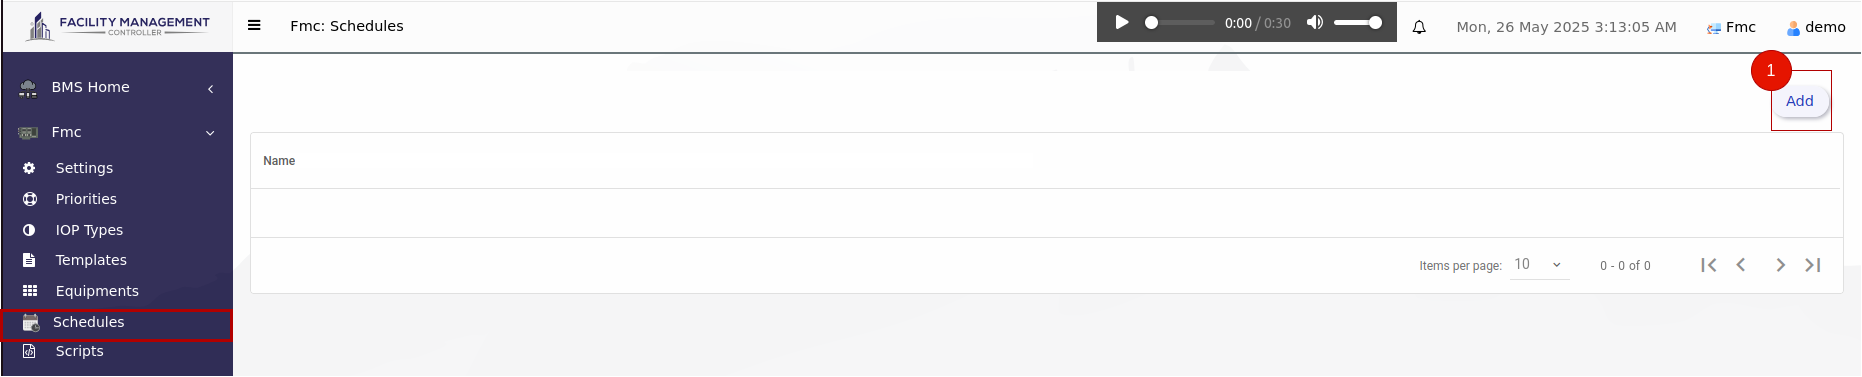
To automate your device behavior, you will start by creating a schedules. There have some special values to be scheduled:
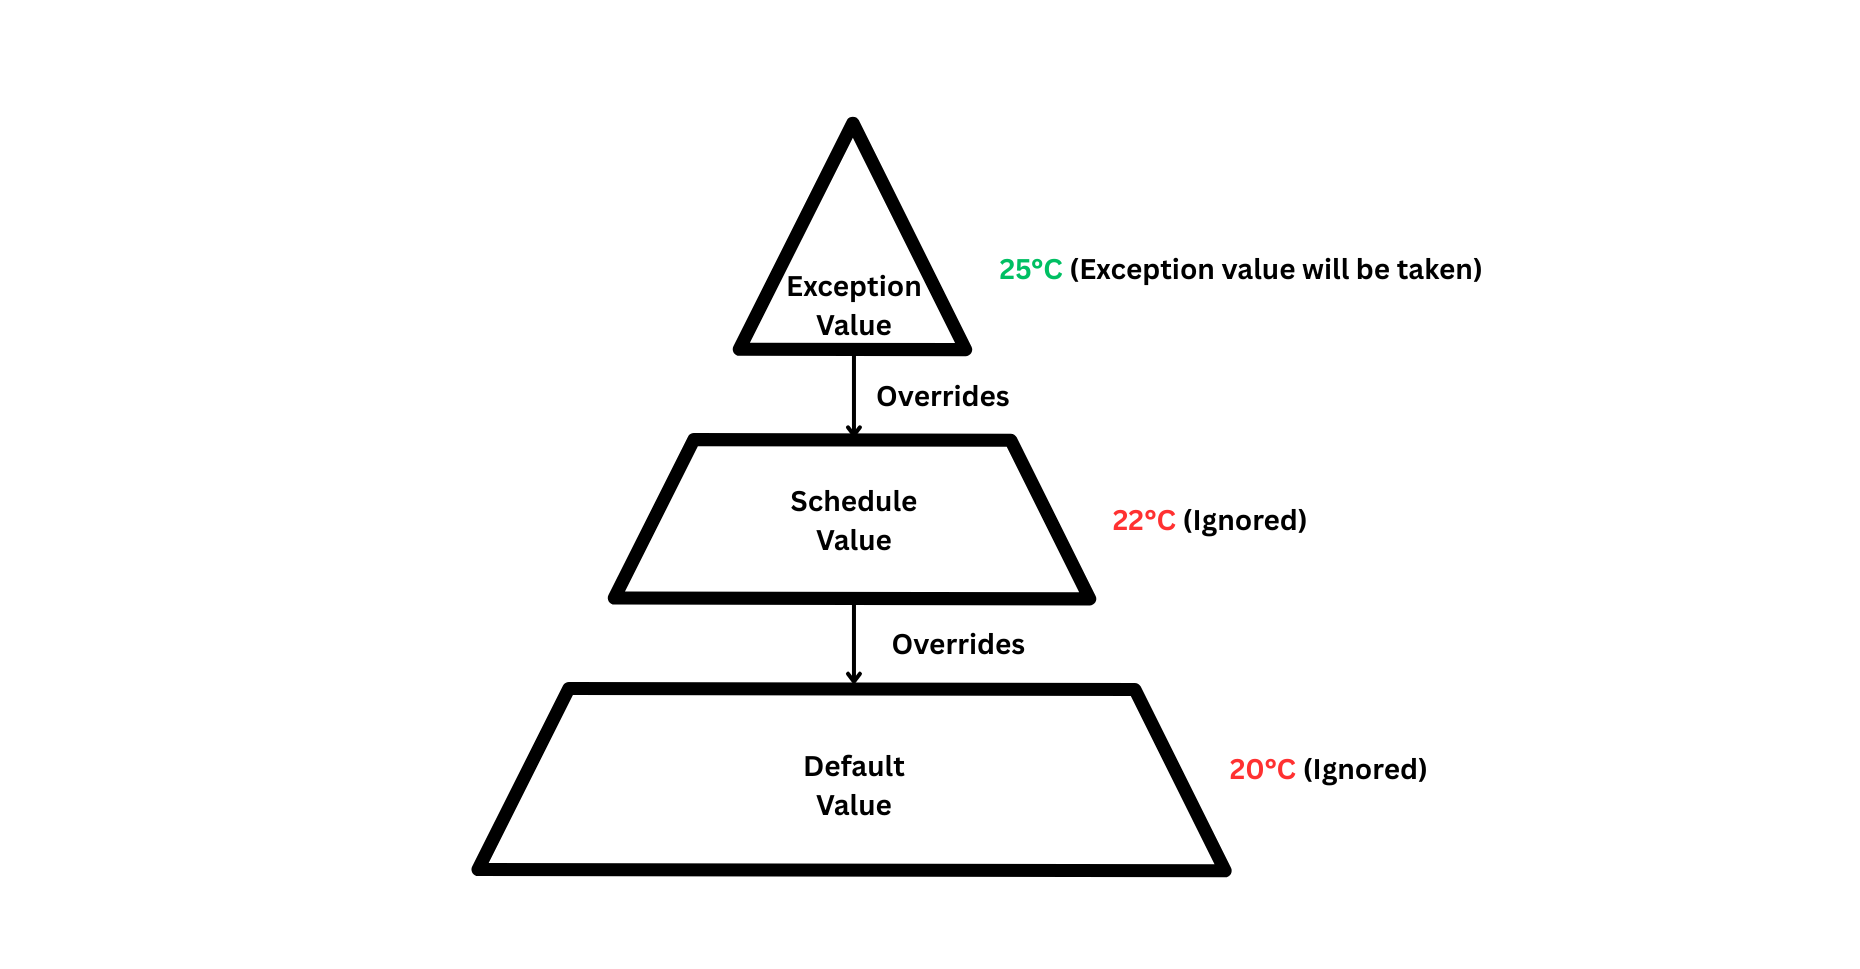
When schedules overlap, the device applies values based on the following priority: exception overrides schedule, which overrides the default value.
You can drag on the timetable to add your weekly schedule. For example, you can create a schedule for lights during operational hours, default value set to 0 (Off) and the scheduled value was set as 1 (On) at every working daytime hours.
Otherwise, you also can add your schedule by clicking right click to add events.
Exception is a special rule that overrides the normal schedule temporarily — often used for holidays, maintenance, or special events.
If multiple schedules overlap, the schedule with the lowest priority value (e.g., 1 is higher priority than 5) will take precedence.
This allows important overrides, such as holidays or emergency rules, to take effect over normal routines.
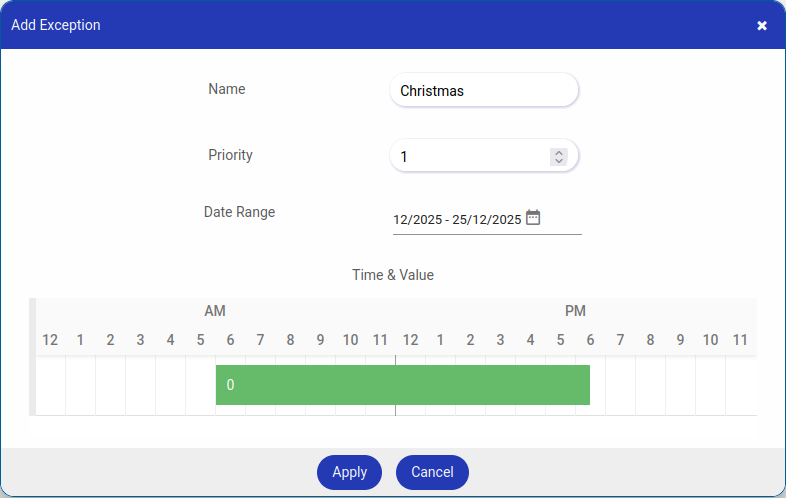
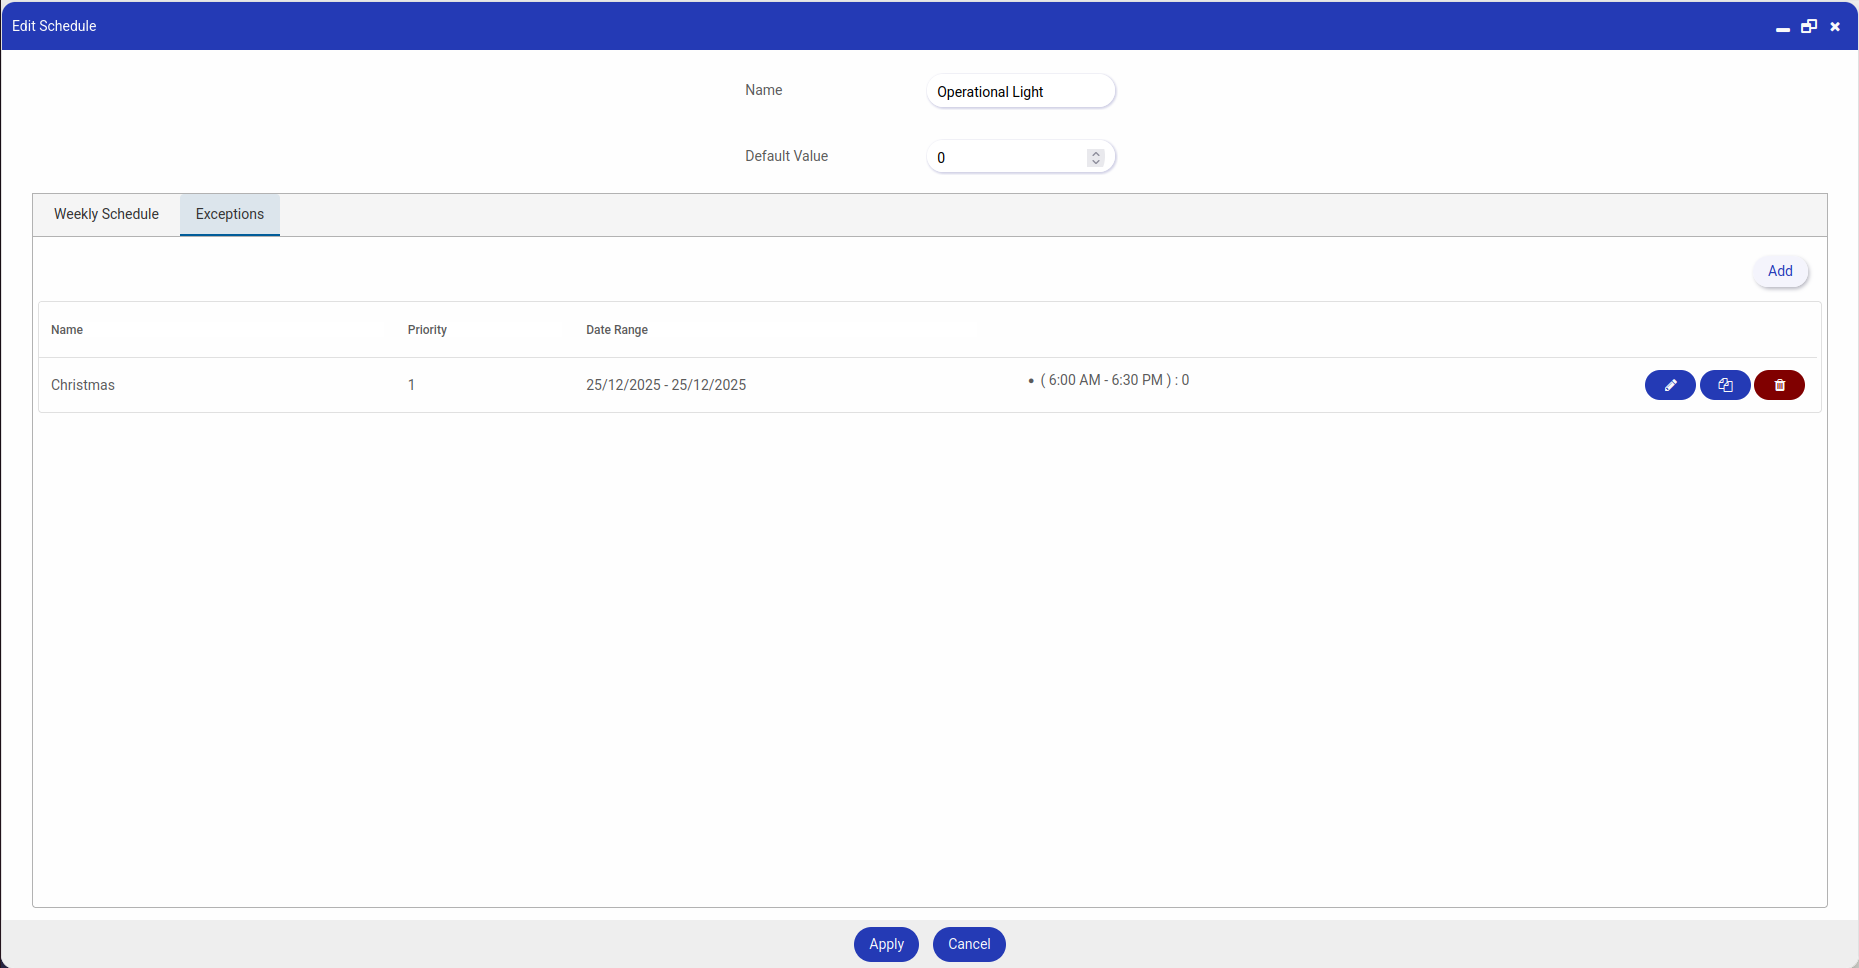
The screenshot above shows a Christmas exception schedule configured to turn off the lights during the holiday.
This exception is set with a priority value of 1, which gives it the highest precedence in the scheduler system. It overrides both the regular schedule and the default state.
The active time range is from 6:00 AM to 6:30 PM, ensuring that the lights remain off throughout the day, regardless of any overlapping schedules.
Other than that, if there are multiple exceptions within a time range, the system will use the exception value with the highest priority (i.e., the lowest priority number).
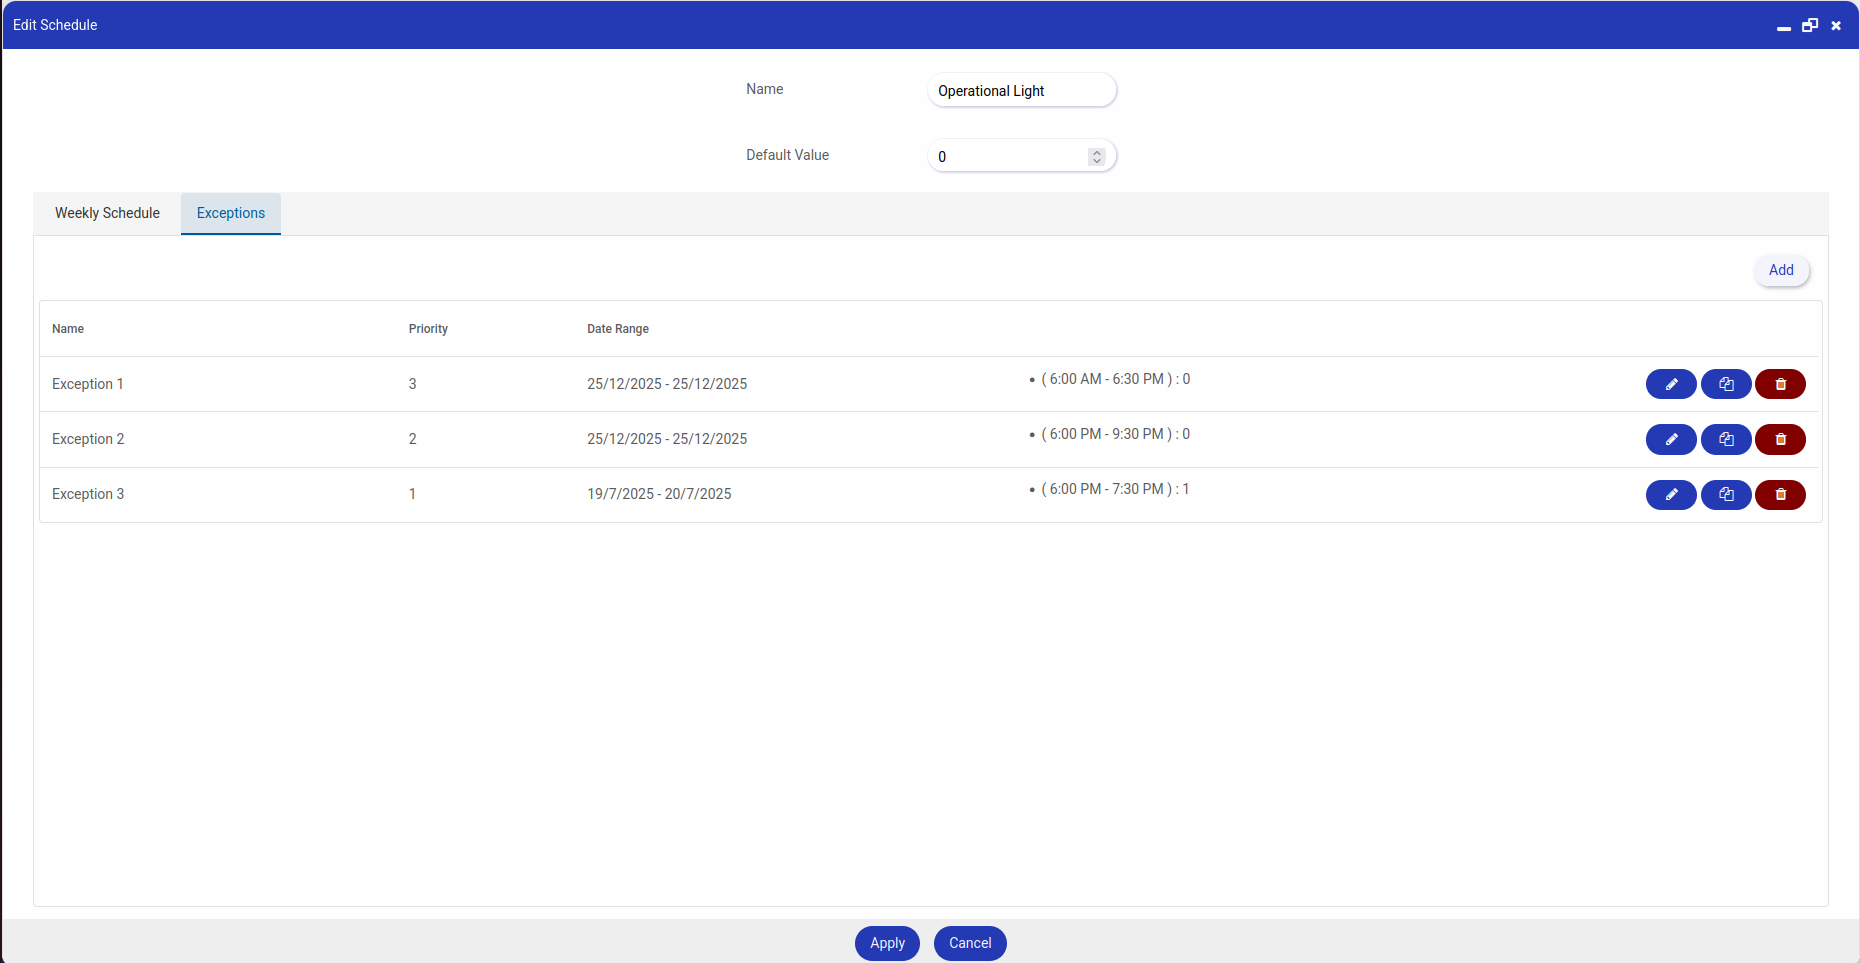
For example, the image above shows 3 different exceptions with different priorities. There is an overlapping of the exception schedules. The resulting output will be:
6:00am - 6:00pm: 0 (Exception 1, priority 3), light will turn off
6:00pm - 7:30pm: 1 (Exception 3, priority 1), light will turn on
7:30pm - 9:30pm: 0 (Exception 2, priority 2), light will turn off
9:30pm onward: back to the regular schedule
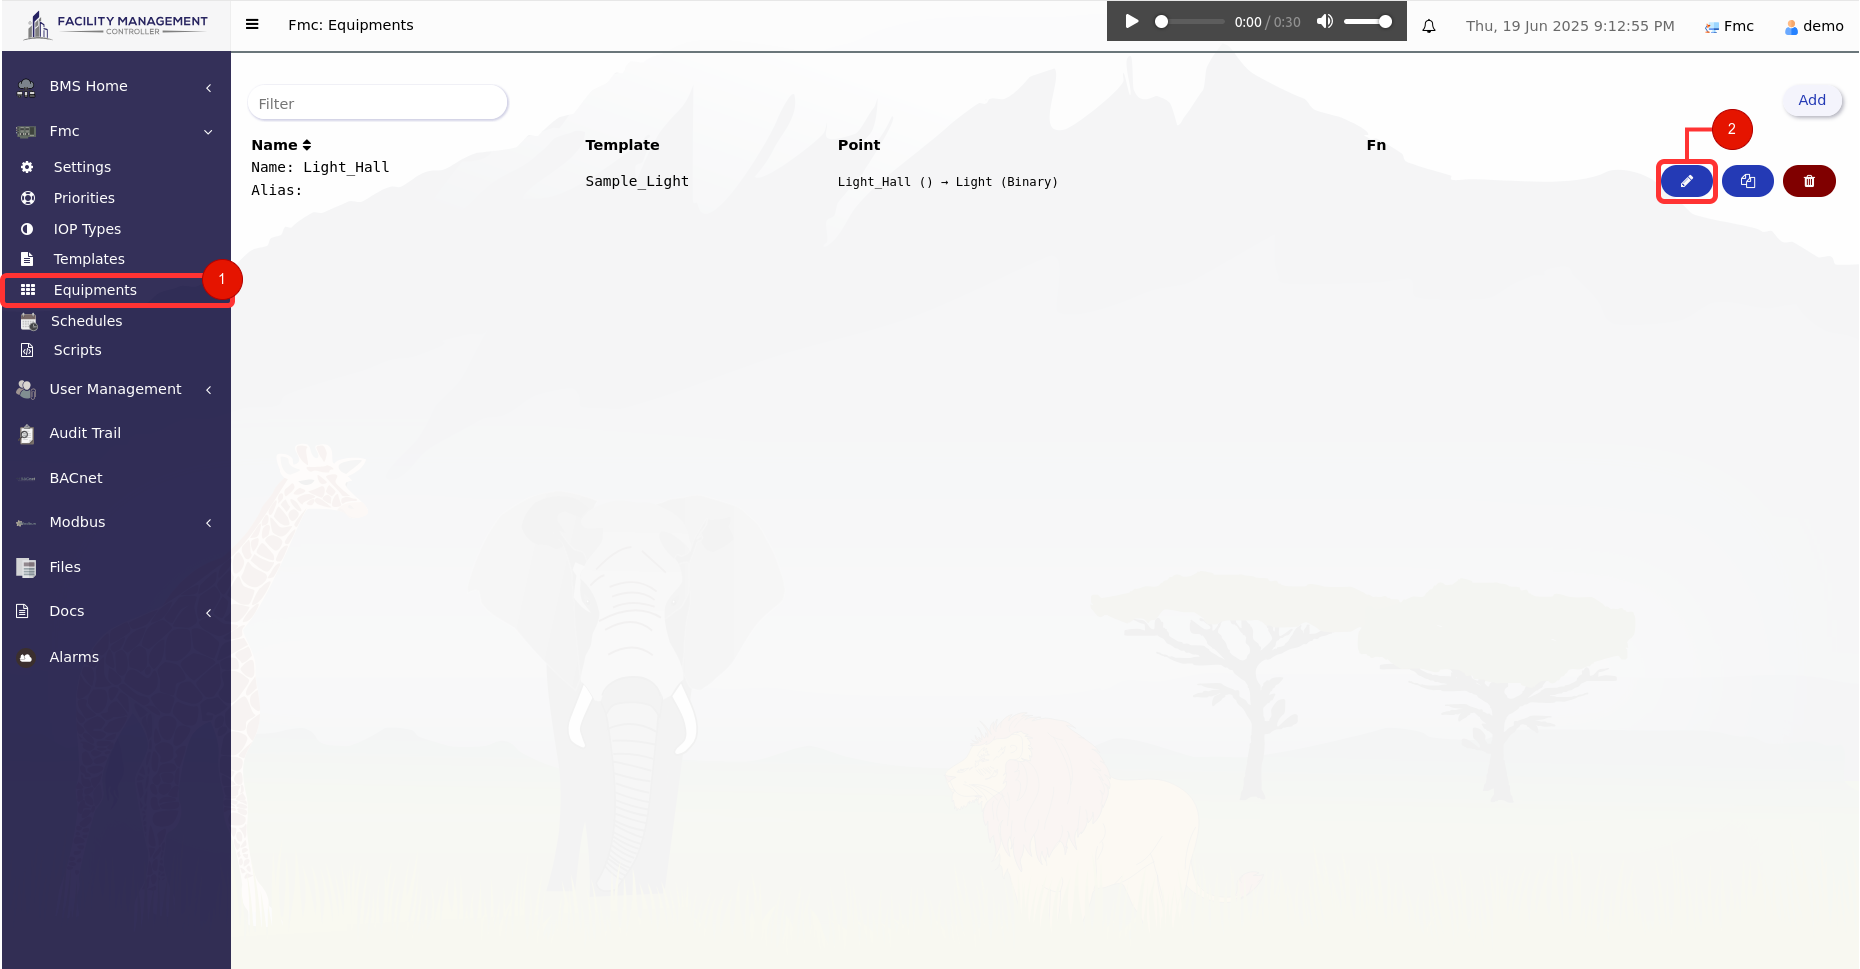
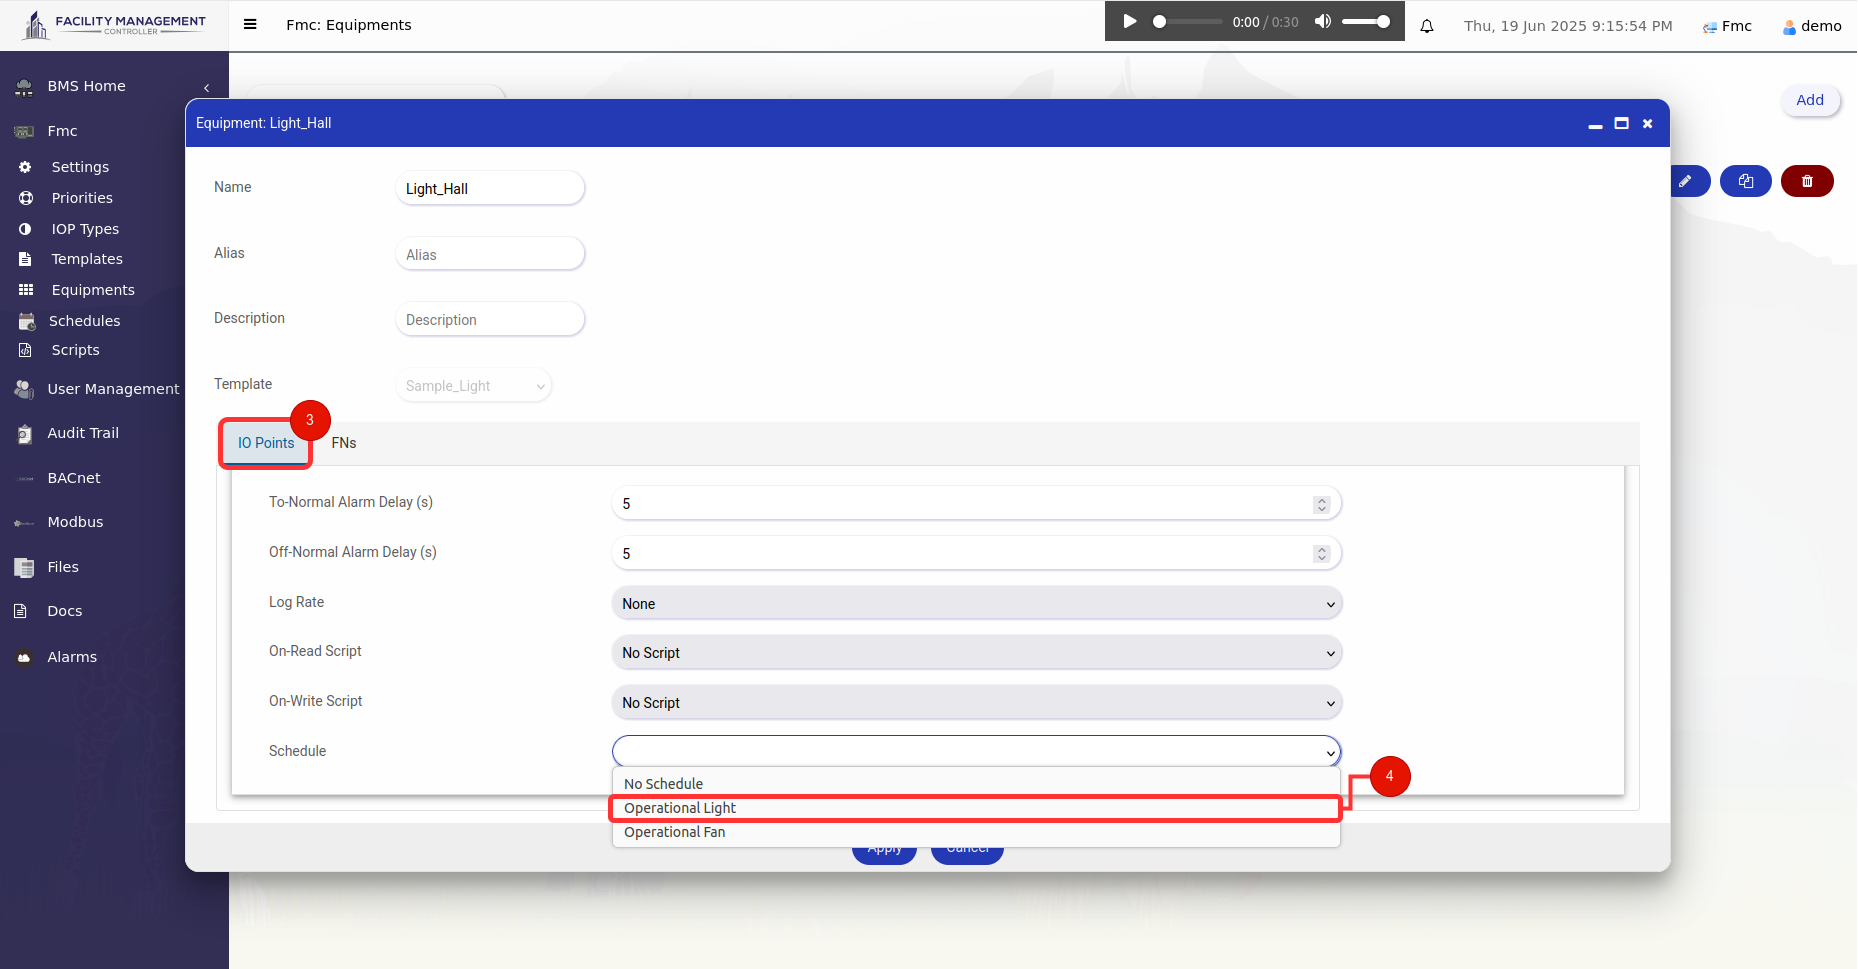
To apply a schedule to your equipment, follow the steps below.
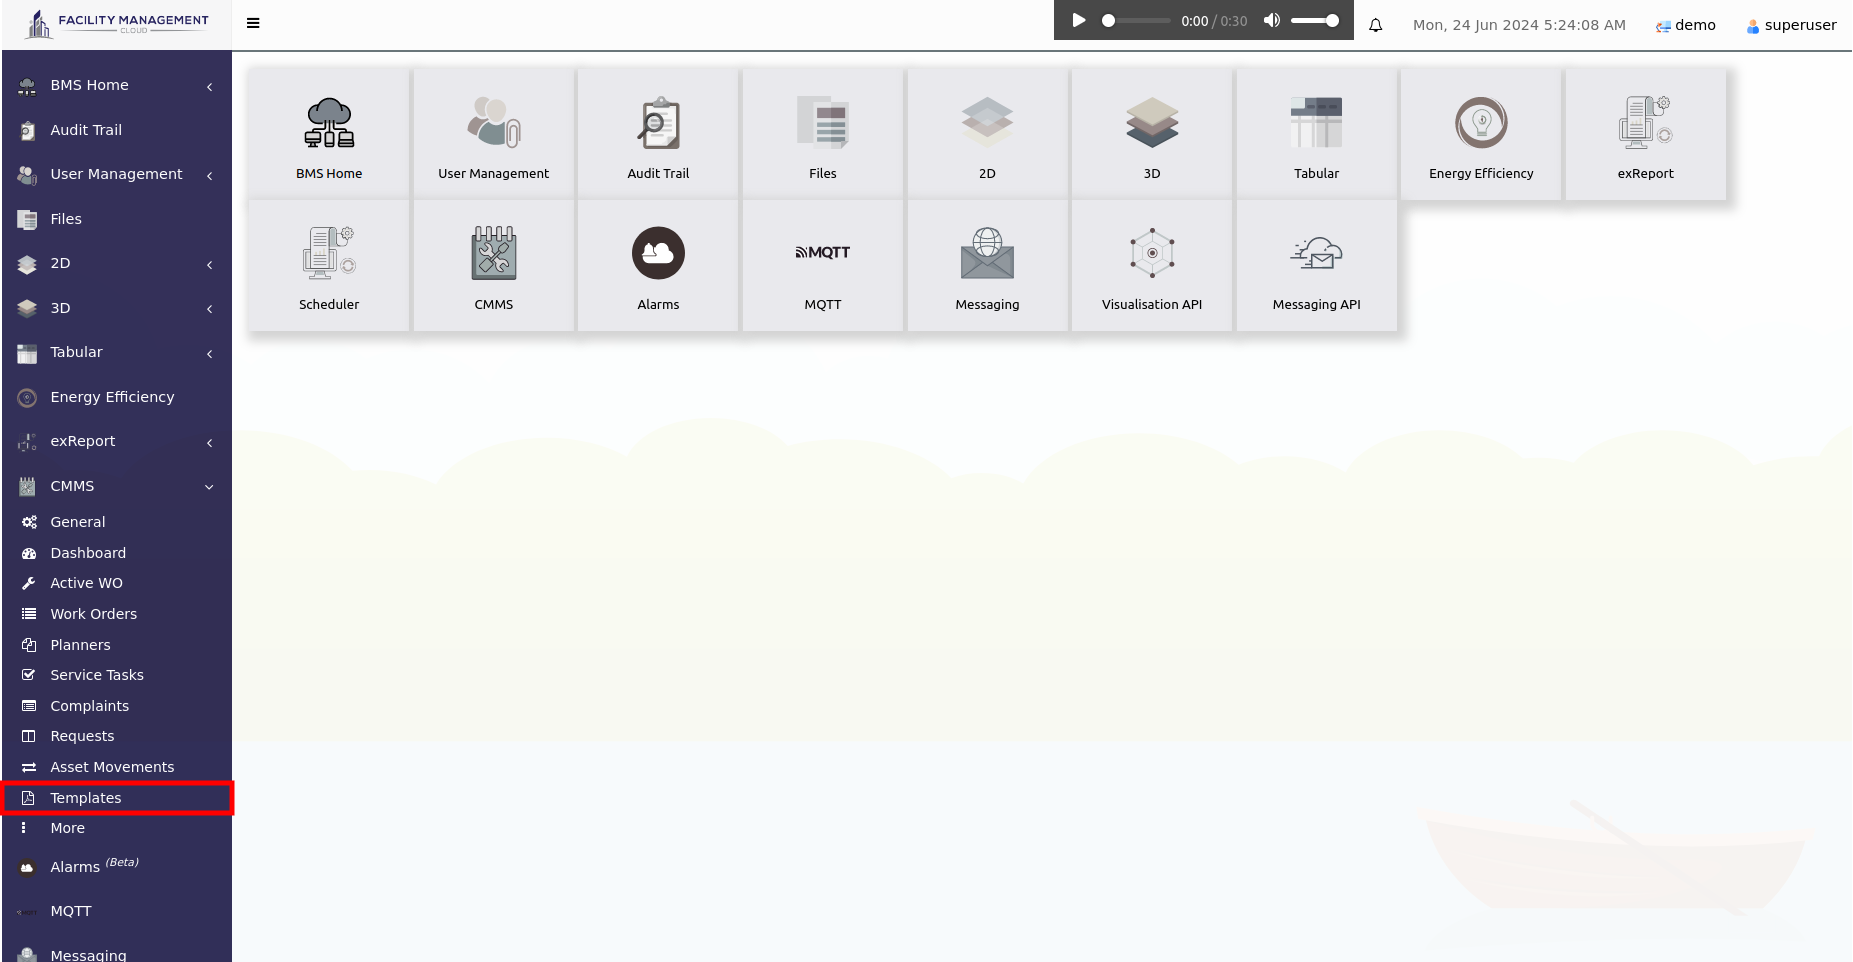
The 'Templates' feature in CMMS enables users to create and customise templates for reports, including work order reports, asset movement reports, and request reports. By applying these templates to your workspace, you can generate detailed and tailored reports that suit your specific organisational needs and standards.
After you apply this template to your workspace, it will effect to the generated reports below:
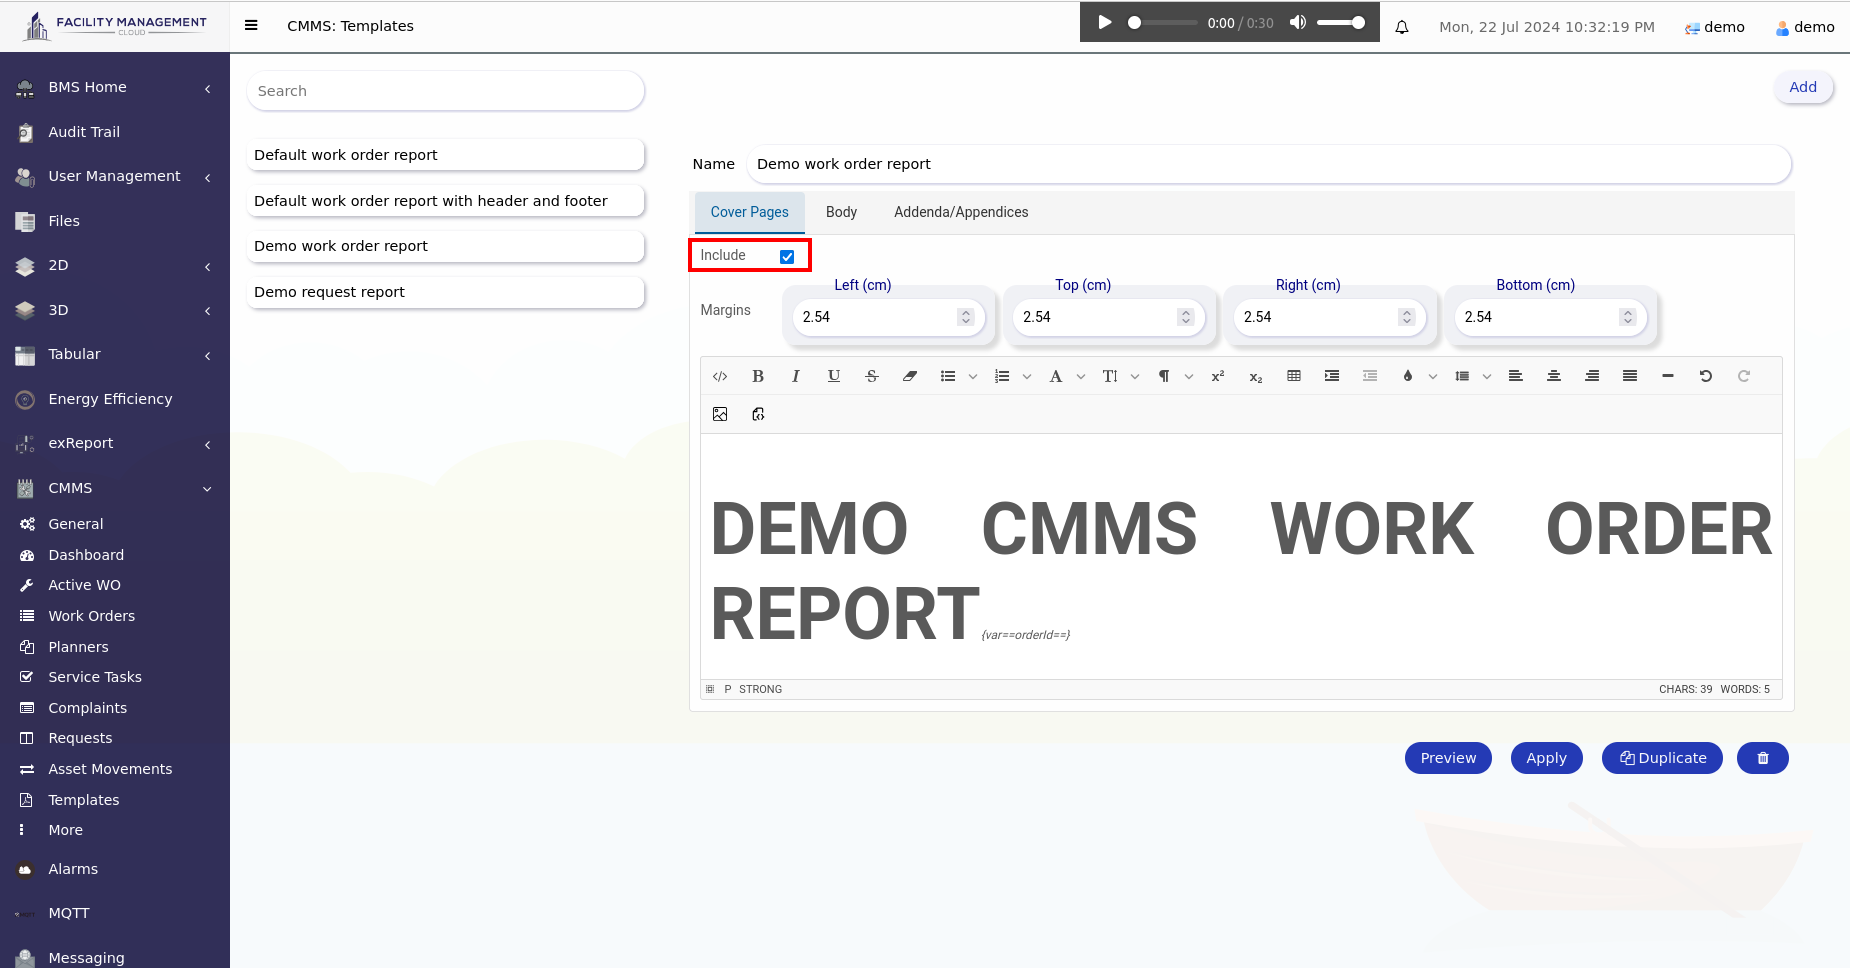
To include a cover page or addenda/appendix, it is necessary to check the "Include" checkbox.
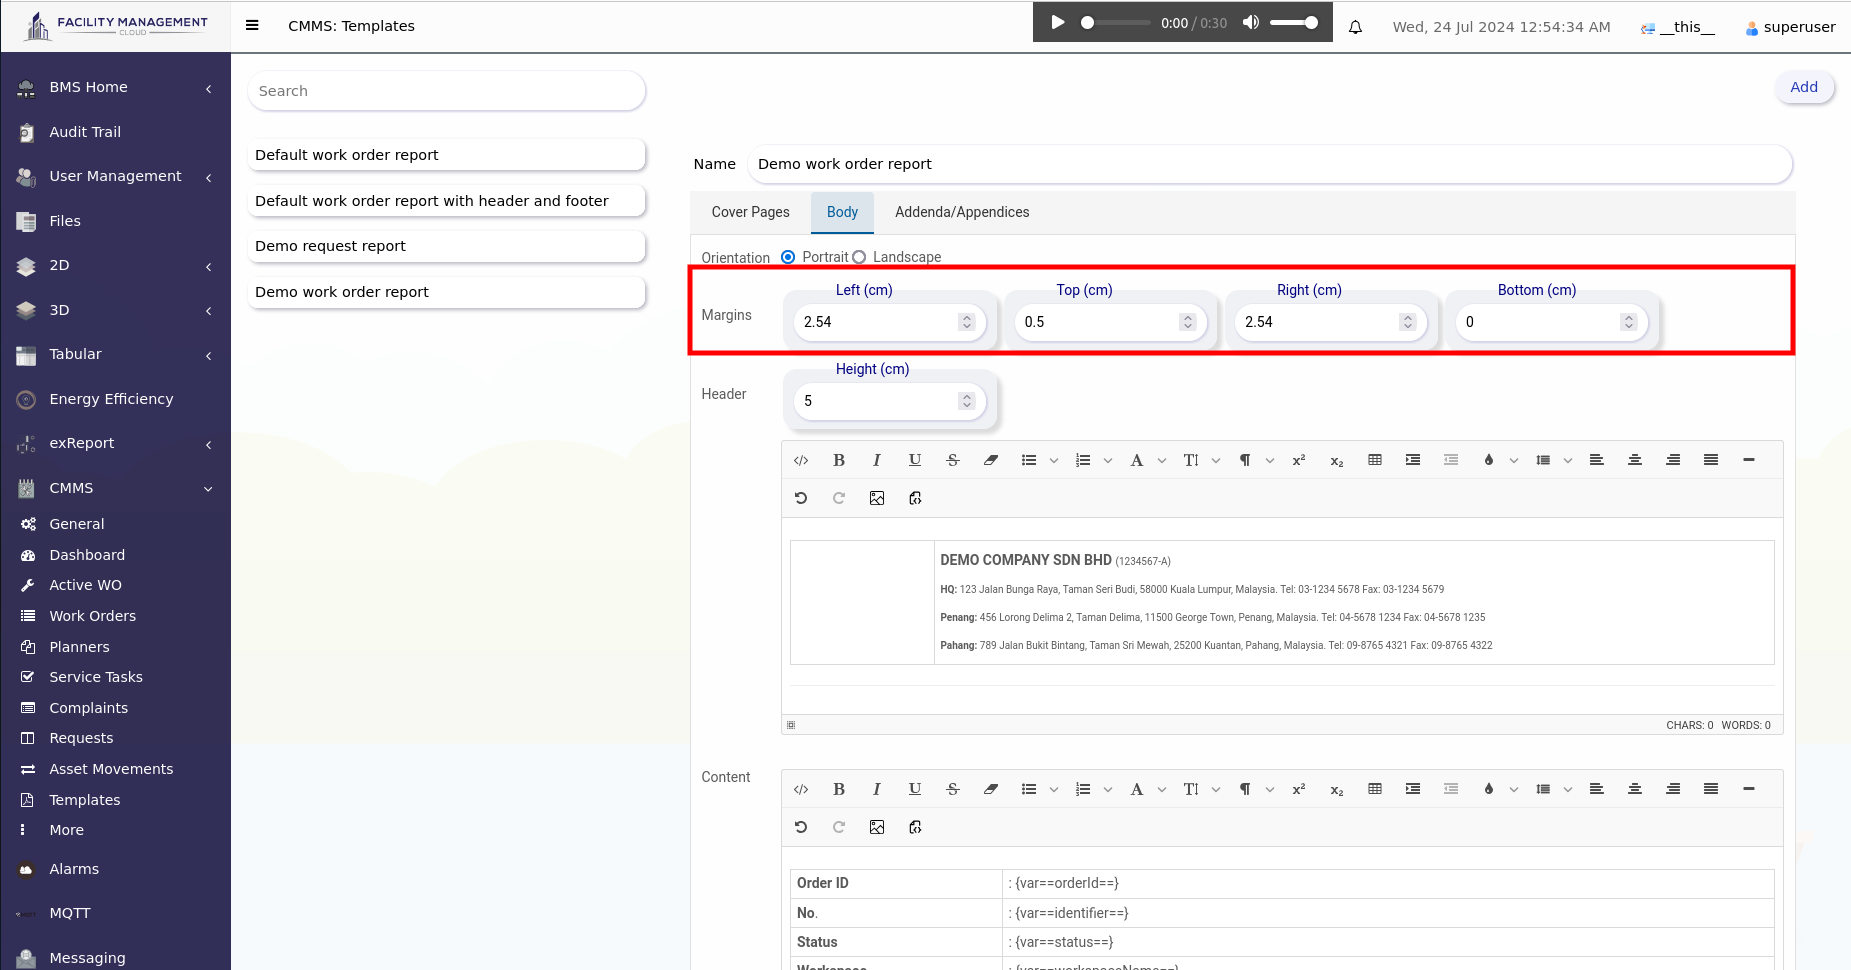
To set the margin, input the desired value in the margin settings field.
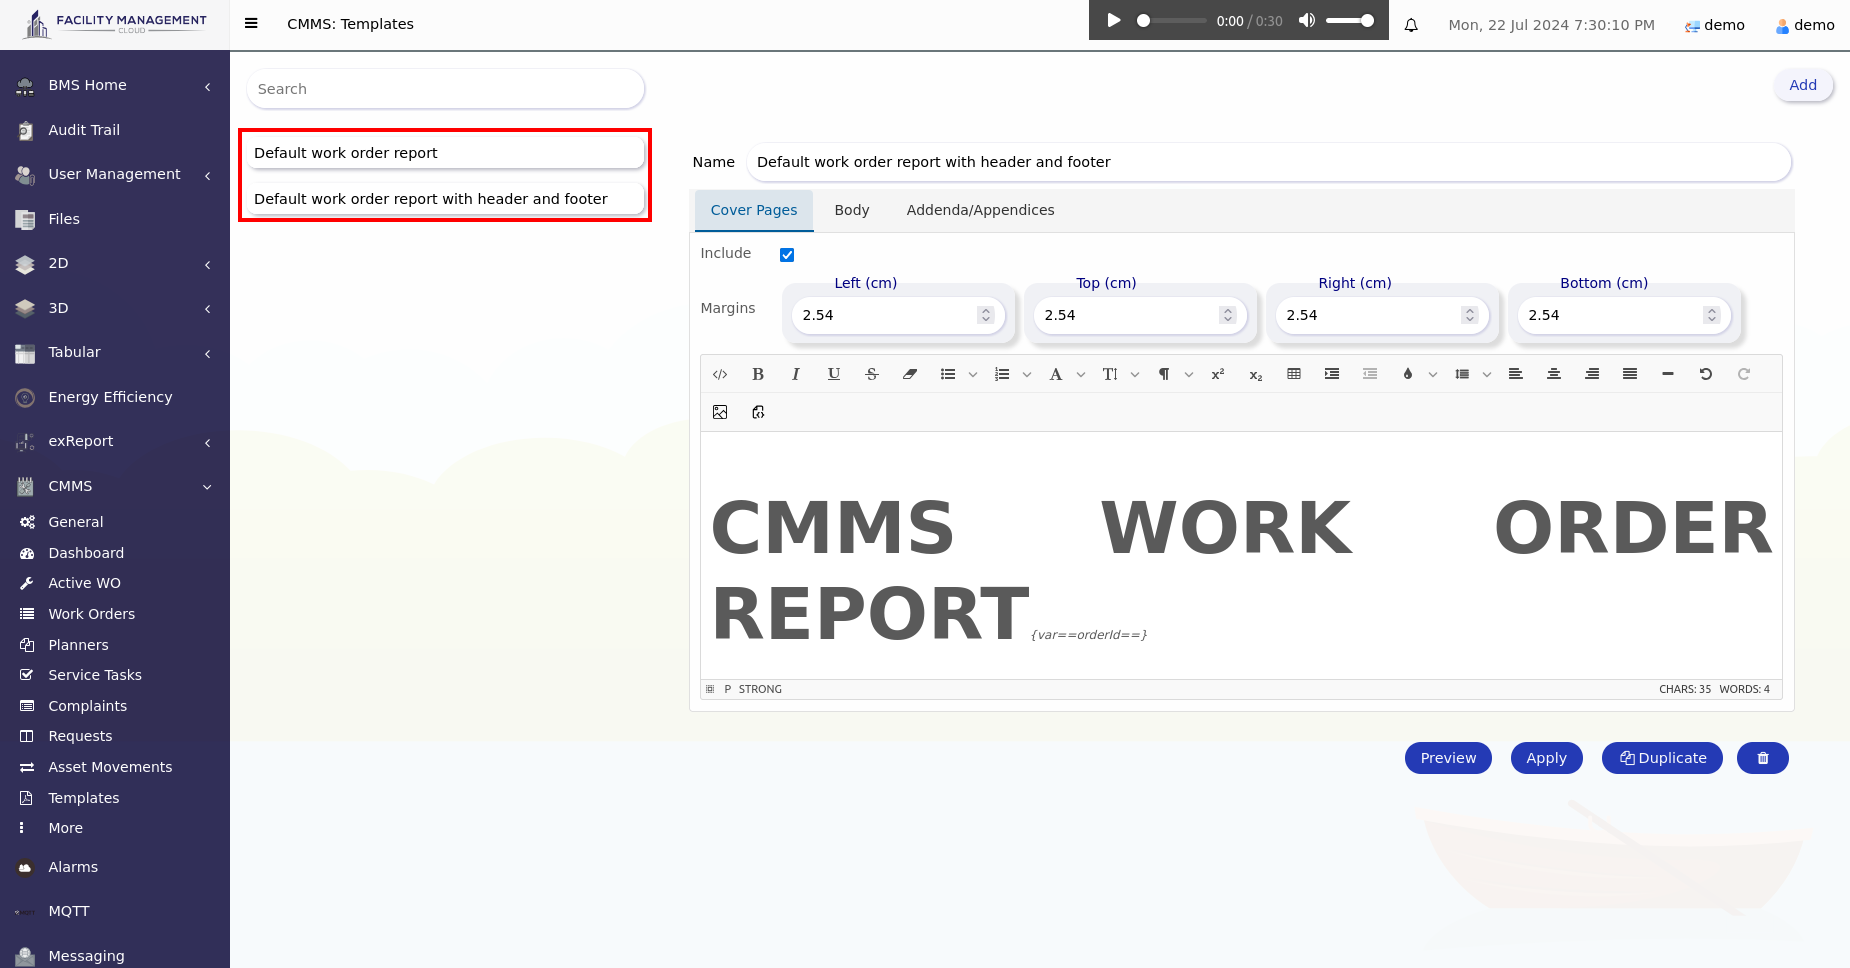
There is a convenience way to create another templates, which is duplicate our build-in templates:
1. Choose the build-in template you want to duplicate.
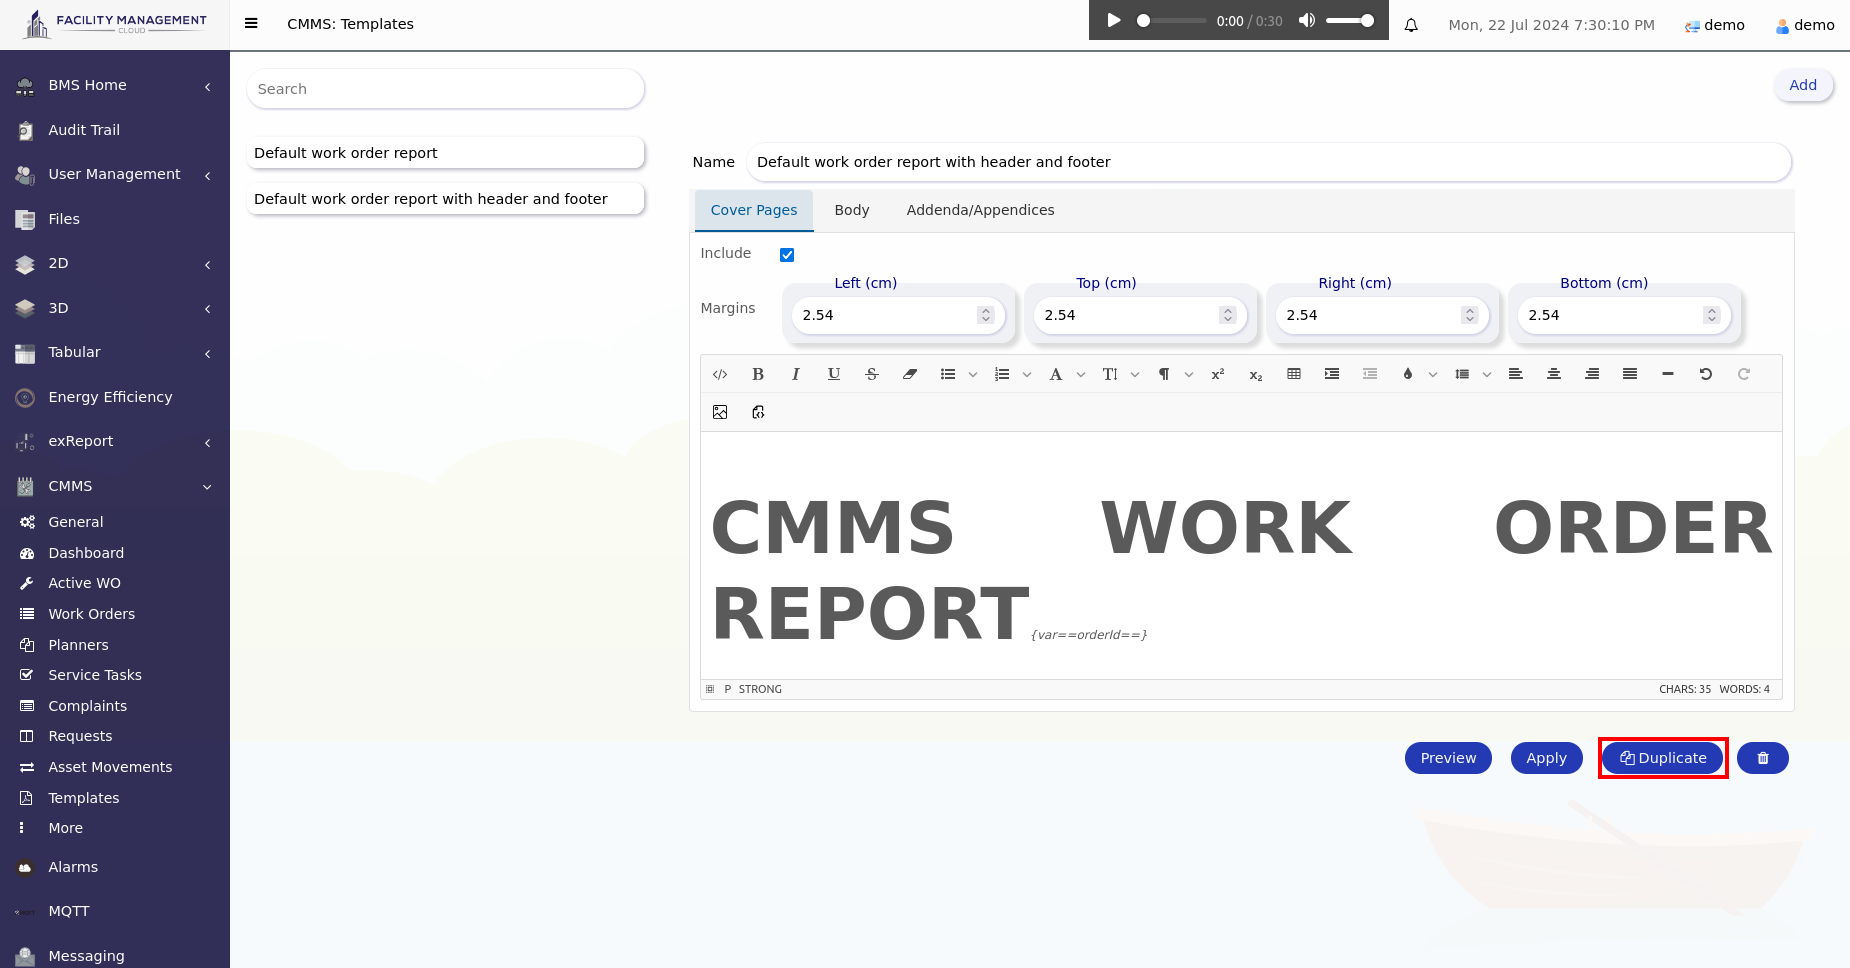
2. Click the "Duplicate" button
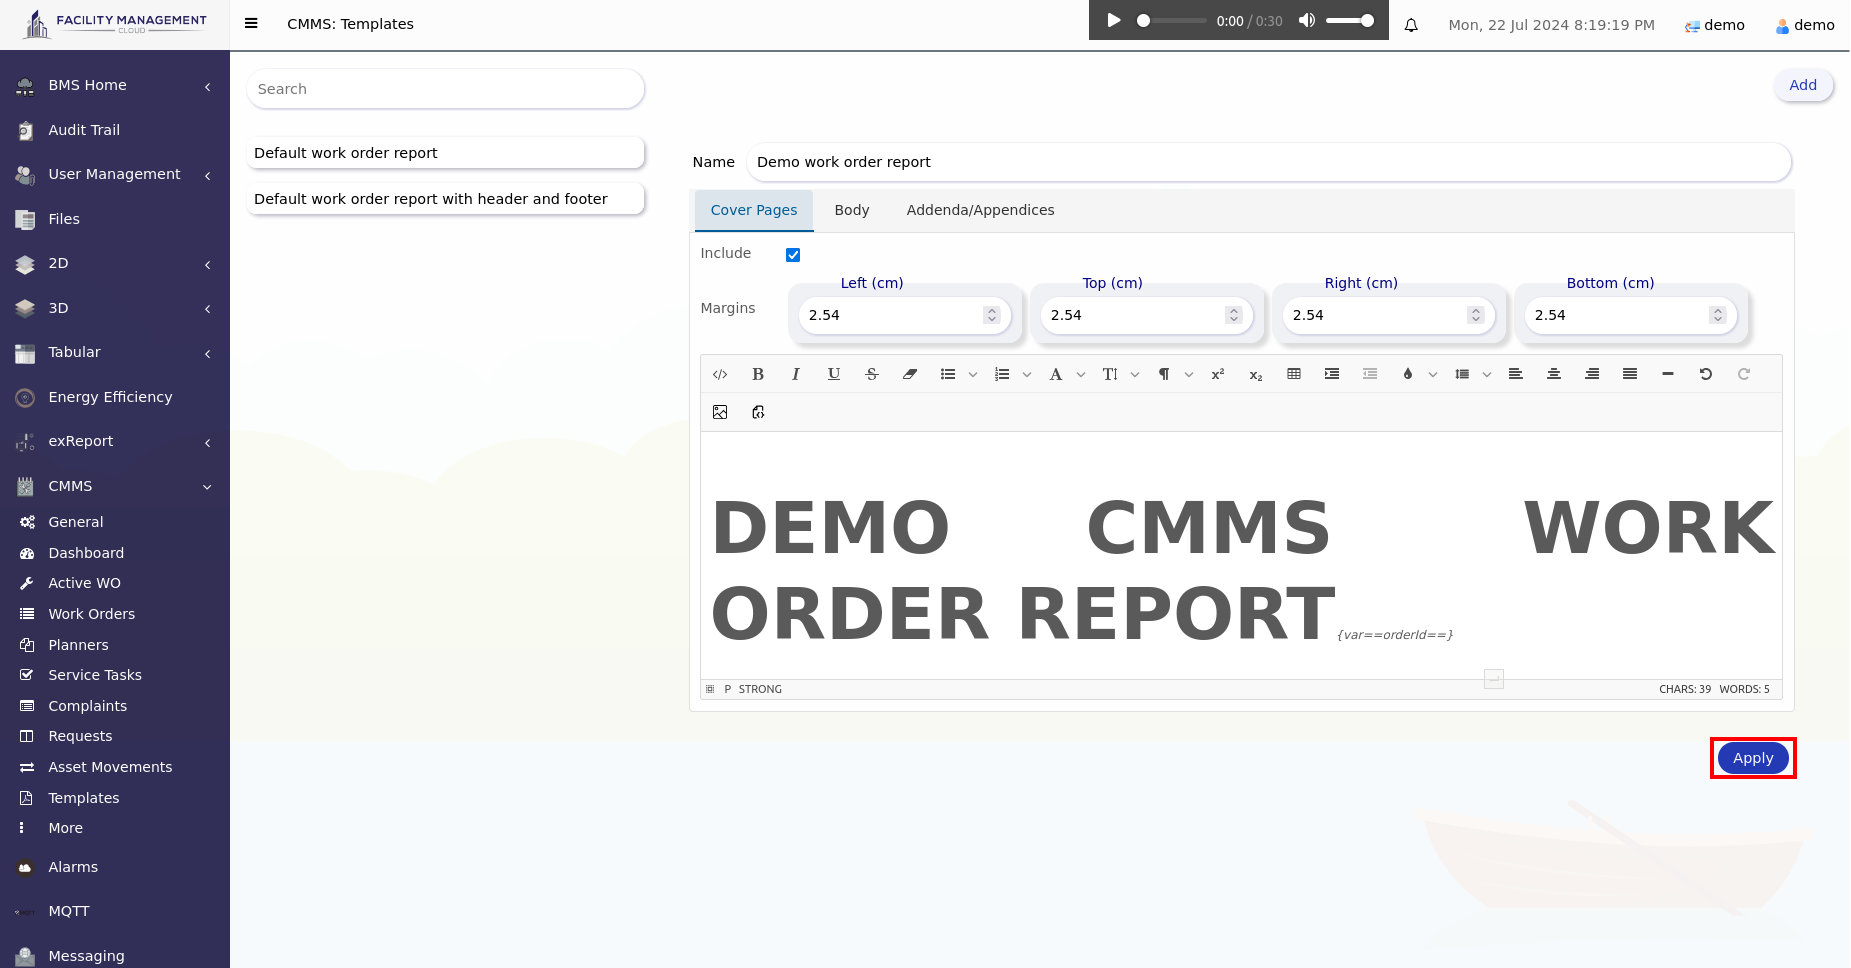
3. You can modify your template with your preferences before you apply it. After you finish your customisation, click "Apply" button.
4. The duplicated template will shown at the left side of the page.
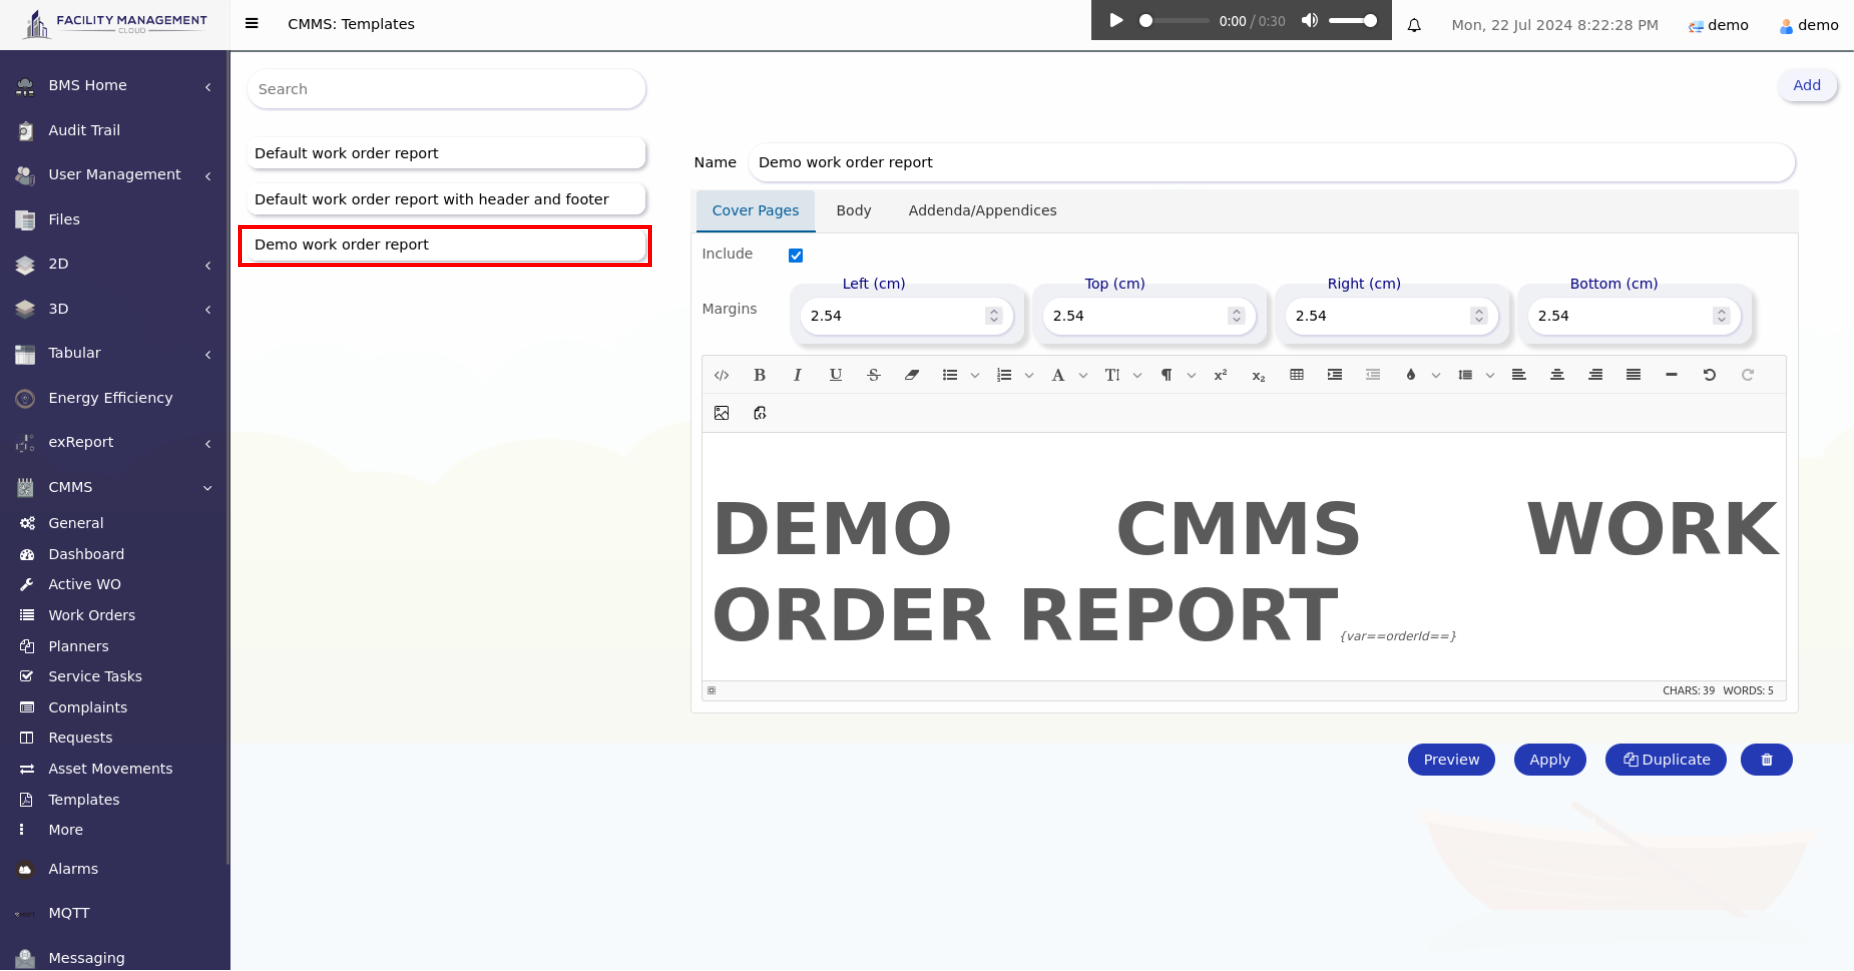
NOTE : This duplication also apply for any template.
Here is also a way to add templates with all your preferences.
1. Click "Add" button on the top-right corner.
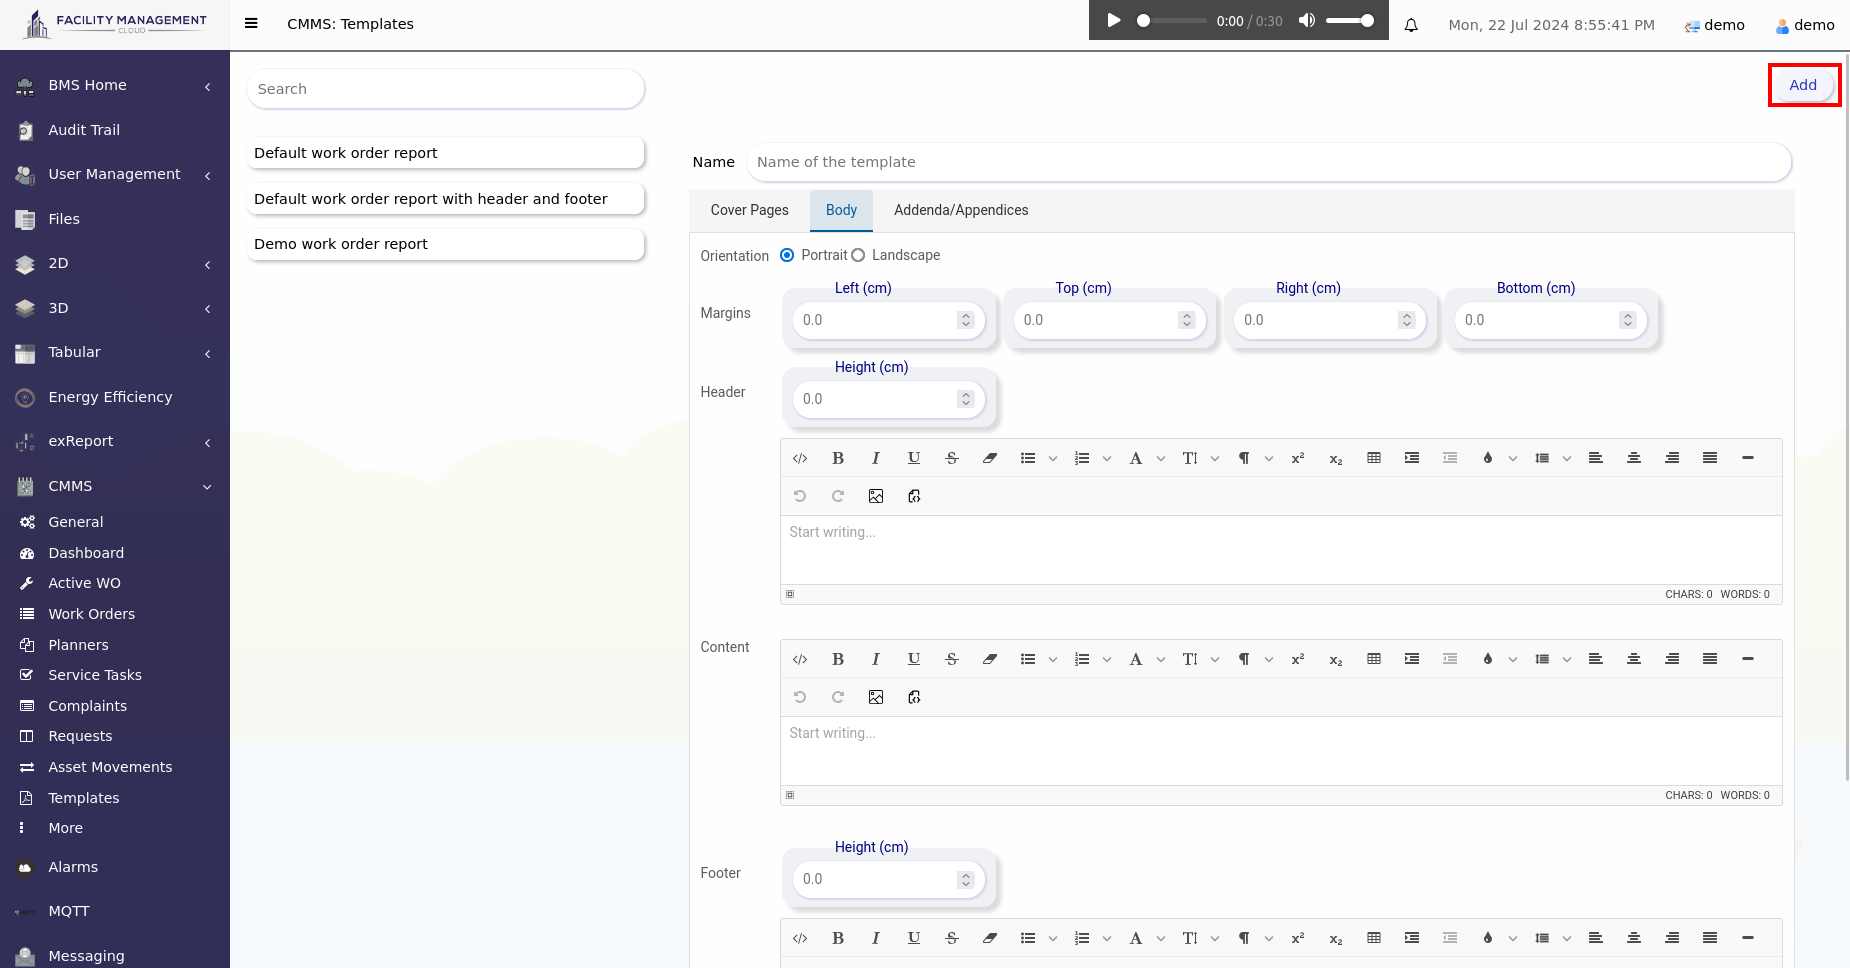
2. You can customise your report template with your preferences
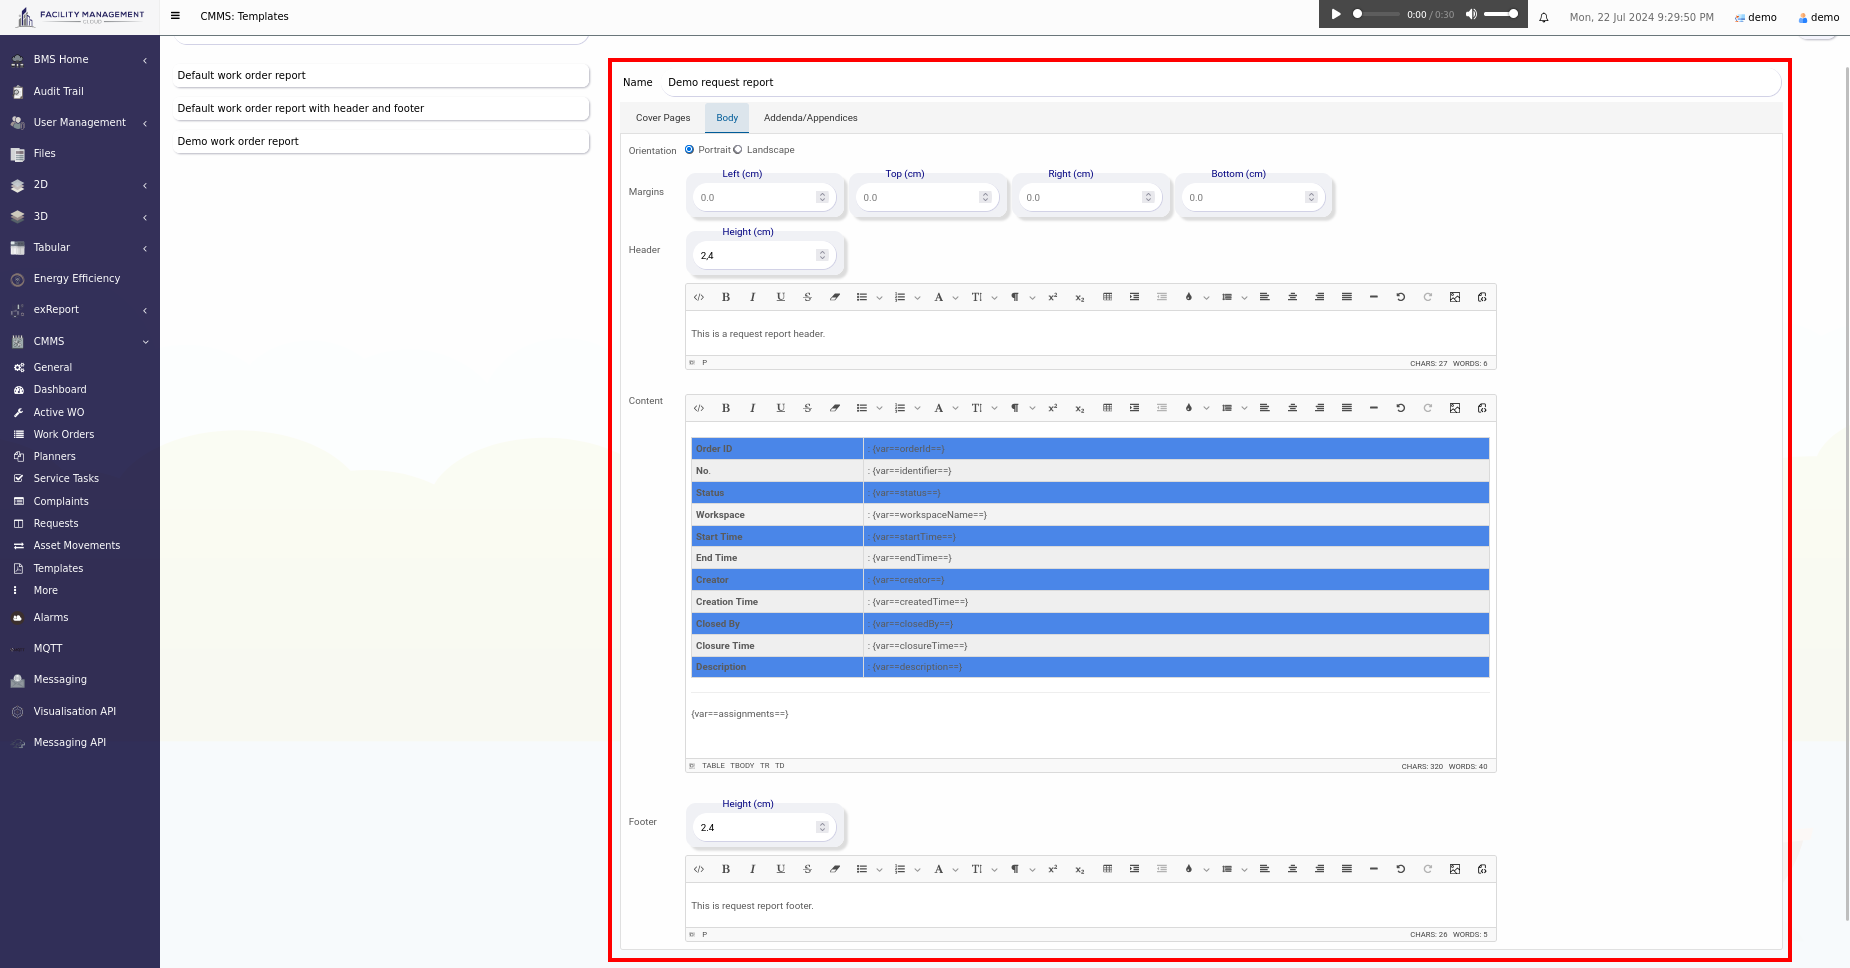
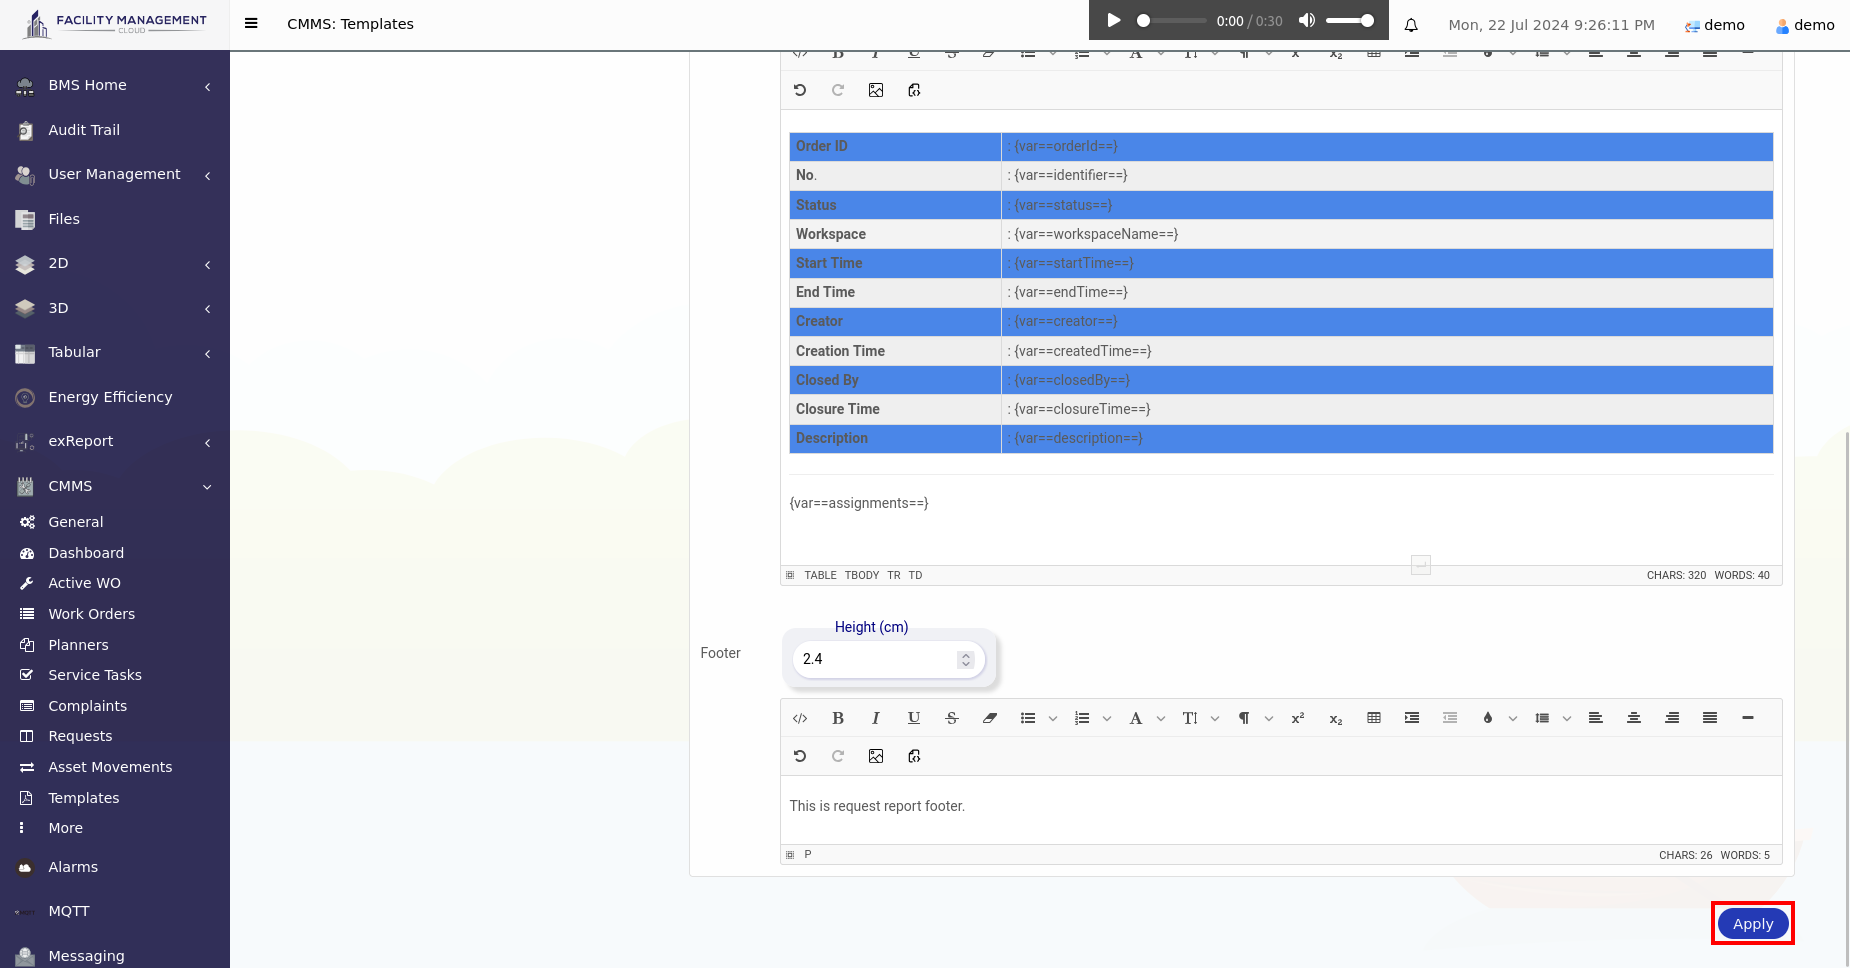
3. After you finished your customisation, click "Apply" button.
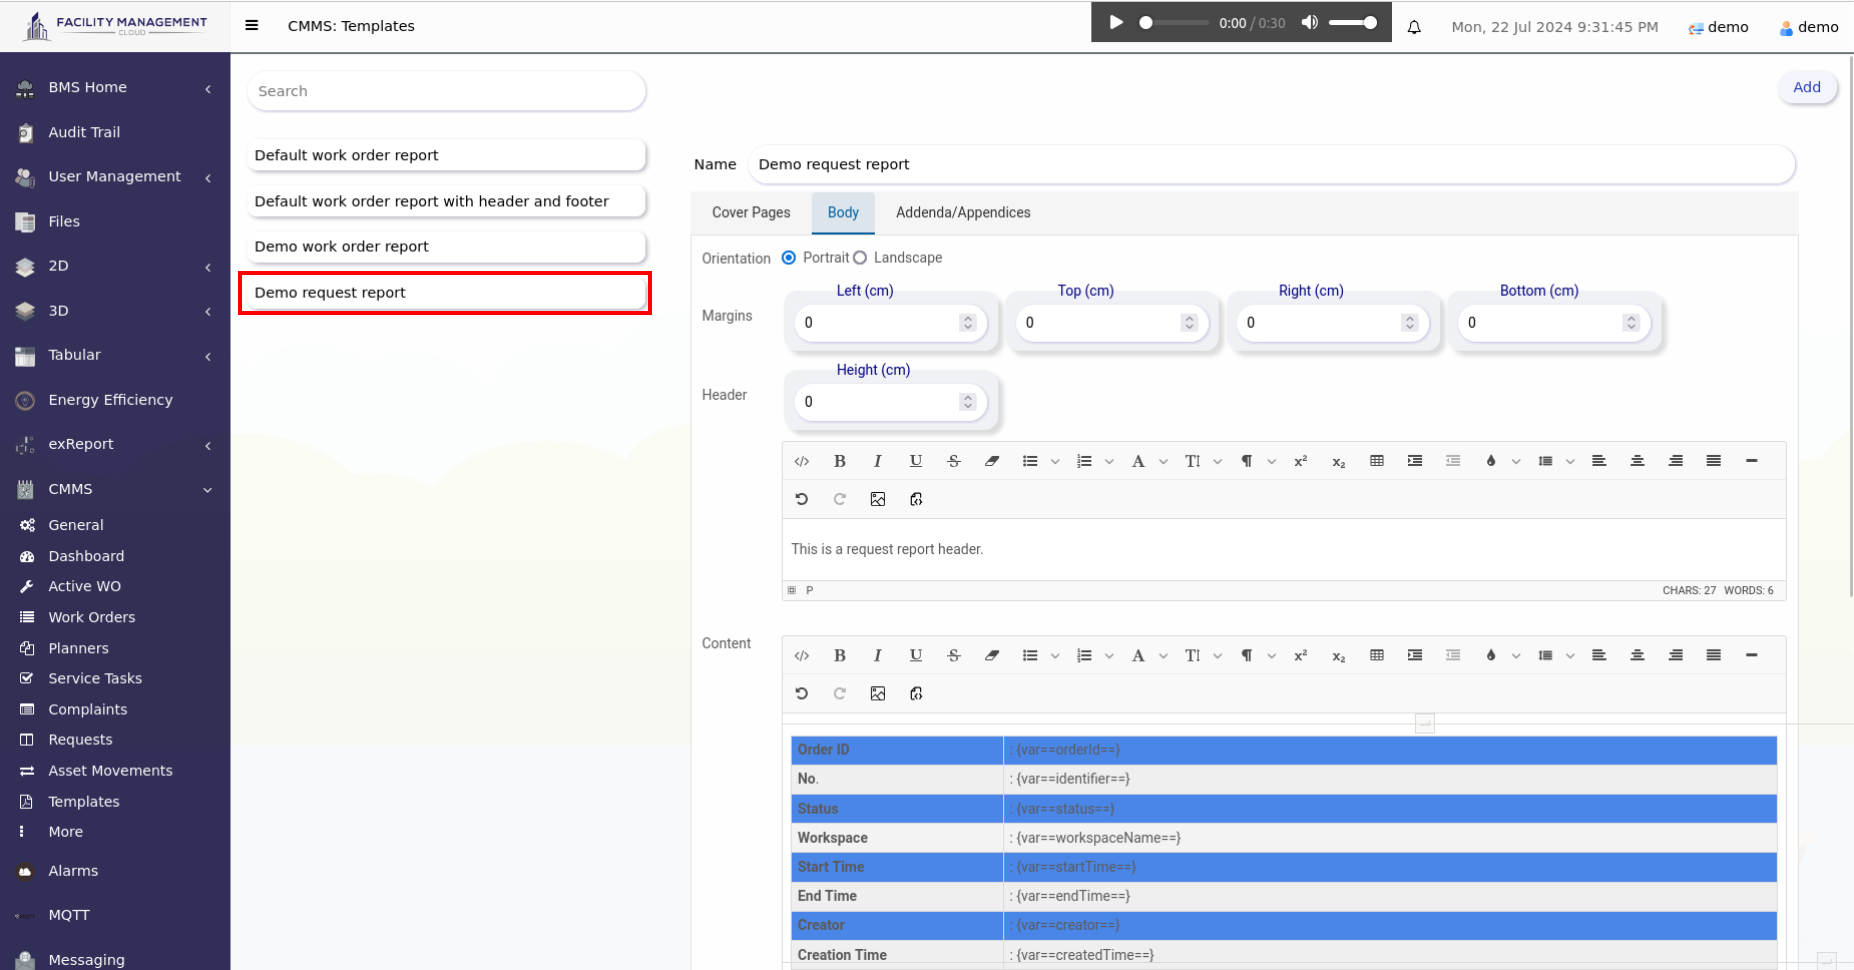
4. The new template will shown at the left side of the page.
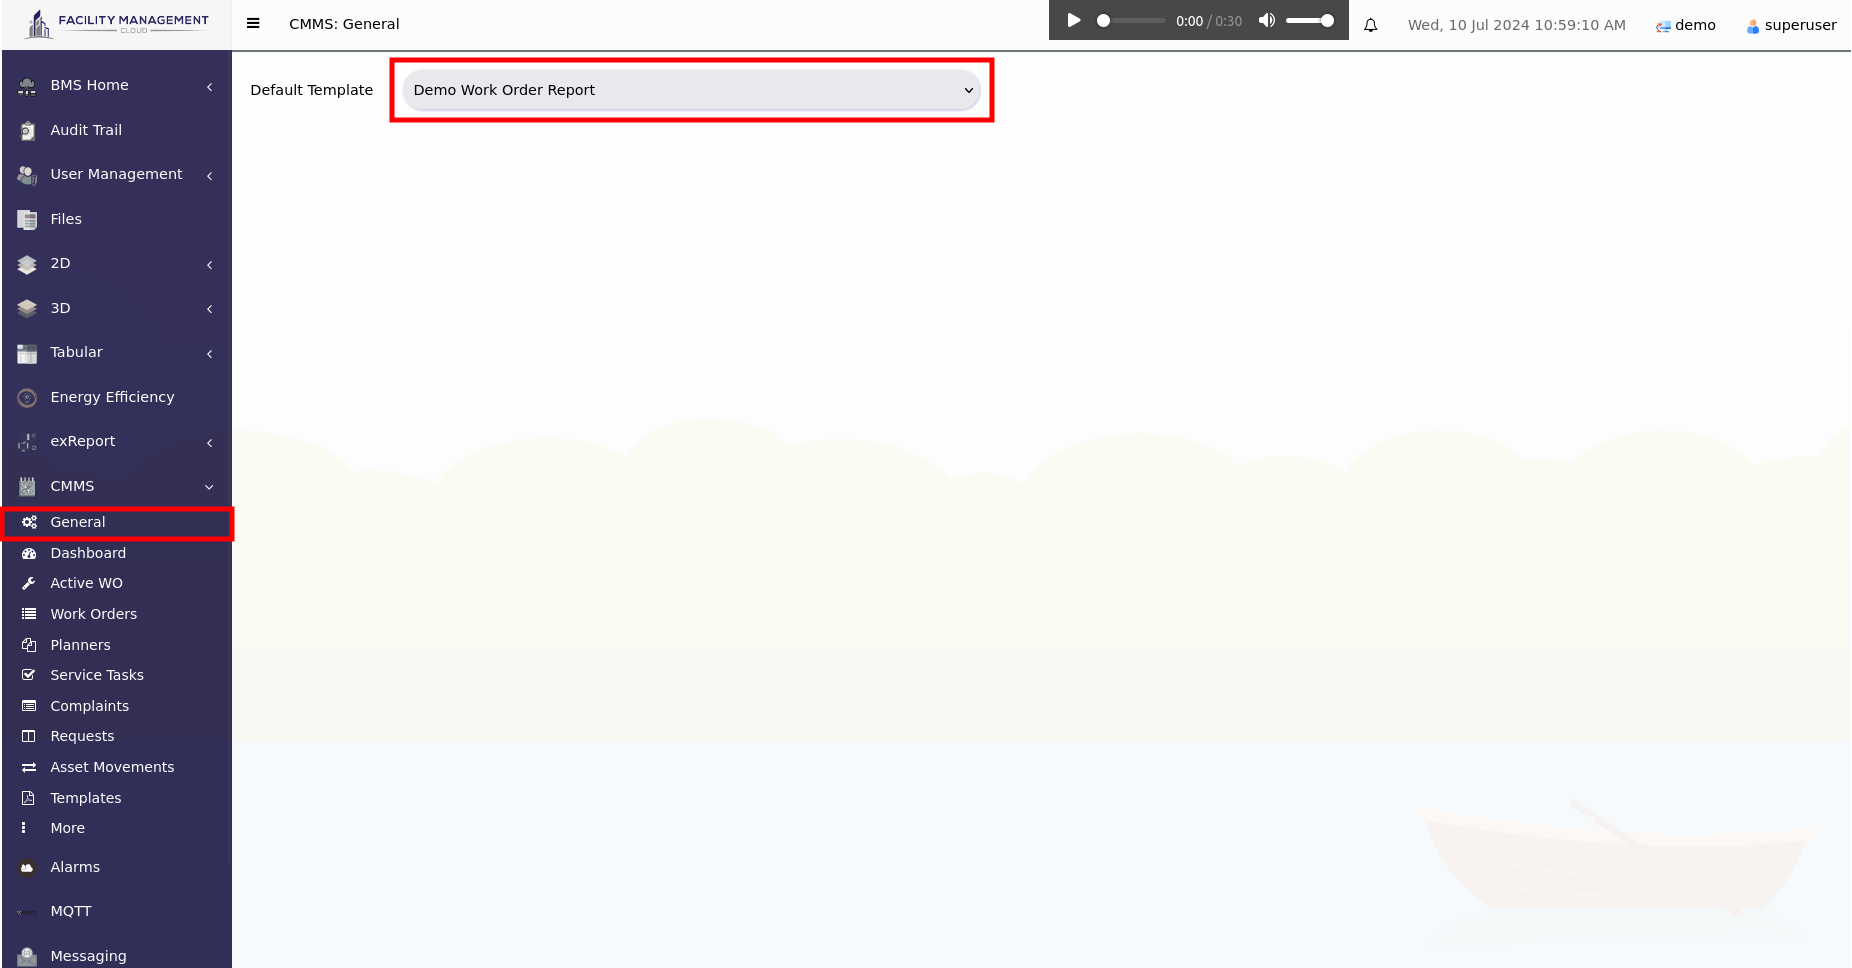
To set the general default template for every work order, click the General section and choose your default template.
The asset's QR Code in the CMMS is provided for making complaints related to the corresponding assets when an asset is needed to be maintained, such as servicing, functional checks, or repairing. Users and guests are able to make requests instantly via scanning the QR code, and the planner can generate corresponding work orders from the requests. Consequently, with the QR Code, the CMMS has a high potential for ensuring that the assets are always in well-maintained.
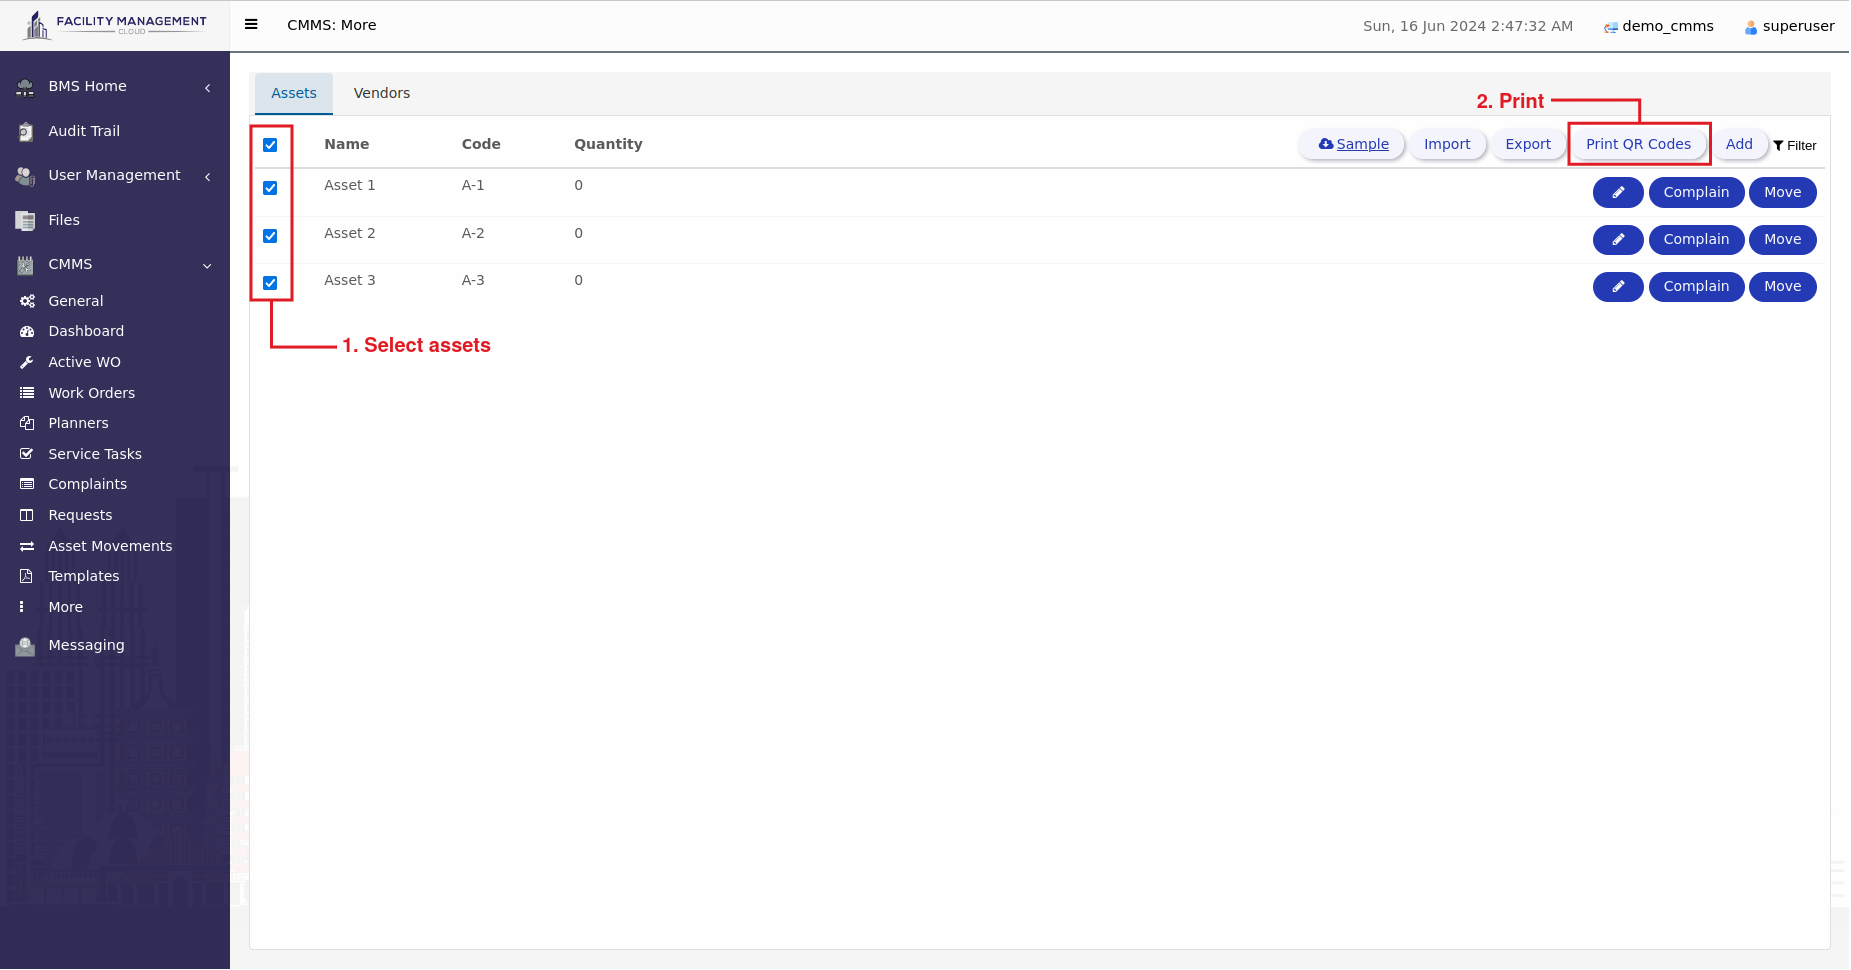
On the Assets page, check the checkboxes of the assets that you desire to print out. Then, click the Print QR Codes button.
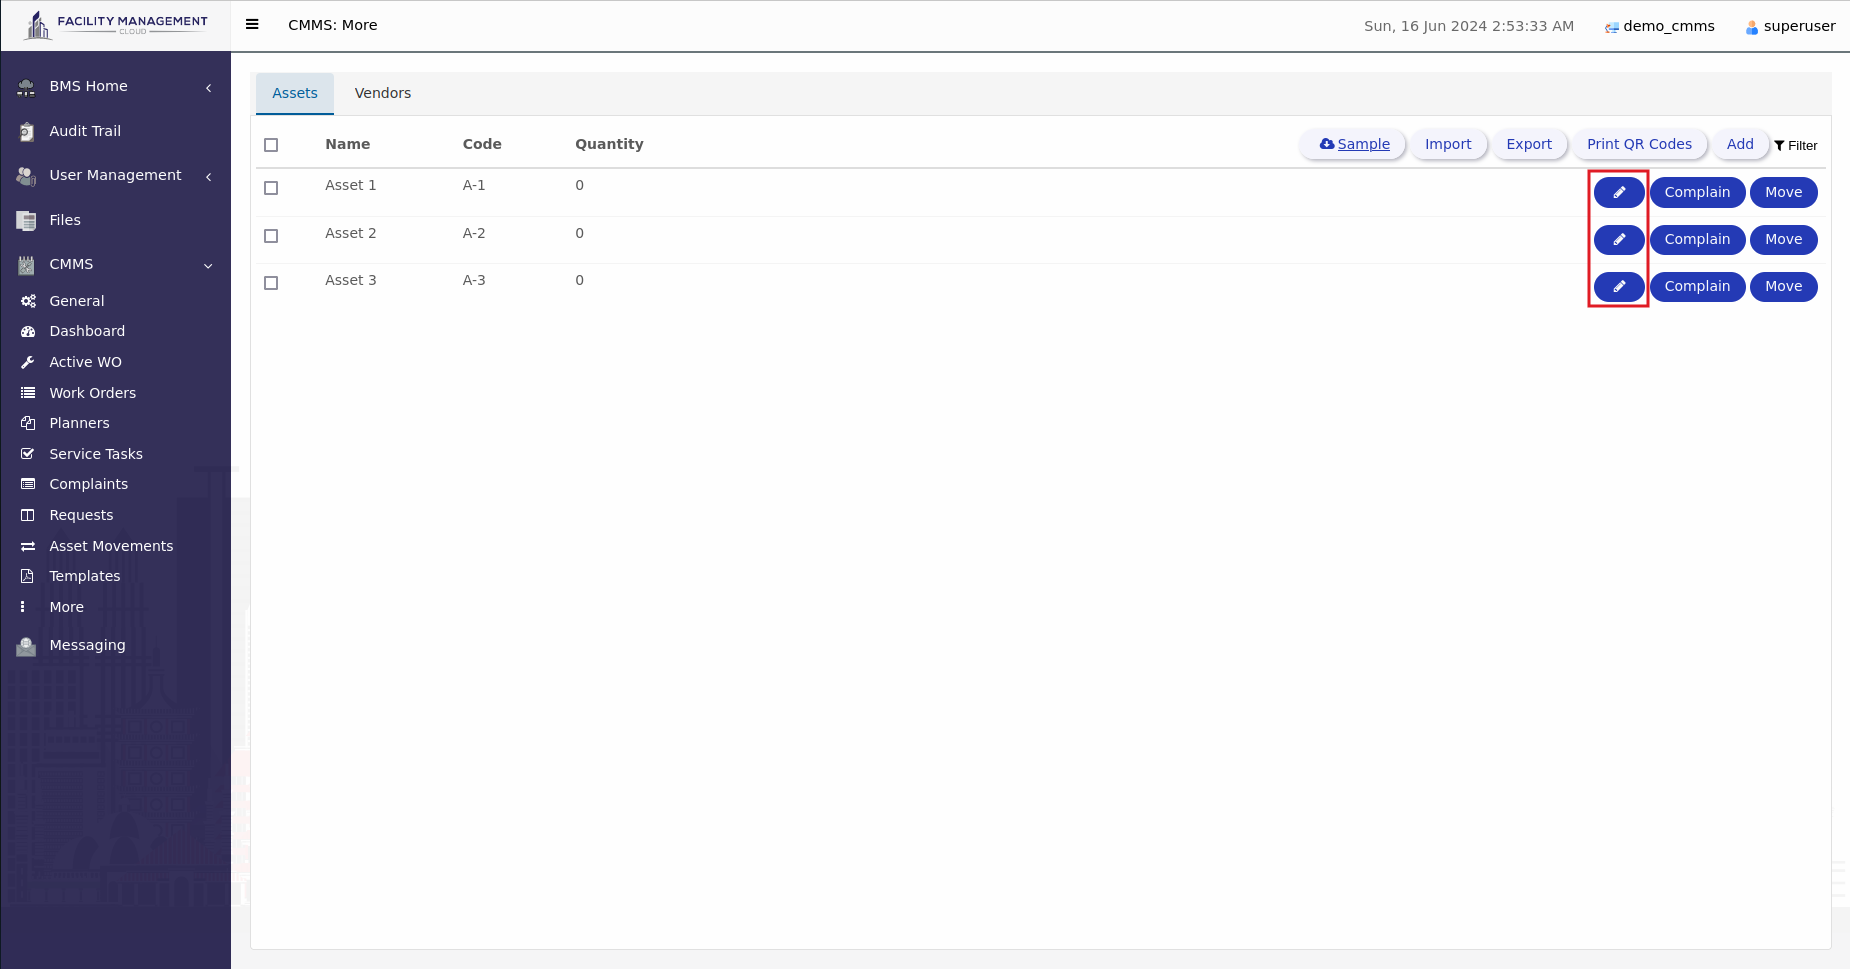
Users also can open the edit page to display and print the QR code for the corresponding asset:
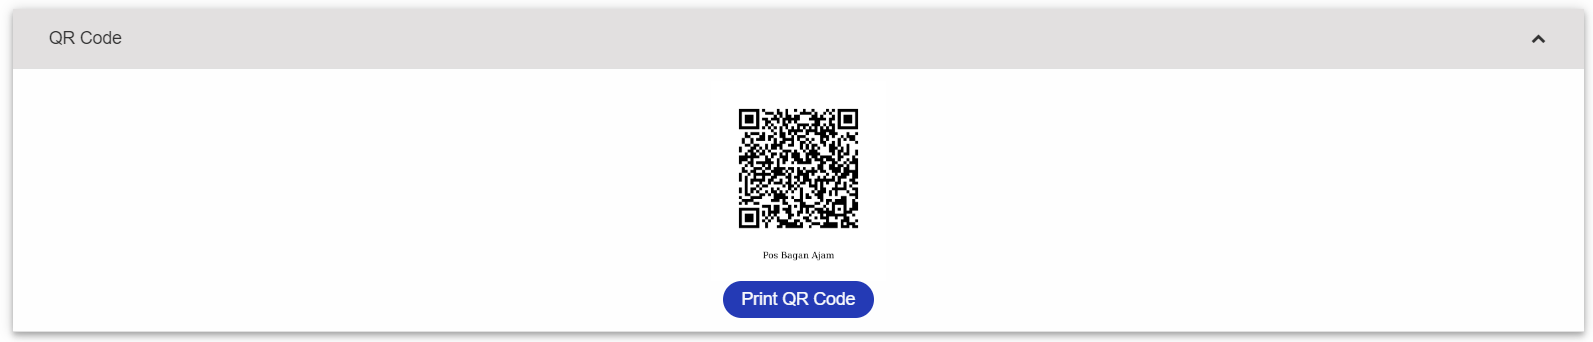
Scroll to the bottom of the popped-out window. Click the Print QR Code to print out the QR code.
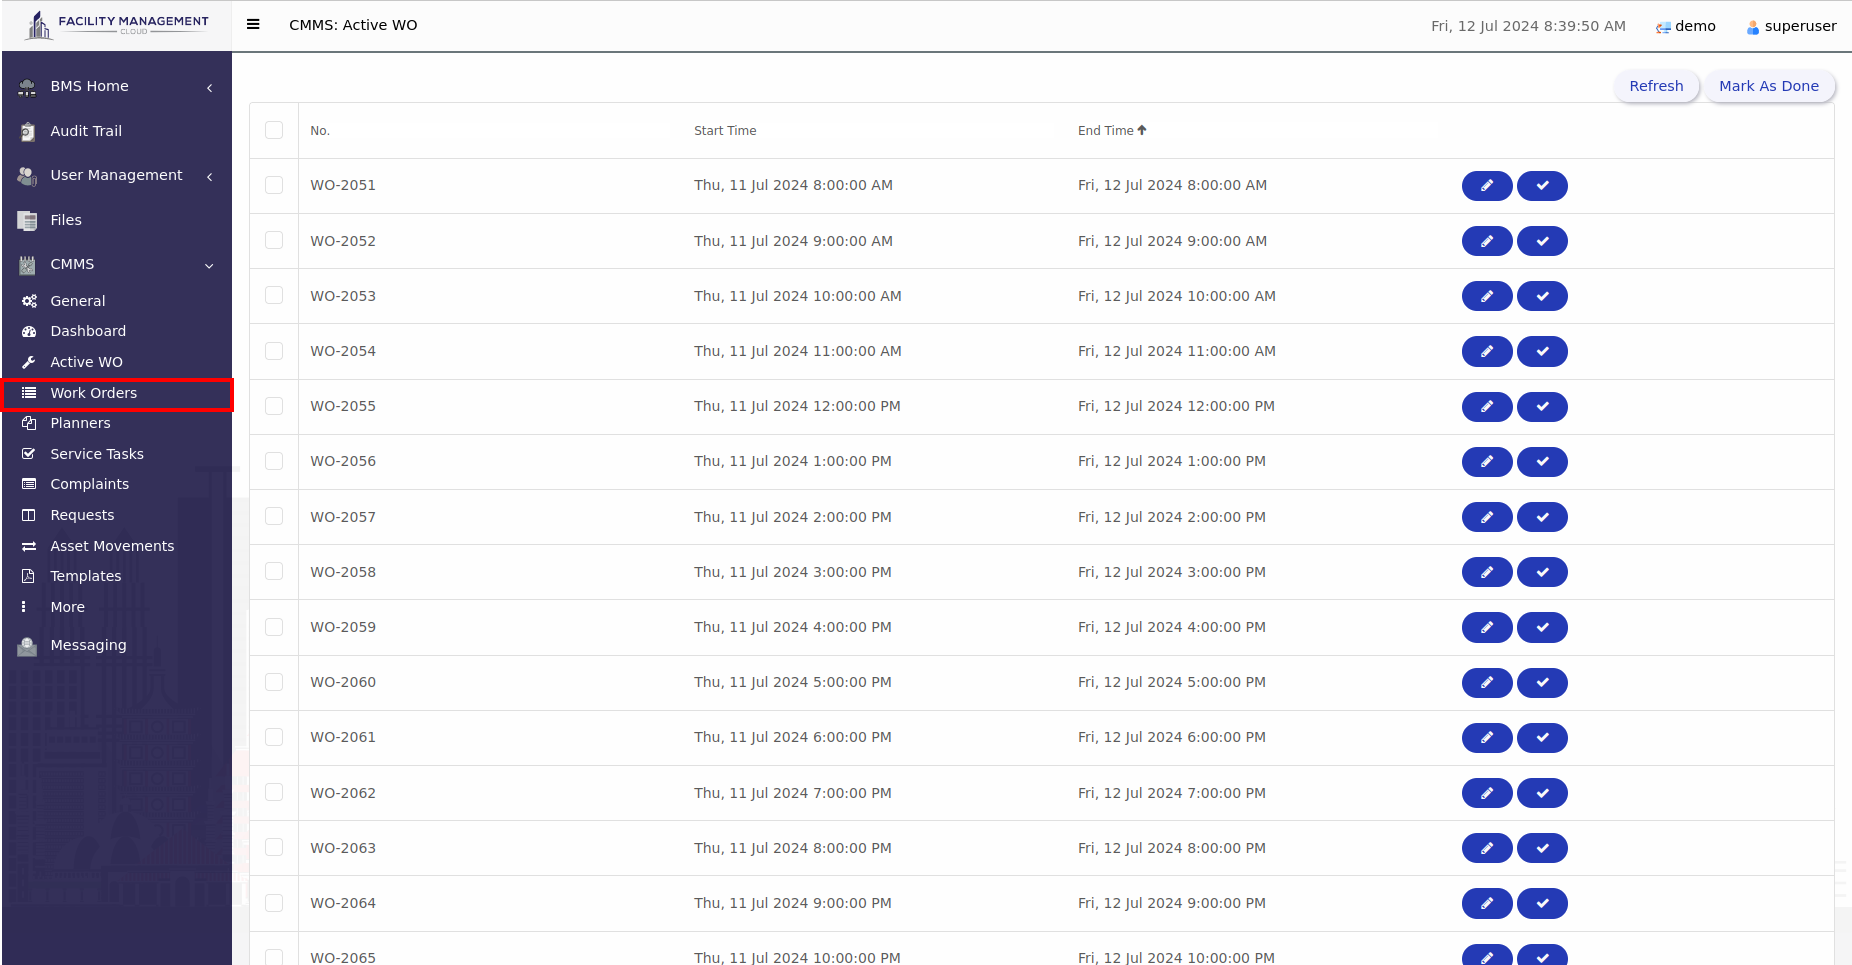
Active Work Orders (WO) feature displays the opened work orders that need to be completed by the user. Users can manage the work orders more easily in Active WO.
The criteria for a work order to appear in the Active Work Orders (WO) list includes the following:
Check the checkbox at the left side, you can click the  to mark your Work Order as DONE.
The FMC device serves as the gateway for communication between the local IOPoints and the FMCC cloud. It acts as the intermediary that allows the local IOPoints, which are connected to the FMC device, to transmit data to the FMCC cloud. The FMCC cloud, in turn, can communicate with the Building Management System (BMS) using open protocols such as BACNet, Modbus, and others. These protocols enable seamless data exchange and integration between the FMCC cloud and the BMS system, allowing for effective monitoring, control, and management of the building's systems and devices.
Each FMC device is pre-configured by Senfficient with a unique ID and initial settings. These pre-configurations ensure that the device is ready to establish client/server communication with the FMCC cloud server. The unique ID assigned to each device helps in identification and tracking, allowing for seamless integration into the FMCC ecosystem. With the pre-configured settings, the FMC device can quickly establish a secure and reliable connection to the FMCC cloud, enabling efficient data transmission and management of the connected IOPoints.
To make changes to the FMC devices, please follow the steps:

Depending on the business module subscribed by the respective workspace, the left and right menus will display the relevant options and features.
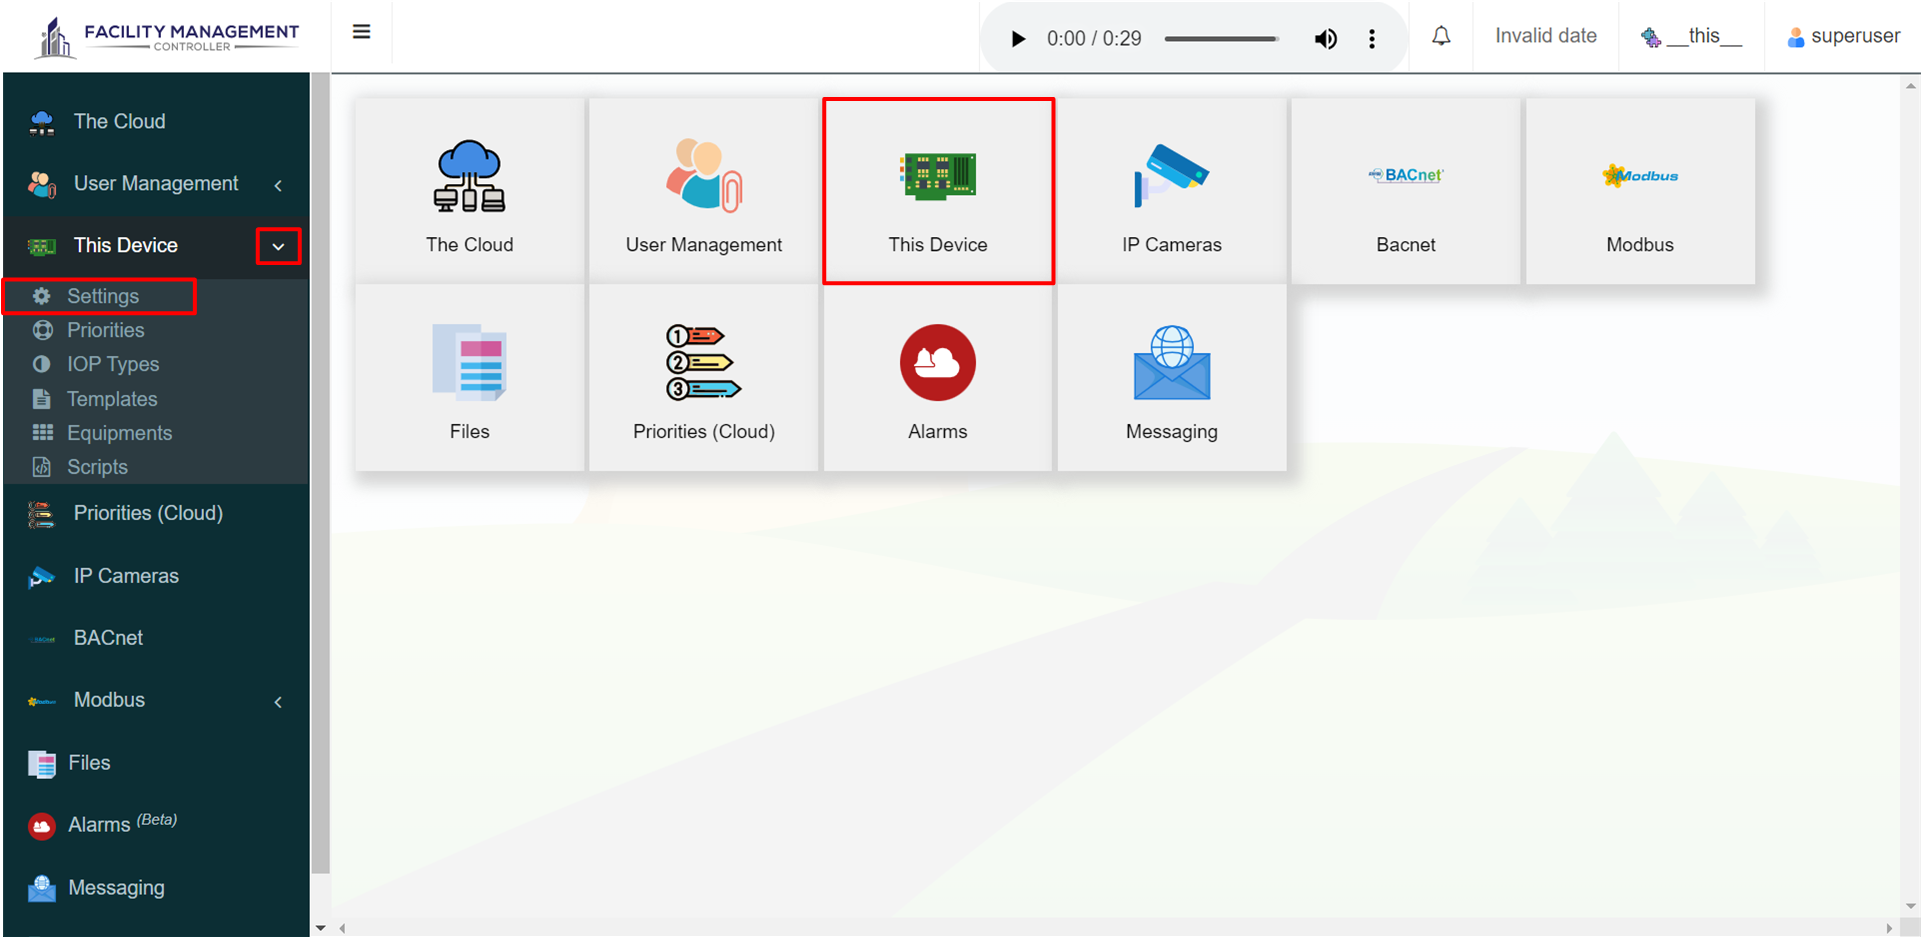
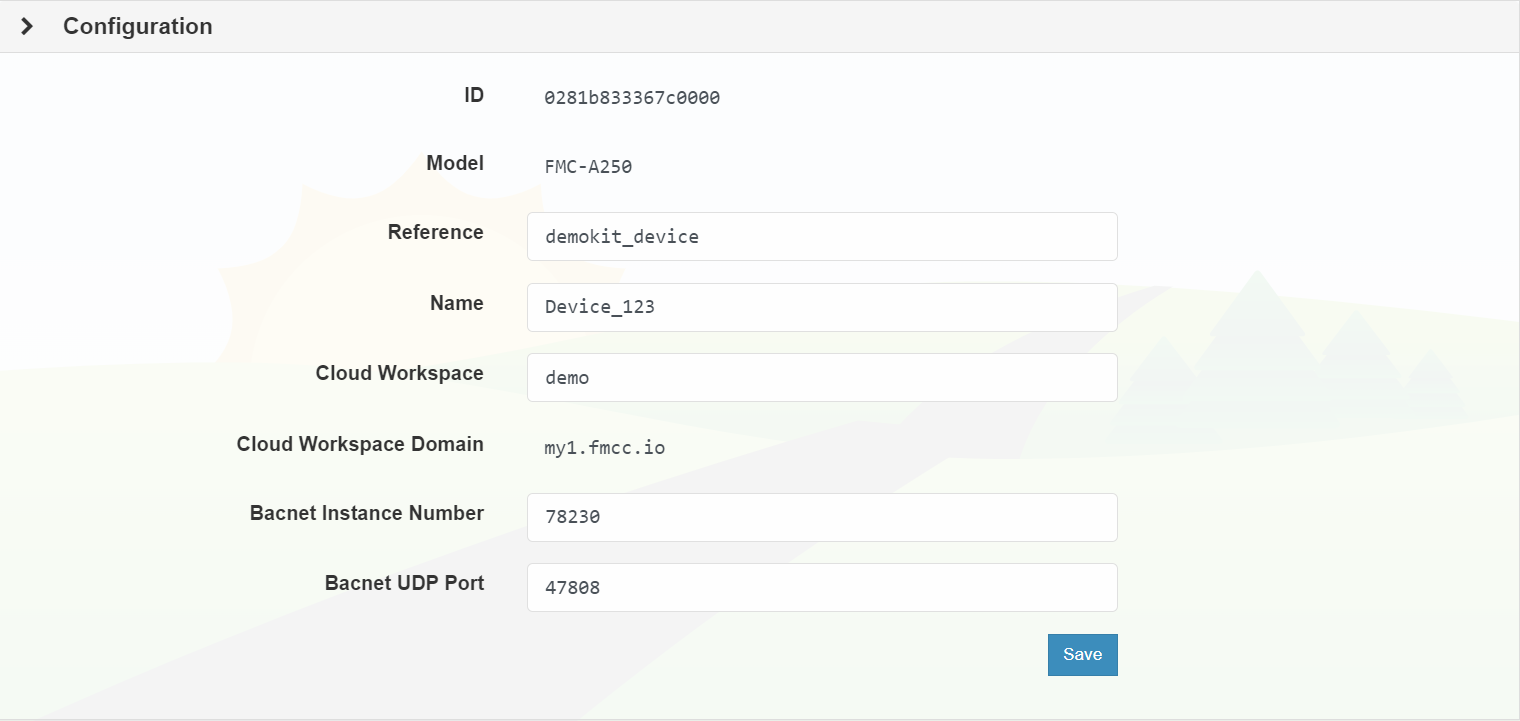
To initiate the configuration of the FMC Device, click on "This Device" or expand the dropdown menu and select "Settings". This will allow you to access the settings interface and make the necessary configurations for the device.
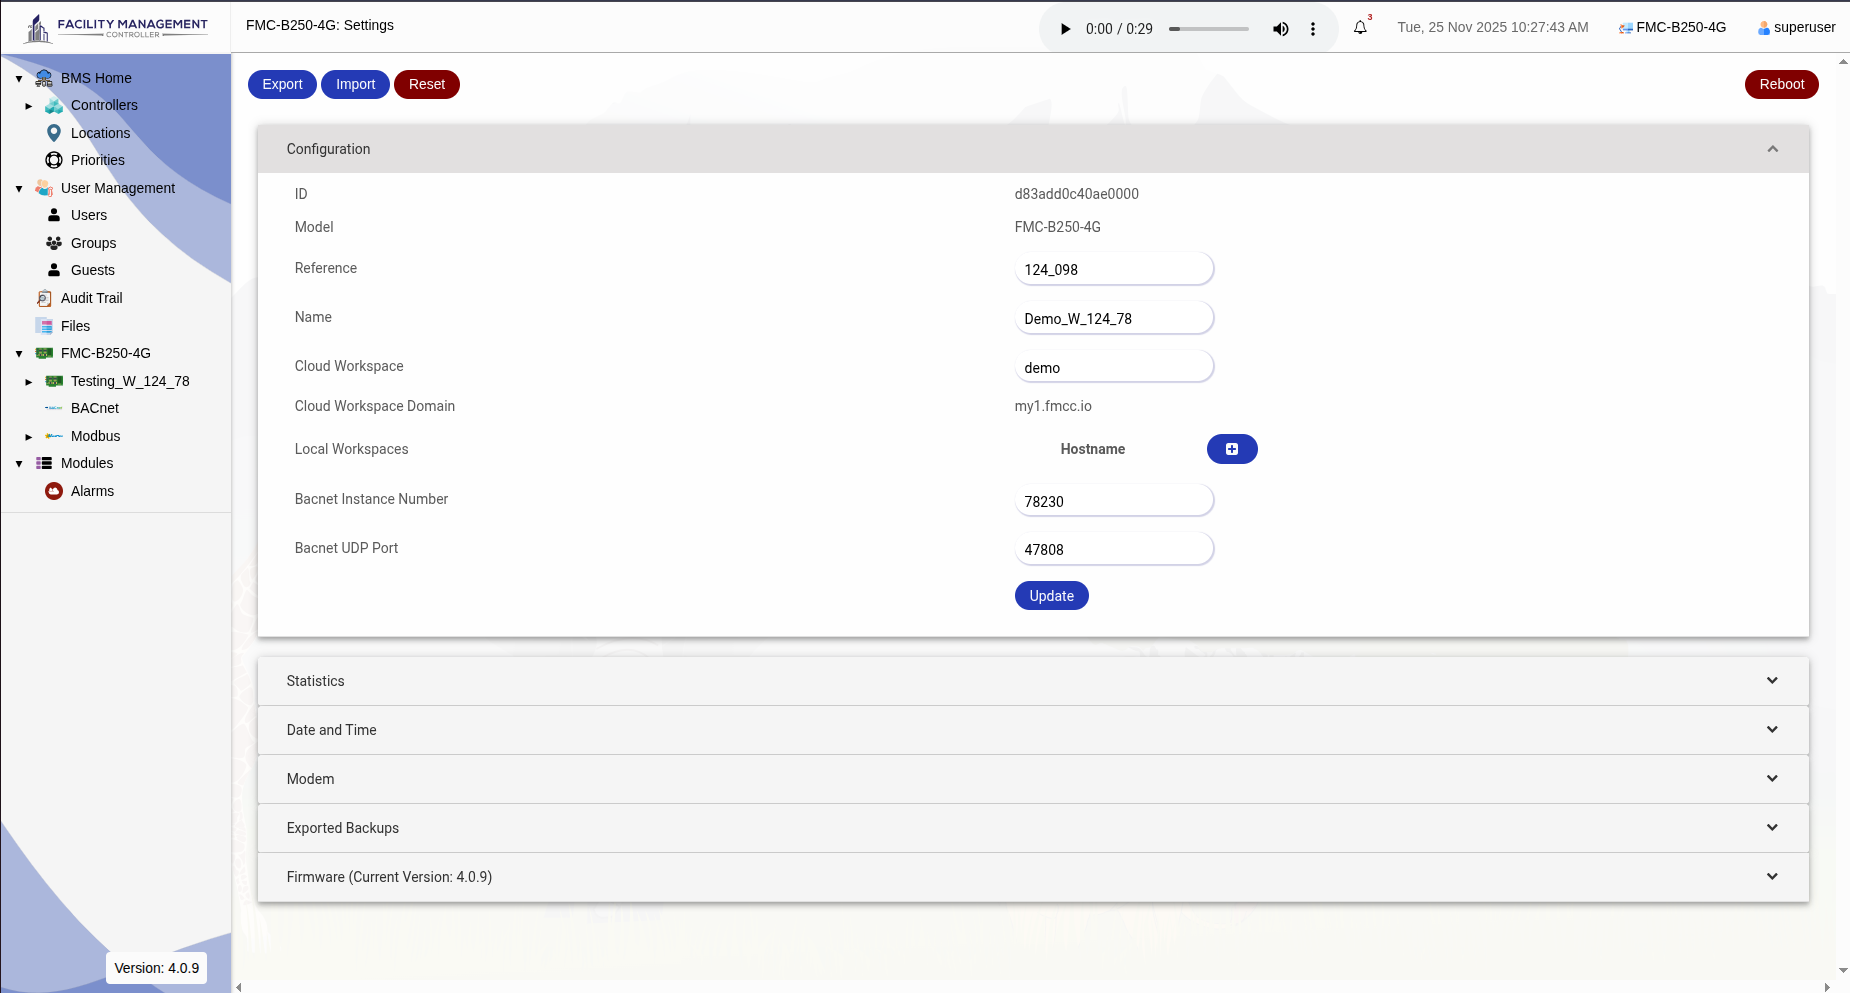
| Attribute | Description |
|---|---|
| ID | An ID is a unique identification code assigned by Senfficient to ensure individuality and exclusivity. It serves as a distinct identifier for various purposes such as tracking, authentication, and record-keeping. The pre-configured nature of these IDs guarantees their uniqueness and helps facilitate efficient management and organization. |
| Model | The FMC Devices are assigned unique model numbers that serve as a specific identifier for each device. When users require support or assistance with their FMC Device, it is important for them to mention the model number of their device. This helps the support team to accurately identify the device model and provide the appropriate assistance, ensuring a more efficient and targeted resolution to any issues or inquiries. |
| Reference | The device information is a crucial reference for users to input important details about their FMC Device. These details are then displayed on the FMC Cloud platform, offering users a convenient and accessible overview of their device's specifications. Accurate and up-to-date device information enables proper identification and effective management within the FMC Cloud environment. This facilitates seamless integration with other system components, enhances user experience, and enables efficient monitoring, configuration, and control of the device. |
| Name | The chosen name for the device will be registered on the FMCC Cloud platform. It is important to select an appropriate name that accurately represents the device and allows for easy traceability from the cloud to the specific equipment or location where the device is connected. This ensures clear identification and efficient management of the device within the FMCC Cloud ecosystem. |
| Cloud Workspace | This is a critical field and should not be changed once properly set up. For the accurate workspace name, please consult the site administrator. |
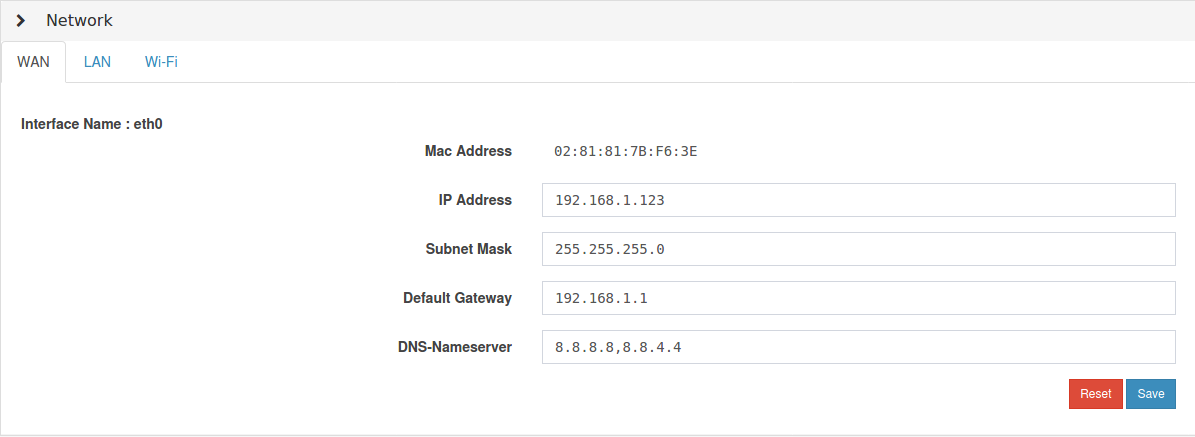
This is to configure the FMC Device network setting. For further details on this topic, please refer to Network Management.
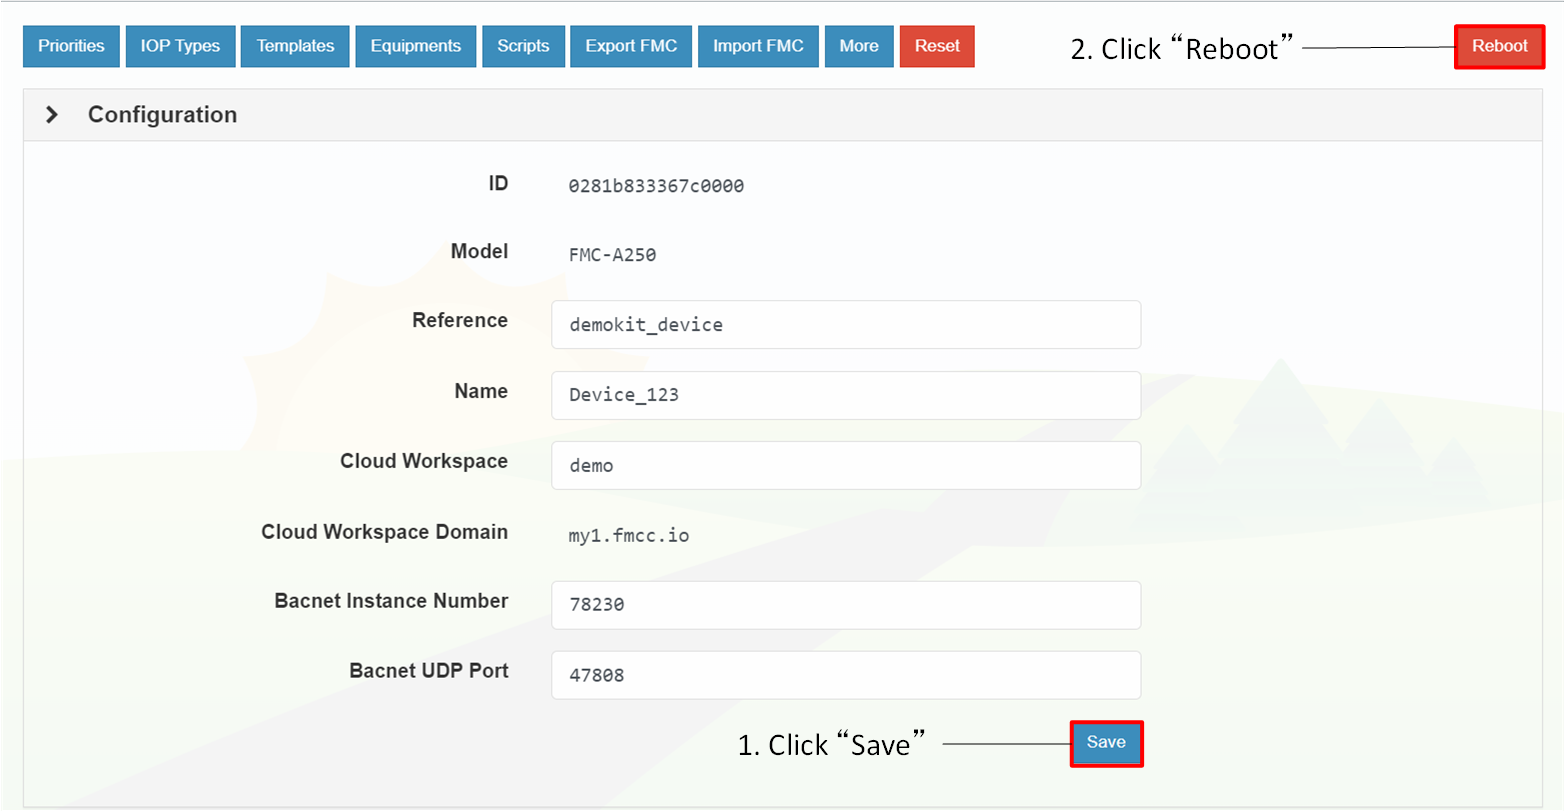
Once the configuration is completed, please click on the Save button, and then proceed to reboot the device by clicking on the Reboot Device option.
The rebooting process typically takes around 1-2 minutes. After the device has finished rebooting, you can optionally log in again to verify the settings.
The Data Summary module is designed to summarise available logged data in the system for analytical processes. It provides users with comprehensive insights into their datasets, enabling tasks such as event forecasting and more. Currently supported data types include:
Learn more about Point Type
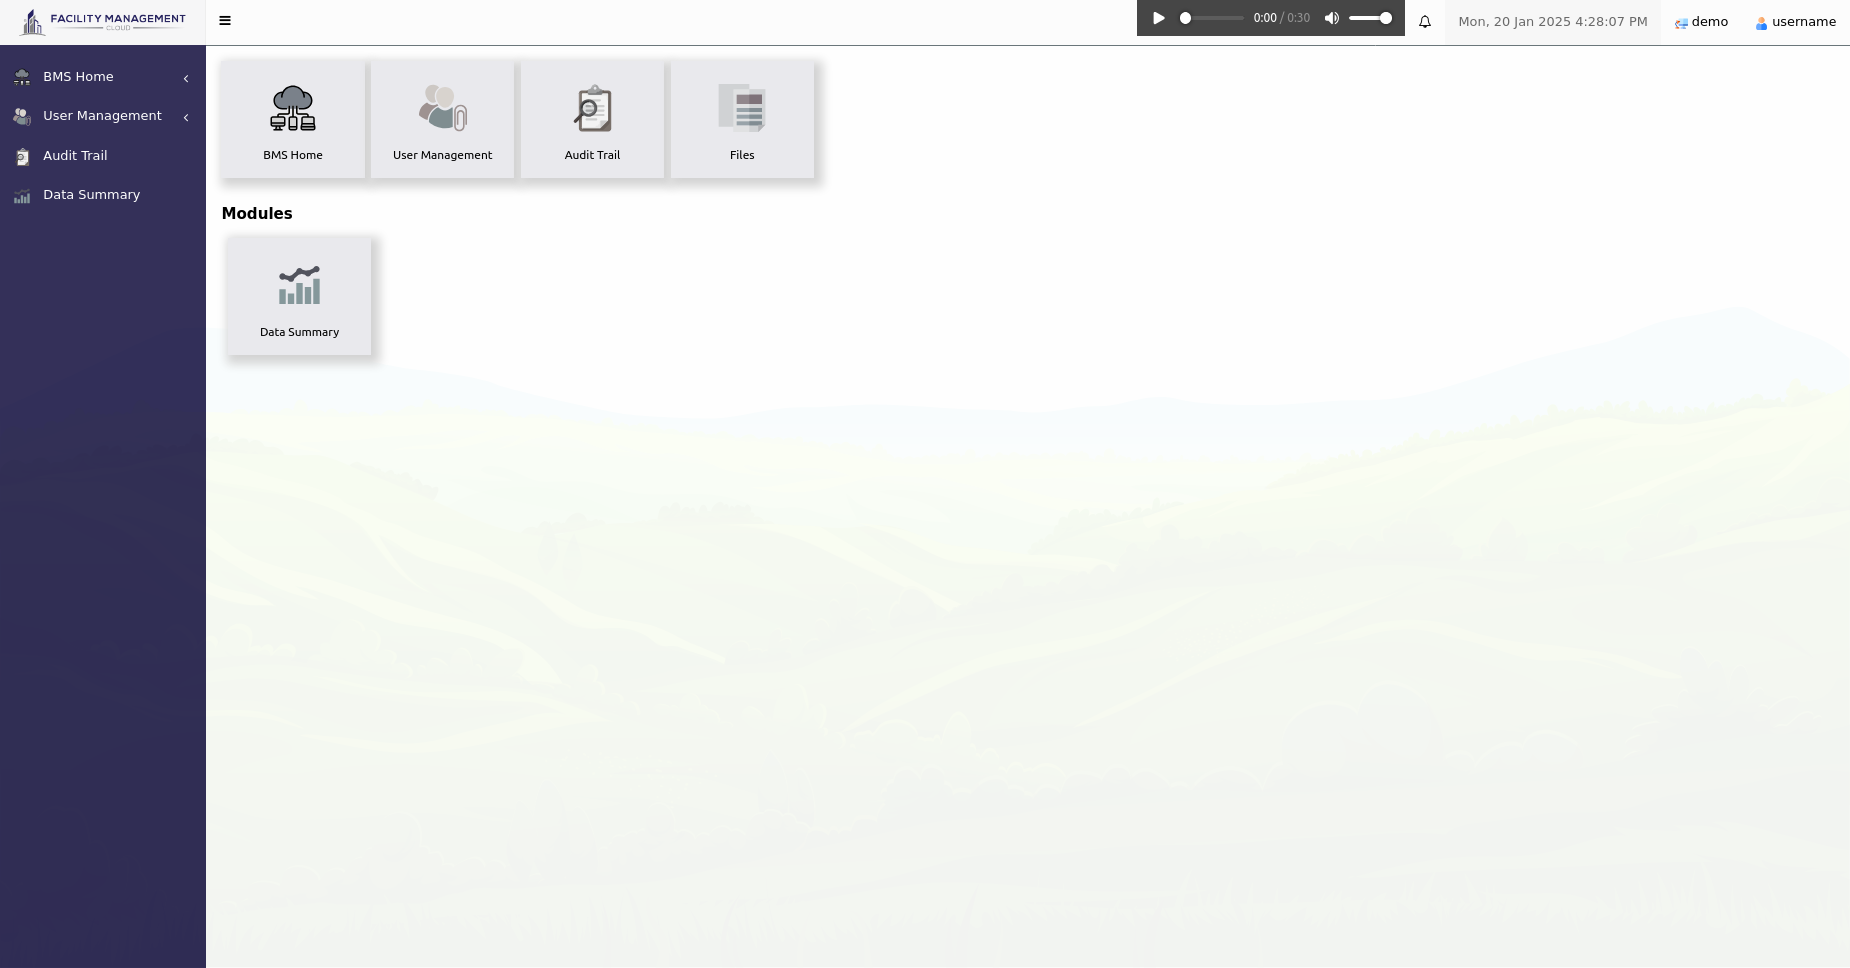
This dashboard provides a summary of alarm activiy for monitored equipment. It helps users quickly assess alarm frequency, duration, and system stability over a selected time period.
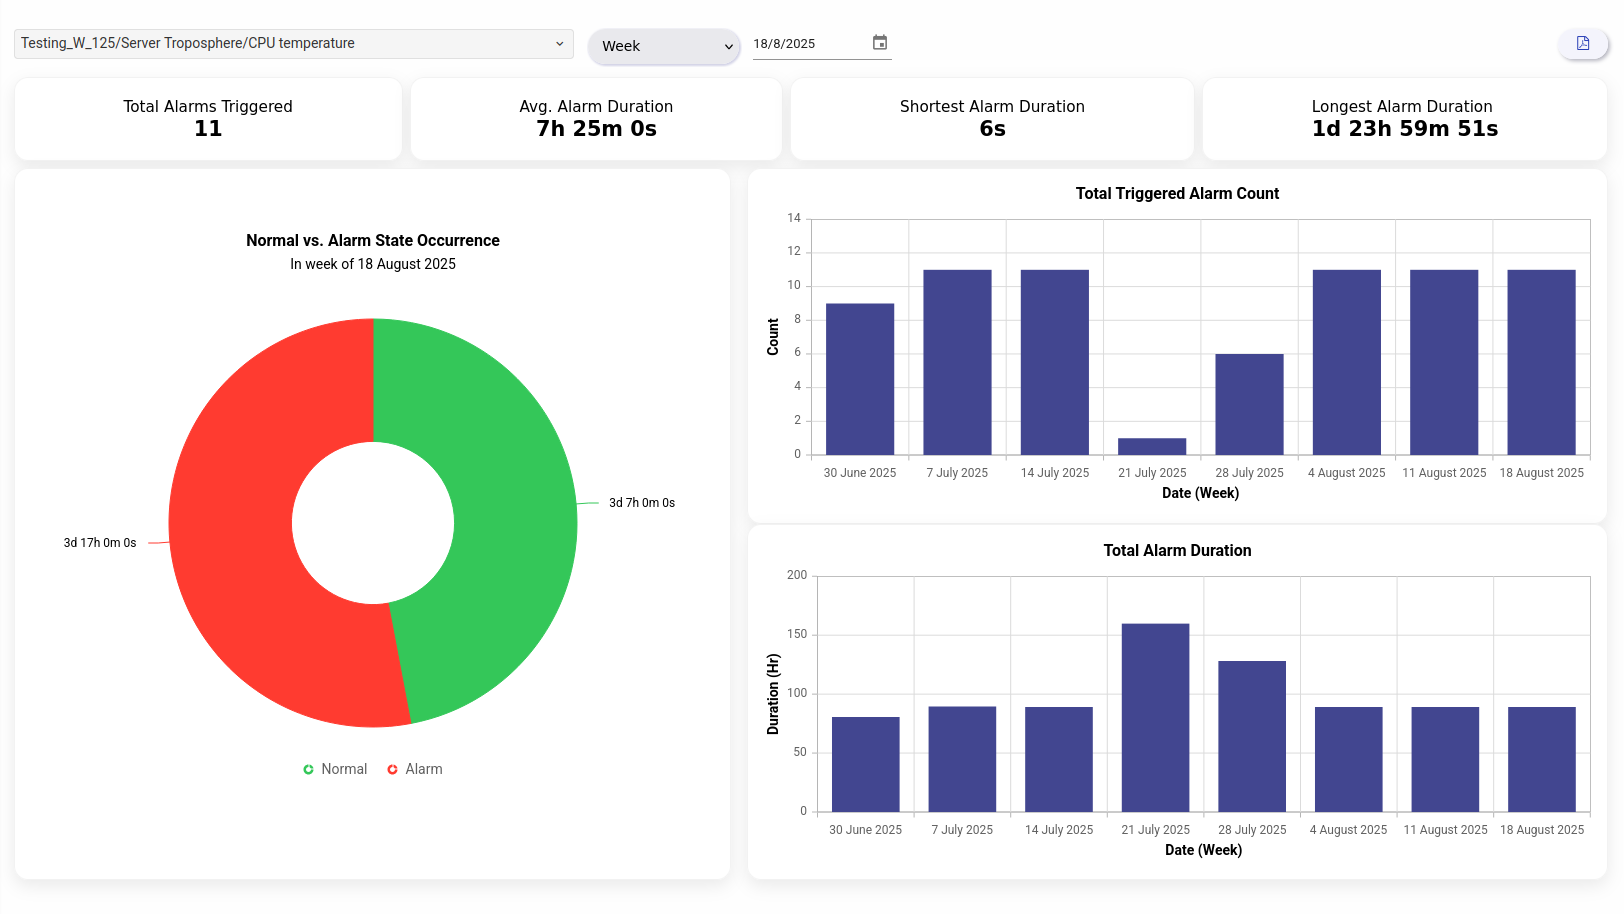
This pie chart shows how much total time the equipment spent in the Normal state versus the Alarm state.
This bar chart shows the total number of alarms triggered in the past 7 recorded periods.
This bar chart shows the total alarm duration in the past 7 recorded periods.
Note: If the bar chart shows fewer than 7 bars, it means there were no summarized records for some of the selected periods.
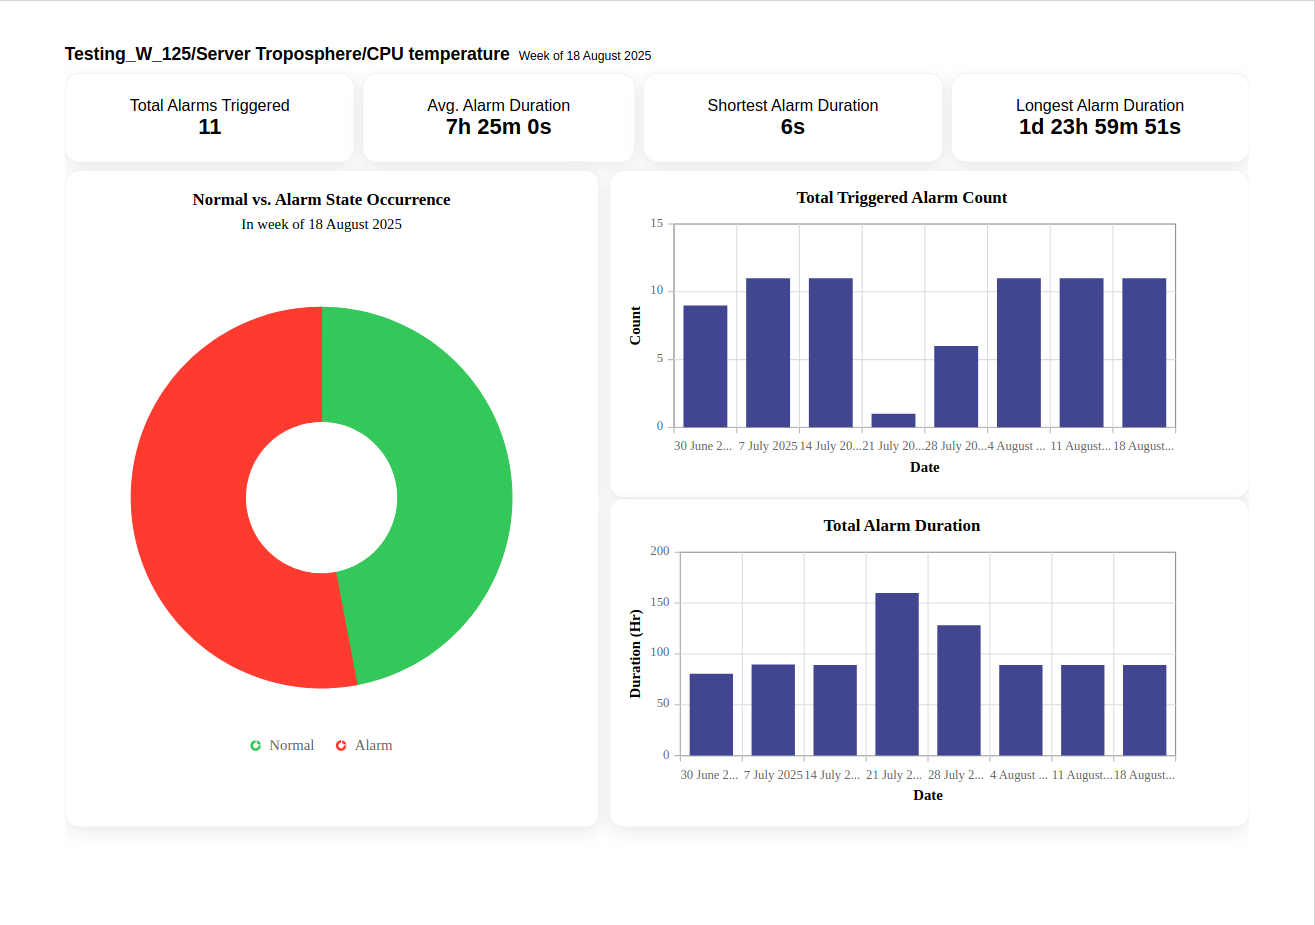
The logged values of a physical controller are utilised for data summarisation.
Values with errors, or those exceeding the high-high or falling below the low-low thresholds for analogue point types, are excluded from summarisation.
The following statistical metrics are included:
For the multistate and binary point types, they only included these statistical metrics: Total Triggered Alarms and Total Alarm Duration
This guide outlines the features of the Data Summary module, enabling users to summarise, filter, and export logged data efficiently. With options for custom time frames, and export formats (CSV/PDF), it simplifies data analysis and reporting. Advanced users can also leverage the AI⁺ module for automated insights and recommendations.
Currently, the system supports three types of points: Binary, Multistate, and Analogue.
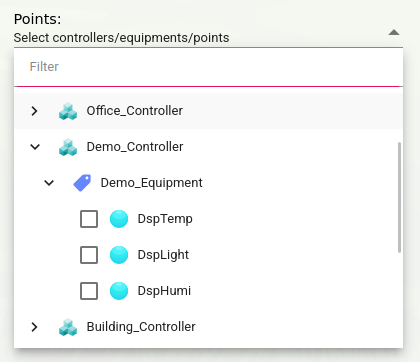
Users can filter the displayed data based on a specified time range. The Time Frame dropdown menu provides the following options:
| Time Frame | Start | End |
|---|---|---|
| Day | Selected date, 12:00 AM | Selected date, 11:59 PM |
| Week | Monday of the week, 12:00 AM | Sunday of the week, 11:59 PM |
| Month | First day of the month, 12:00 AM | Last day of the next month, 11:59 PM |
| Quarter of a Year | First day of the quarter, 12:00 AM | Last day of the next quarter, 11:59 PM |
| Half-Year | First day of the half-year, 12:00 AM | Last day of the next half-year, 11:59 PM |
| Year | First day of the year, 12:00 AM | Last day of the next year, 11:59 PM |
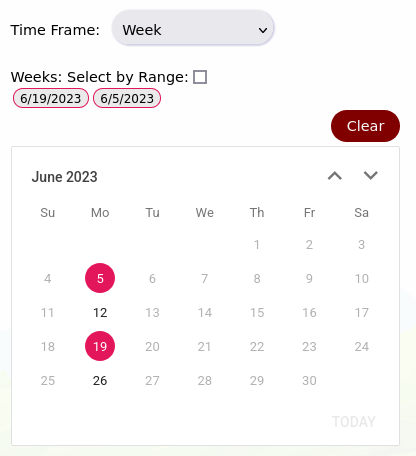
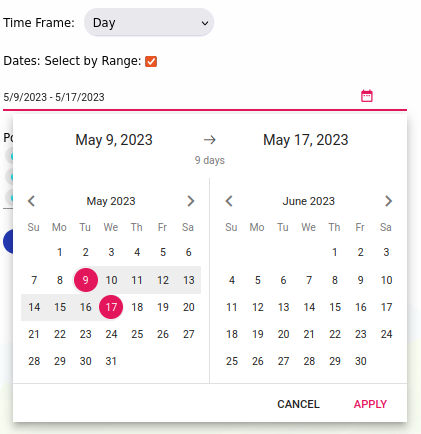
Additionally, a date picker allows users to define a custom date range to view data for specific periods.
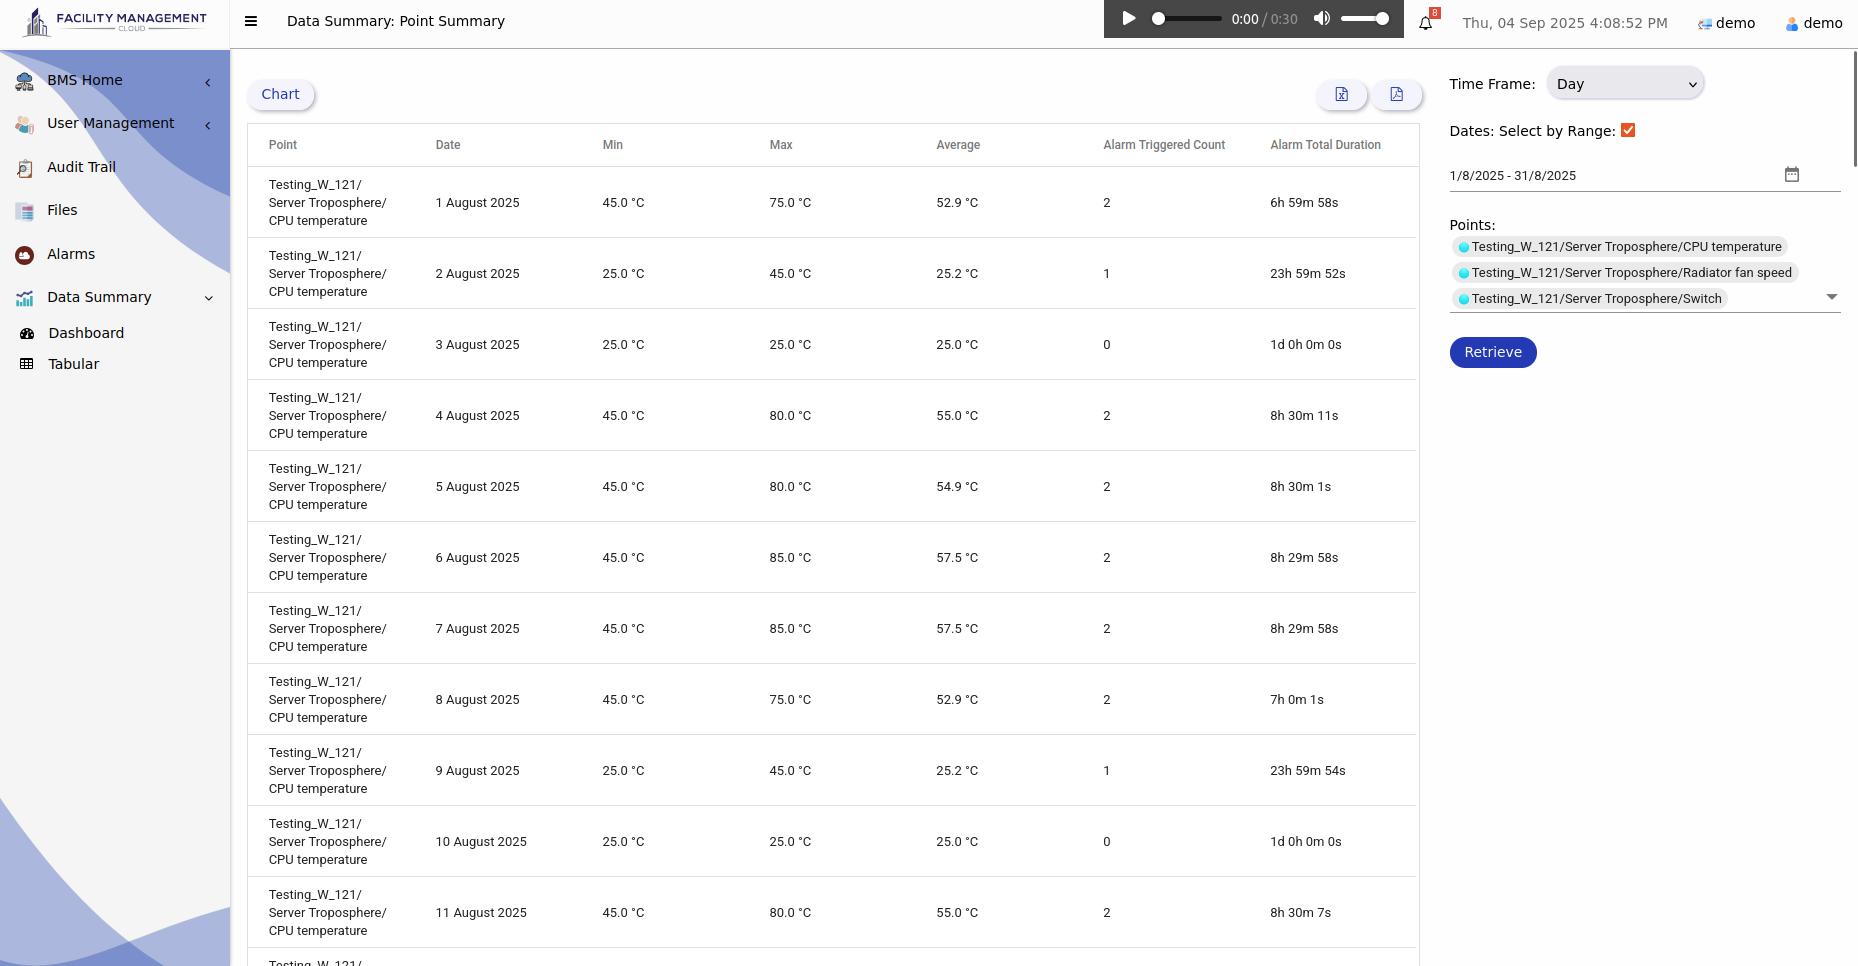
After setting the desired filters (time frame and points), clicking the Retrieve button refreshes the table to display the updated data summary.

By clicking the chart button at the top left of the page, you can view the data of the selected points as a line chart within the chosen period. You can directly compare and view the difference of point data from the chart by these metrics:
For the multistate and binary point types, they only included Total Triggered Alarms and Total Alarm Duration
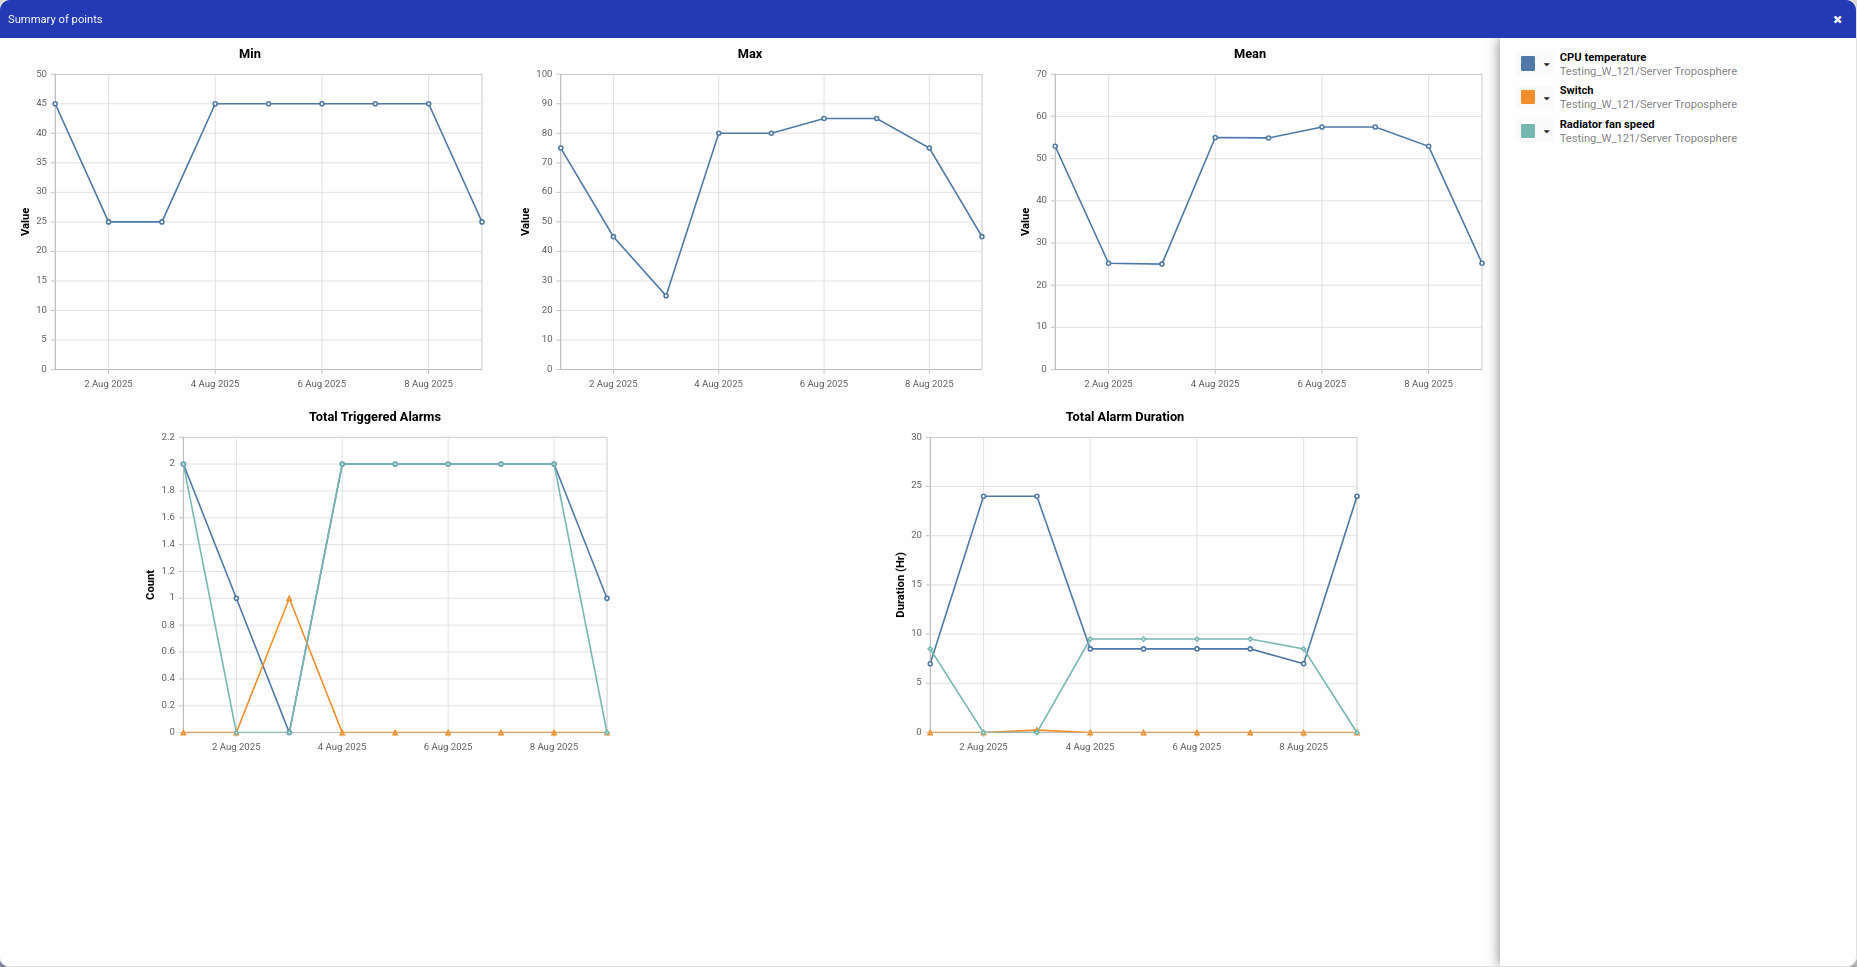
You can hover your cursor over the chart to compare and view the exact values of the points.
To hide the point values, click the corresponding point name in the right-hand sidebar.
You can also change the line colour to any colour according to your preference.
At the top-right corner of the summary table, users can export the summarised data in the following formats:


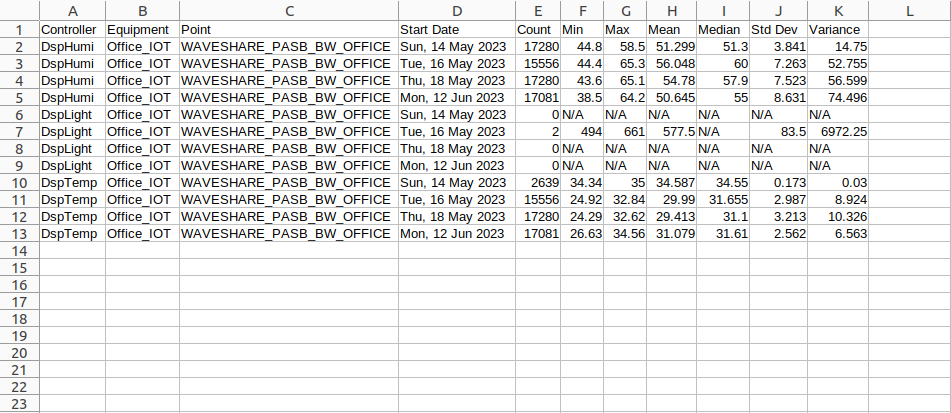
The CSV export provides a detailed view of the summarised data in a tabular format. It includes calculated metrics such as Point, Start Date, Count, Minimum, Maximum, Mean, Median, Standard Deviation, and Variance. This format is useful for data analysis in spreadsheet software.
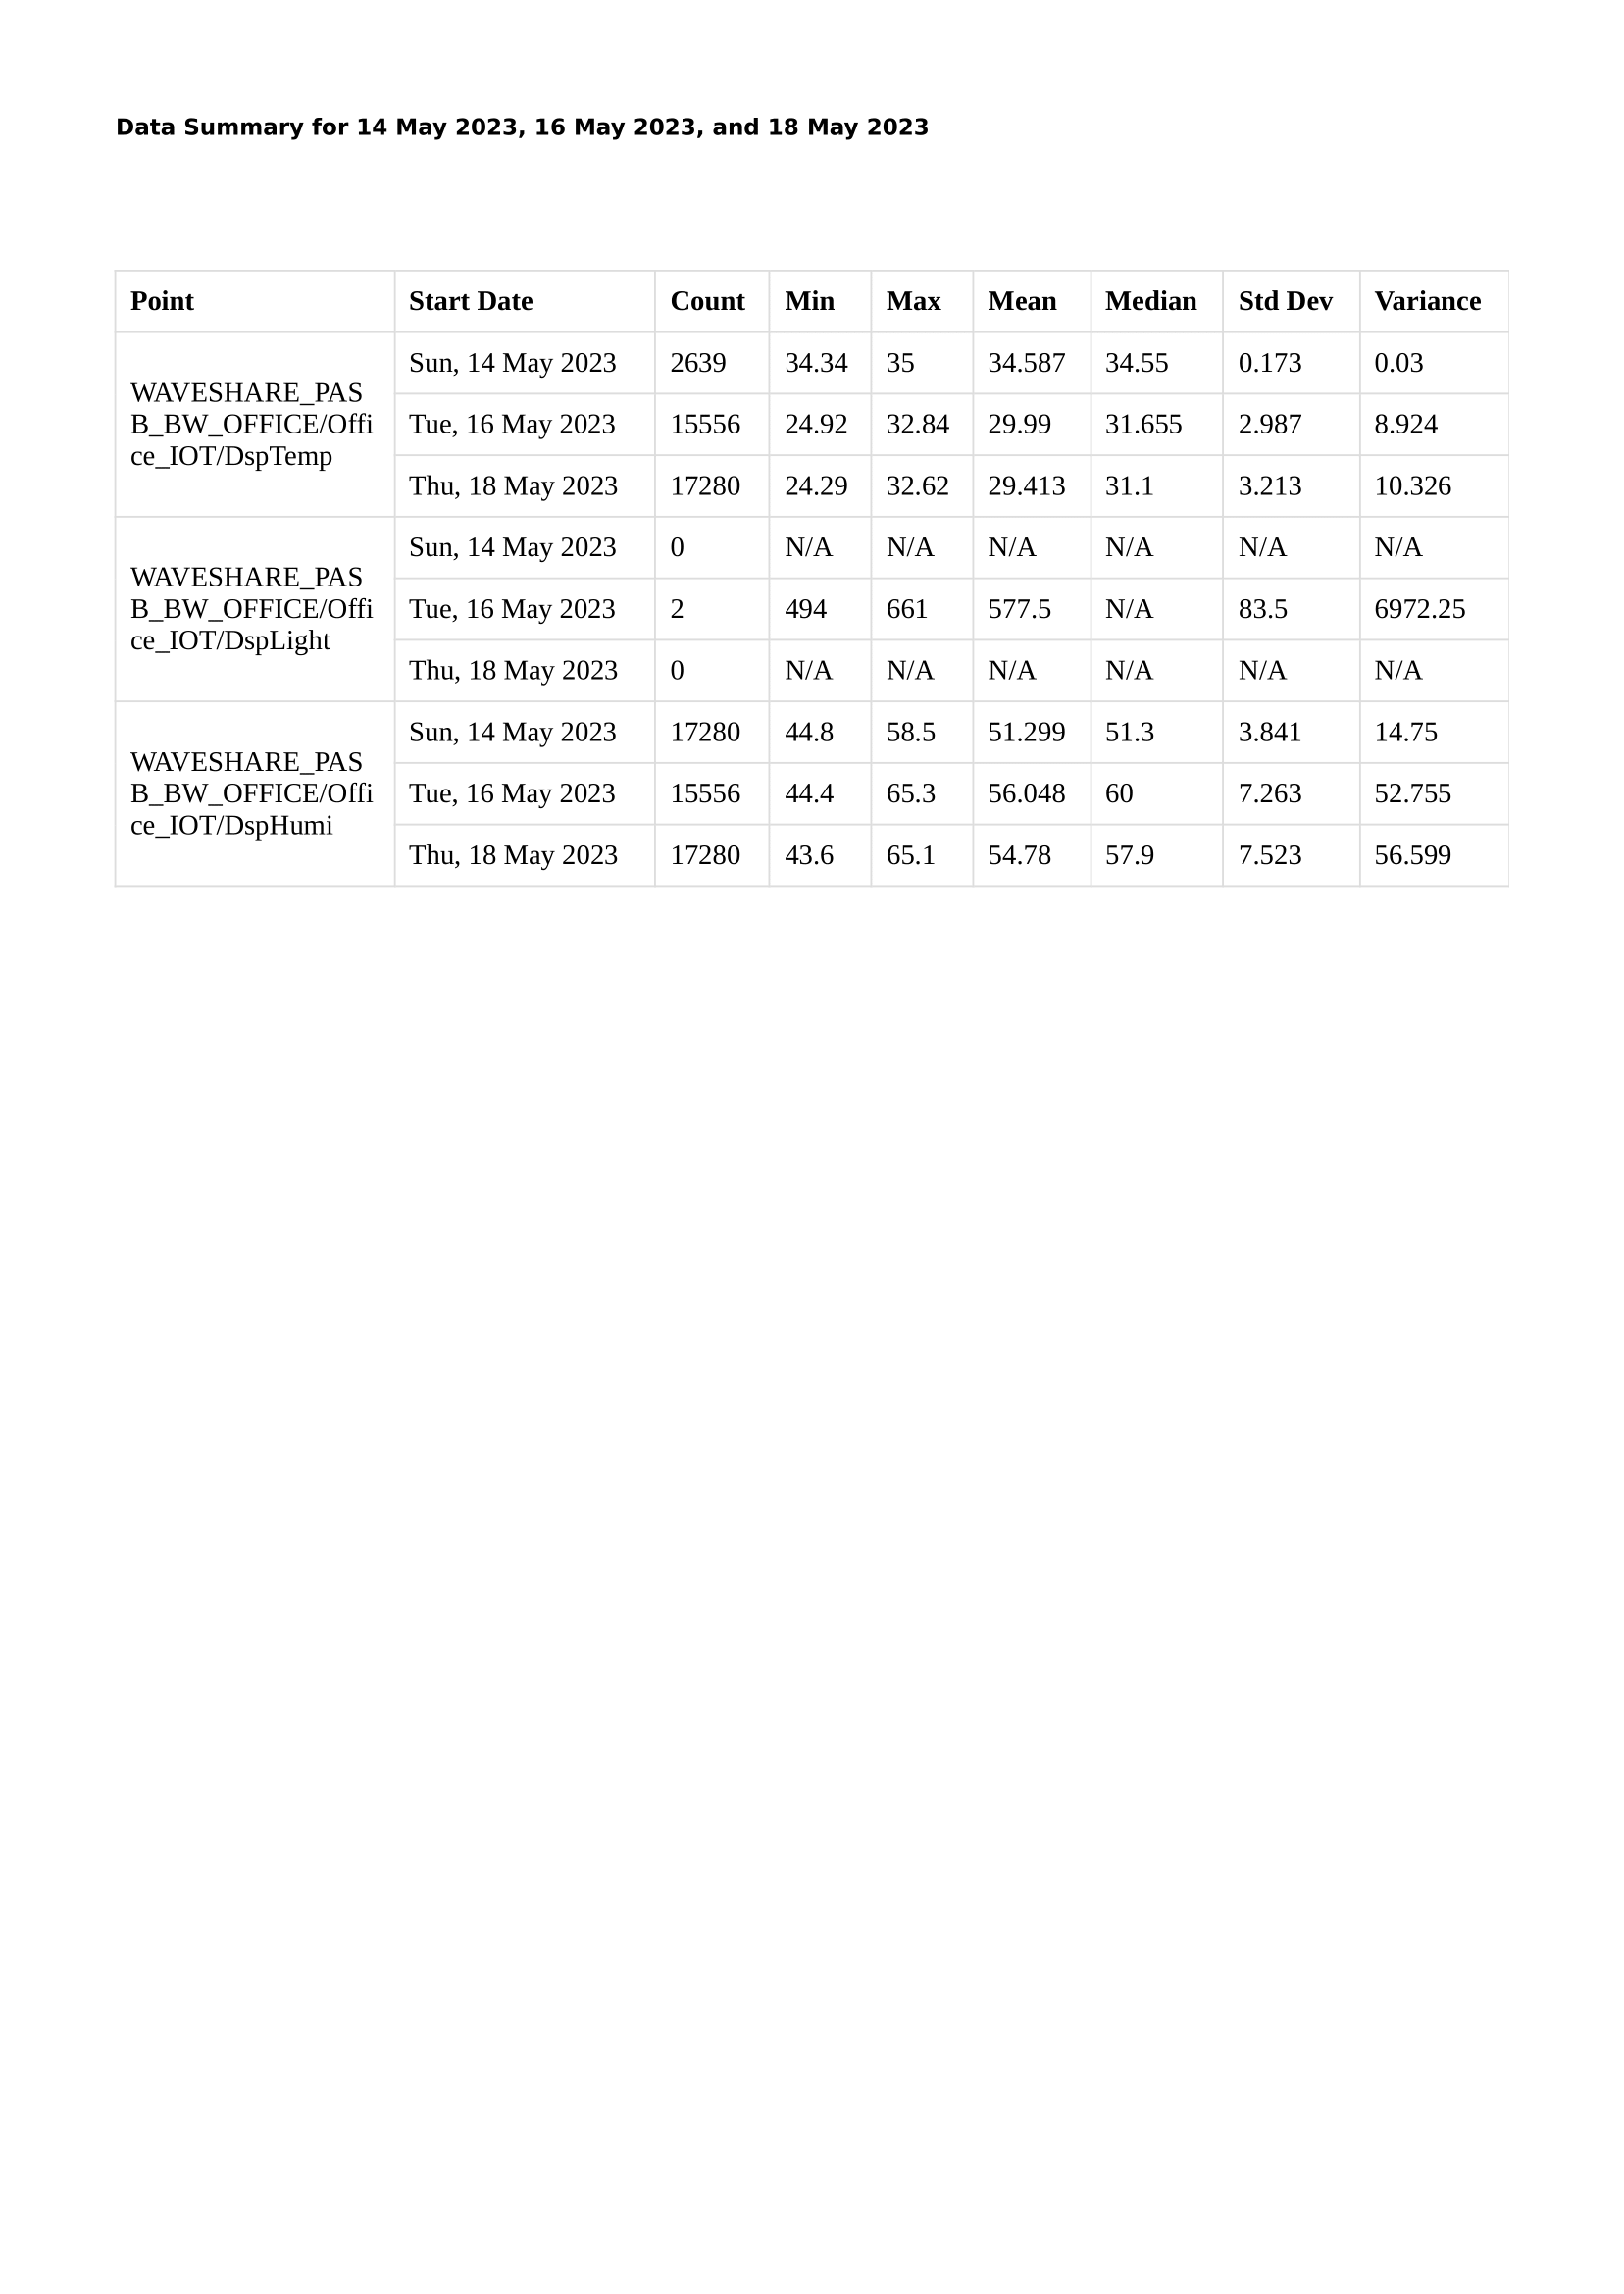
The PDF export displays the same statistical information in a structured and visually formatted table, making it suitable for reports, presentations, or documentation purposes.
A Controller in the Facility Management Controller (FMC) system represents a Facility Management Controller within a Workspace. When connected to a Workspace, the Facility Management Controller is treated as a Controller. The Controller contains all the necessary information to monitor and control the Equipment. Clients can remotely access and manage their equipment through the Controller using the Workspace in the Facility Management Cloud. This remote accessibility enhances convenience and efficiency in managing and maintaining the equipment from any location.
For a small physical location such as a tutorial room in a university, one controller may control multiple locations. Sometimes, one location can be controlled by multiple controllers. There are no hard-rules in setting up the controller/location assignment.
FMCC Cloud empowers Site Admins to effortlessly manage device configurations from the cloud. Any changes made in the cloud are automatically synchronised with the devices, ensuring seamless updates. To facilitate this process, devices must be connected to the internet, enabling FMCC Cloud to access and retrieve configurations for efficient management.

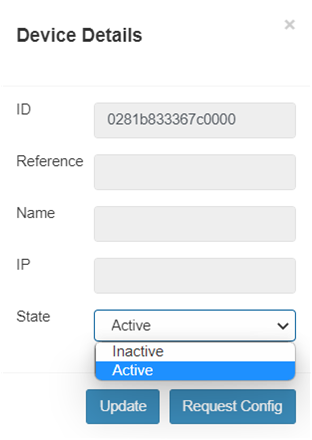

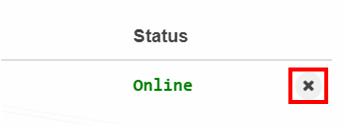
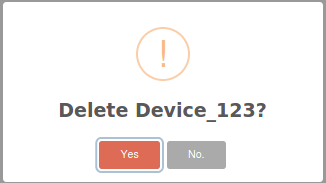
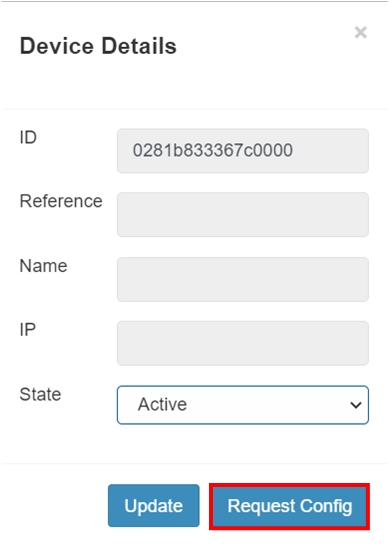
Firmware updates are essential for maintaining the performance, compatibility, and security of electronic devices, including those used in FMCC systems. In the context of FMCC, firmware updates play a crucial role in ensuring the proper functioning of devices like FMC controllers, IO points, and other components connected to the FMCC infrastructure. These updates may include bug fixes, feature enhancements, performance improvements, or security patches. By regularly updating the firmware, FMCC can provide users with the latest functionalities, address any known issues or vulnerabilities, and ensure seamless integration with other system components. Firmware updates in FMCC are typically performed through a controlled and centralised process to ensure compatibility, minimise disruptions, and maintain system stability.
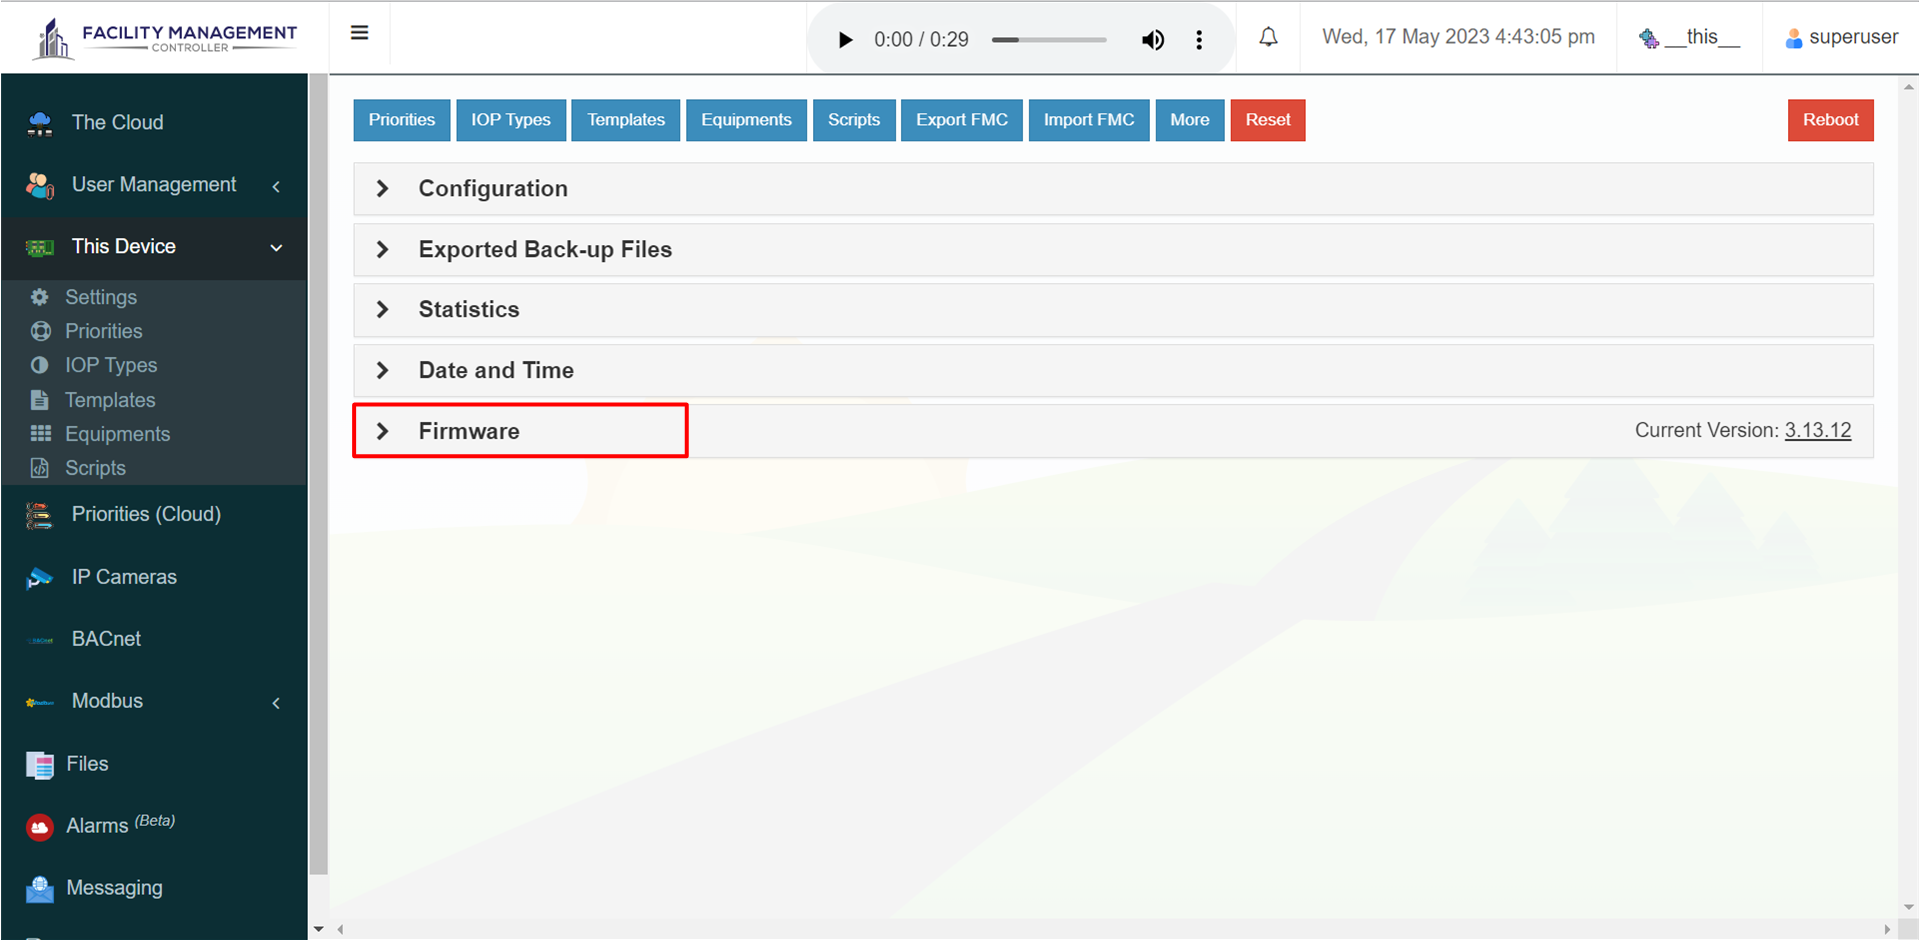
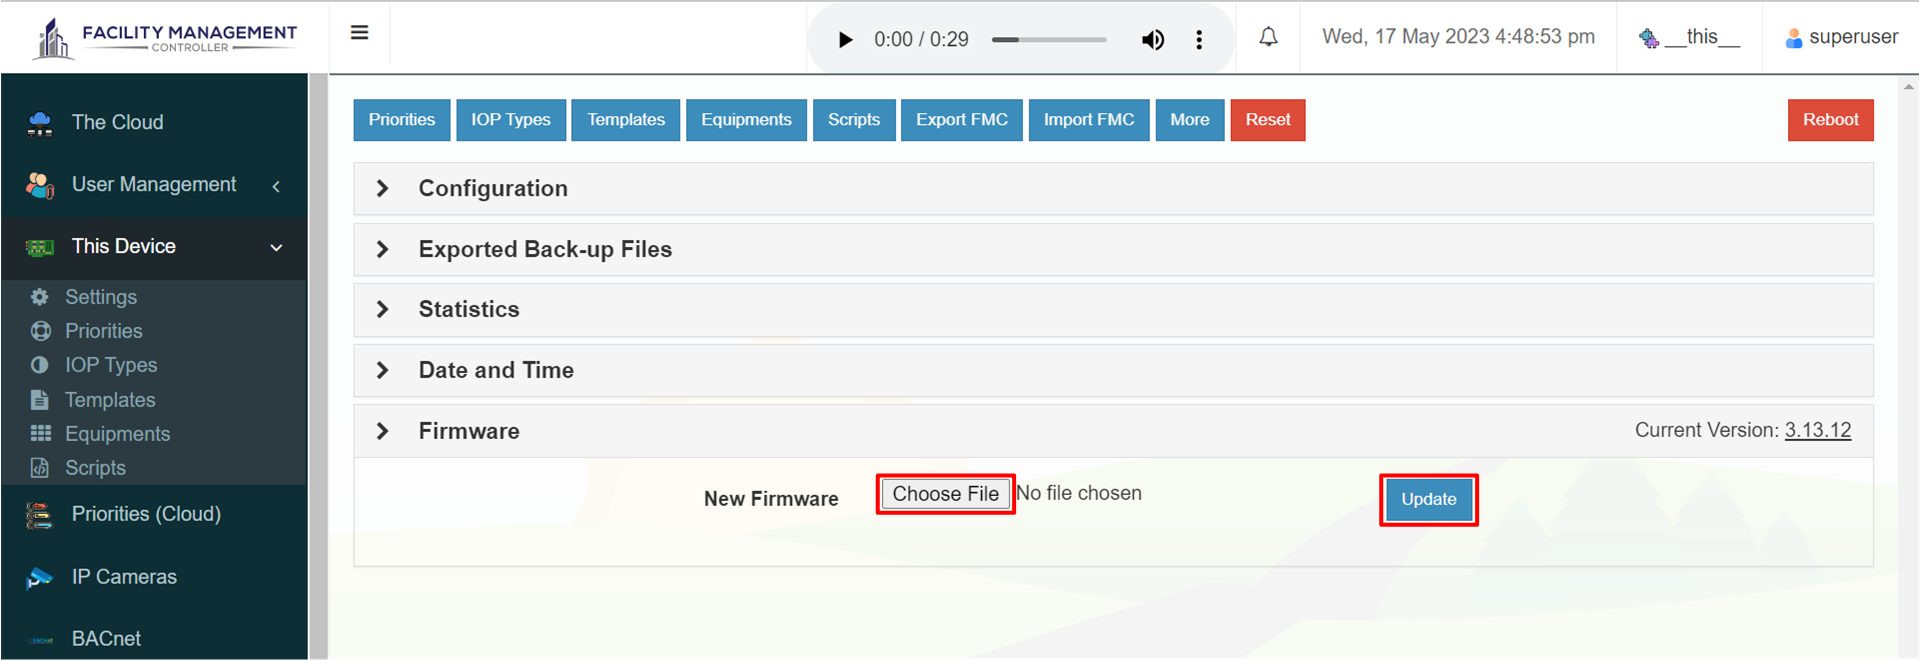
It is important to keep your firmware up to date to ensure optimal performance, security, and compatibility with other system components. Regularly checking for firmware updates and applying them when necessary helps to maintain the reliability and functionality of your FMCC system.
A Workspace in the Facility Management Controller (FMC) system is a cloud-based area where clients can manage all their FMCs in one place. It allows remote access and control of the FMCs installed at different sites. Each FMC is considered a Device within the Workspace, it is a physical controller, which consists of multiple Equipment. The Workspace provides a unified view and control over the Equipment at each site. Clients can monitor and control the equipment remotely, accessing real-time data and performing actions from a centralised interface. This simplifies facility management, improves operational control, and enables collaboration across multiple sites.
Examples of workspaces are:
Each workspace has multiple locations, which can be monitored under a single workspace for easy governance of facilities.
An IO Point (Input / Output Point) is a specific point of the Equipment in the Facility Management Controller (FMC) system. It represents the smallest subset in the FMCC architecture and has a unique name within the workspace. IO Points are associated with equipment and can only be accessed through their respective equipment. Each equipment can have one or more IO Points, each with a unique name. For Example, air conditioning unit could have a minimum of 4 IO Points, which includes Fan Speed, Temperature Set Point, Current Temperature, and Fan Mode.
IO Points serve as both input and output points:
A point type refers to a classification used in data monitoring or control systems to define the type of data being recorded, tracked or measured. It's essentially a category that helps the system know how to handle, store and interpret the data.
For Binary Points, one state can be selected to trigger the alarm. For Multistate Points, multiple states can be chosen to trigger alarms. However, for Analog Points, since they do not have discrete states, threshold logic is applied.
How Thershold Logic Function
If the measured temperature is not within the acceptance range(Low Limit to High Limit), the system will:
To investigate the causes of any alarm, you can review the alarm history for detailed information.
Binary I/O points handle two-state signals, typically represented as ON/OFF, TRUE/FALSE, or 0/1. They are among the most basic and commonly used data points in control and monitoring systems, forming the foundation of digital automation.
Binary I/O points are widely used in simple automation and monitoring tasks, including:s
Multistate I/O points handle signals with more than two discrete states, allowing devices or systems to operate in multiple modes. Unlike binary I/O, which only distinguishes between two conditions (ON/OFF), multistate points can represent several distinct conditions or control options.
Multistate I/O points are commonly applied in scenarios that require
multiple operational states
, including:Analog I/O points manage continuous signals that represent variable data, such as voltage, current, or resistance. Unlike binary or multistate signals, which handle discrete states, analog points can express a full range of values, making them essential for precise measurement and control.
Analog I/O points are widely used in applications where fine-grained measurement or control is required, such as:
An accumulative point type is a category of data point used in systems that need to track values that increase continuously over time. This type of point is commonly used in systems like meters, counters, and trackers that monitor ongoing processes or measurements where the total value builds up, such as total energy consumption, total water usage, or total items produced.
Members of the Accumulative Point Type:
There are two fields: raw value before and raw value after. In the first scenario, when users create a point with this point type, they need to enter the initial value in the "raw value after" field and leave the "raw value before" field as 0. In the second scenario, when users replace a meter, they can enter the last known reading in the "raw value before" field and the new reading from the new meter in the "raw value after" field.
Note:
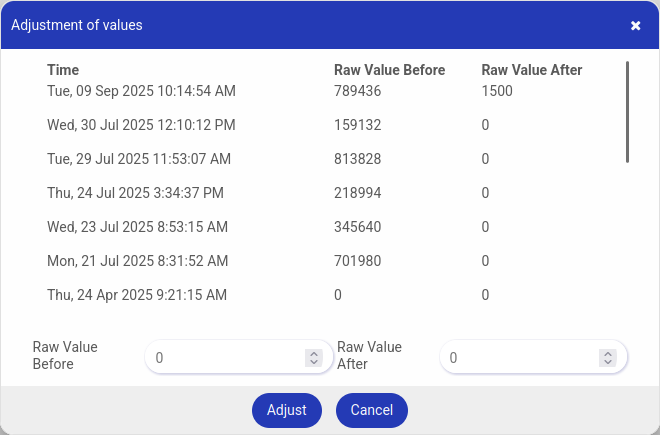
Go to Equiments -> IO Points -> Adjustment
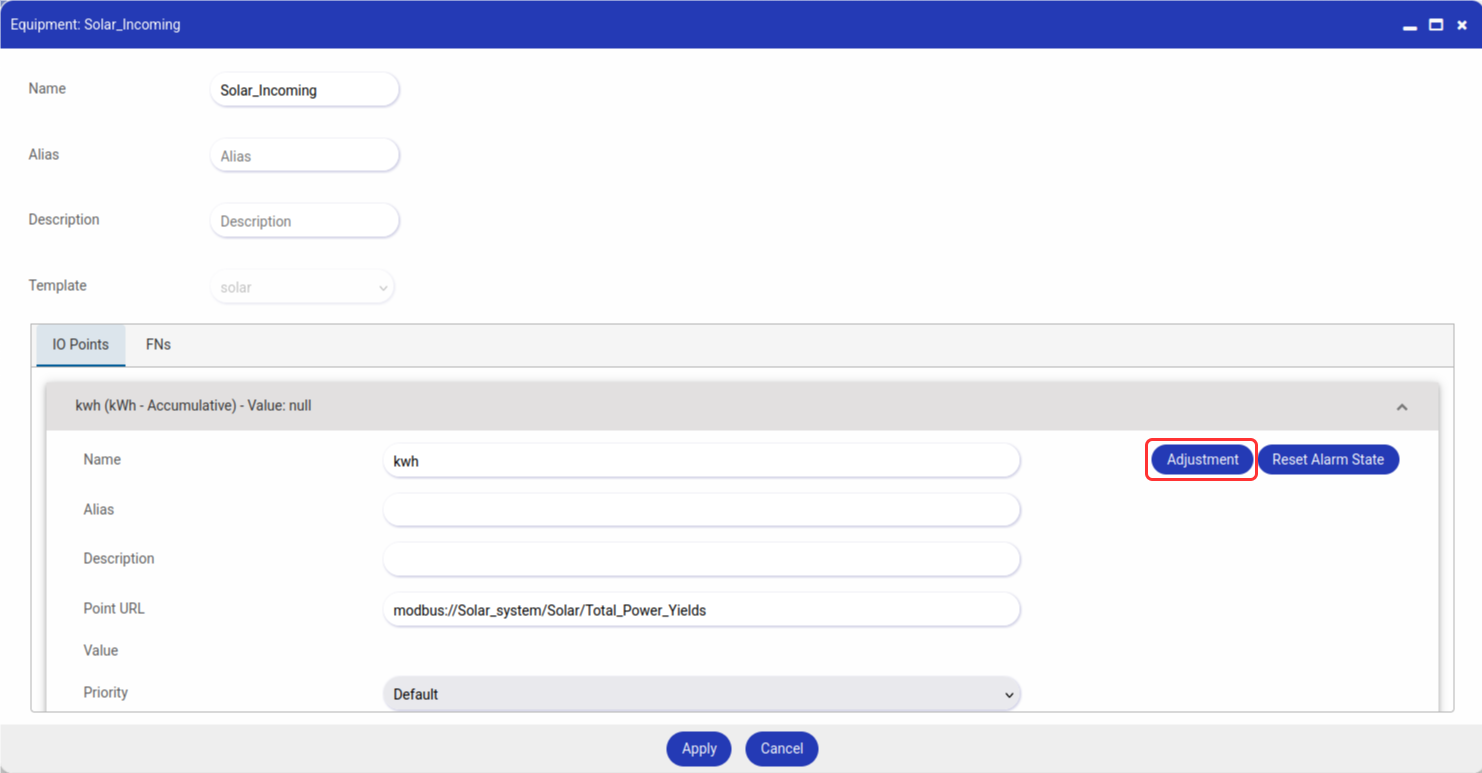
The calculation of the total raw value to be recorded in the log data after adjustment will be:
( Raw Value Before - Last Raw Record in Old Meter ) + ( New Raw Record in new meter - Raw Value After )
Equipment in the Facility Management Controller (FMC) system includes a wide range of physical devices used to manage and control facility operations. This can include HVAC systems, lighting fixtures, security systems, pumps, and motors. Each equipment is associated with one or more I/O Points (IOPs), which serve as interfaces for controlling and monitoring the equipment's functionalities.
Example of equipment includes Lights, Aircon, Fan, AC Points, Door Access, Smoke Detector, Power Meter, etc.
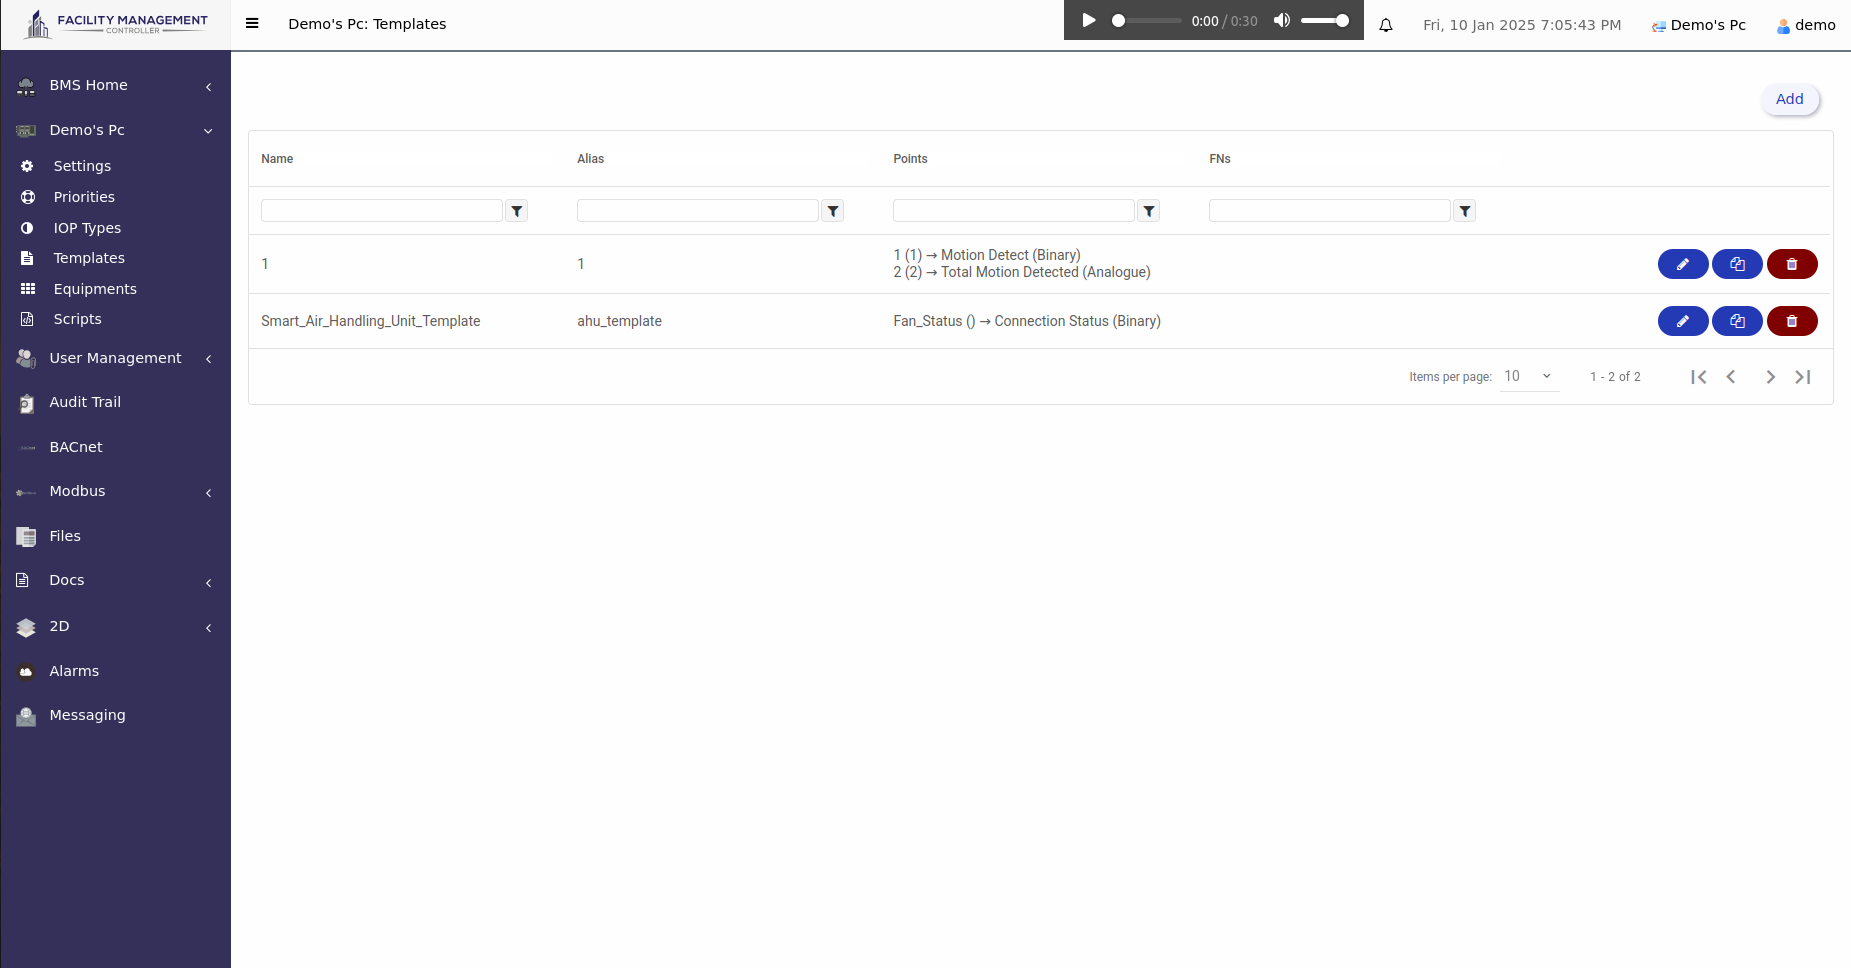
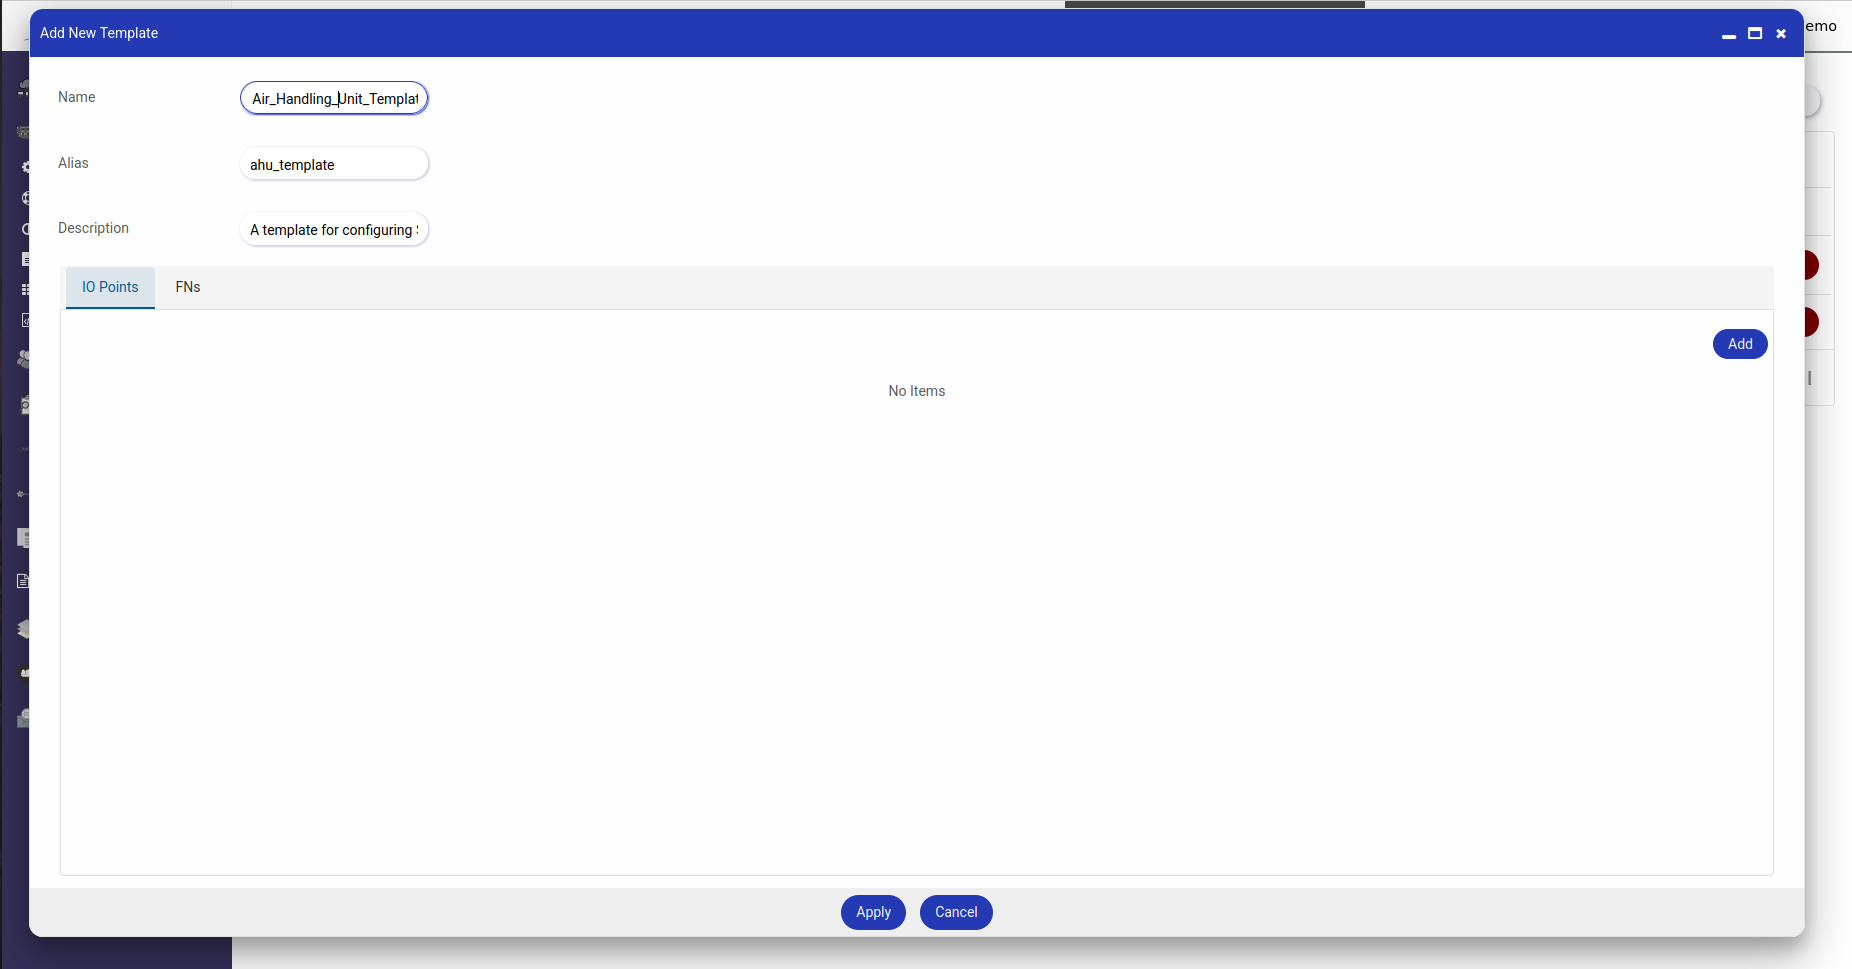
An equipment template serves as a blueprint that allows users to duplicate multiple pieces of equipment at once. The main purpose of an equipment template is to simplify the process of creating standardized configurations. For example, in a workspace like an office, a Smart Air Handling Unit (AHU) may have points such as fan speed, fan status, and more. By using this equipment template, users only need to define all the points within the template and then apply it to the equipment section.
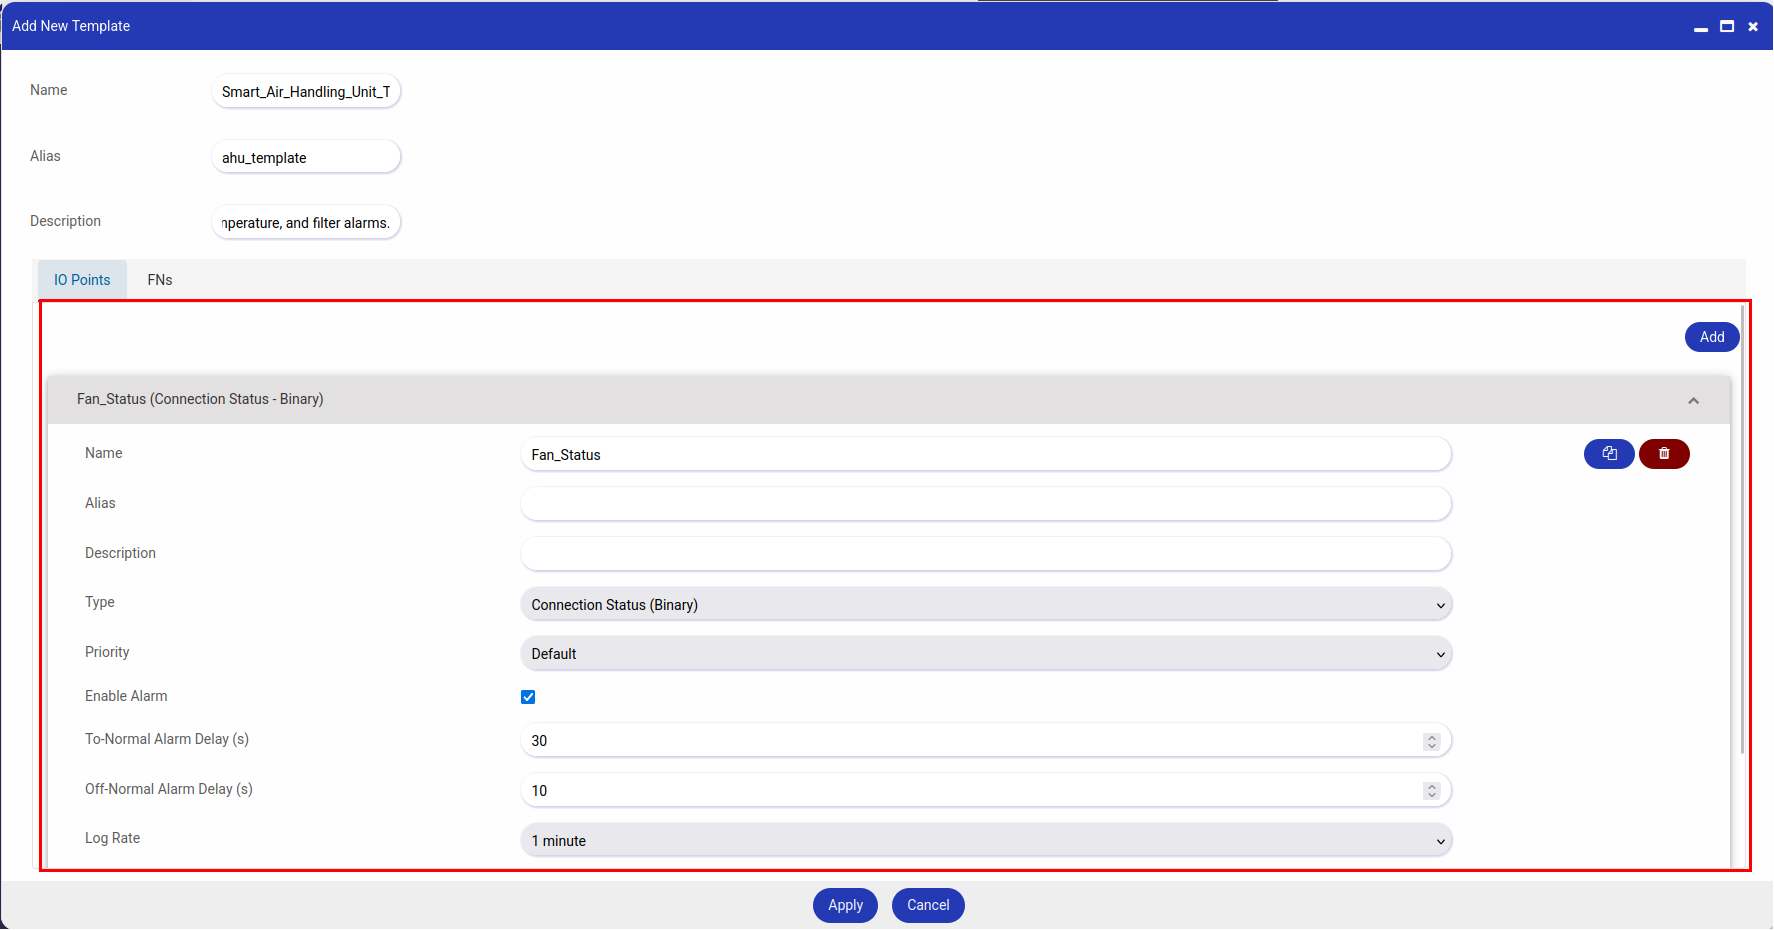
| Parameter | Description |
|---|---|
| Name | A label for the point or configuration, used for easy identification. |
| Alias | A unique system-friendly identifier for the point, often used in scripts or APIs. |
| Description | Provides details about the point's purpose or functionality for better context. |
| Type | Defines the point type, such as Binary, Analog, or Multistate that you have defined from the Point Type section. |
| Priority | Specifies the importance level of the point in the system, start from 0, higher the value, lower the priority. |
| Notify on State Transition | A setting that enables or disables alarms for the point. |
| To-Normal Alarm Delay (s) | The system ensures that the point remains in its normal state for the specified duration (in seconds). Once the point stays in the normal state for the given time, the alarm will be cleared. |
| Off-Normal Alarm Delay (s) | The system ensures that the point remains in the abnormal state for the specified duration (in seconds) before triggering the alarm. This delay helps avoid false alarms due to temporary fluctuations. |
| Log Rate | The frequency (in seconds) at which the point's data is recorded for logs. |
| On-Read Script | A script executed whenever the point's value is read, often used for data transformation or validation. |
| On-Write Script | A script executed whenever a new value is written to the point, ensuring data integrity or triggering actions. |
Click IO Point ID.

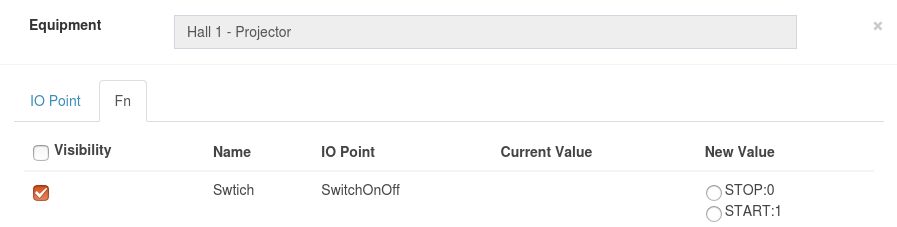
Visibility of the IO Point.
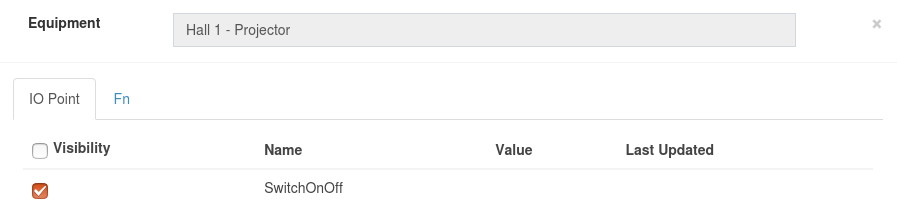
Current state of IO Point (OnOff / Speed / Brightness etc).
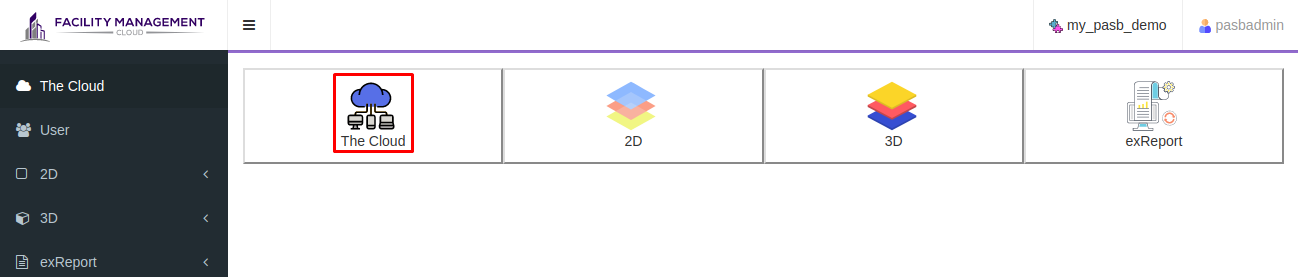
Visit https://fmcc.io. Login as admin and click “The Cloud”.
Click device ID to show IO Points.
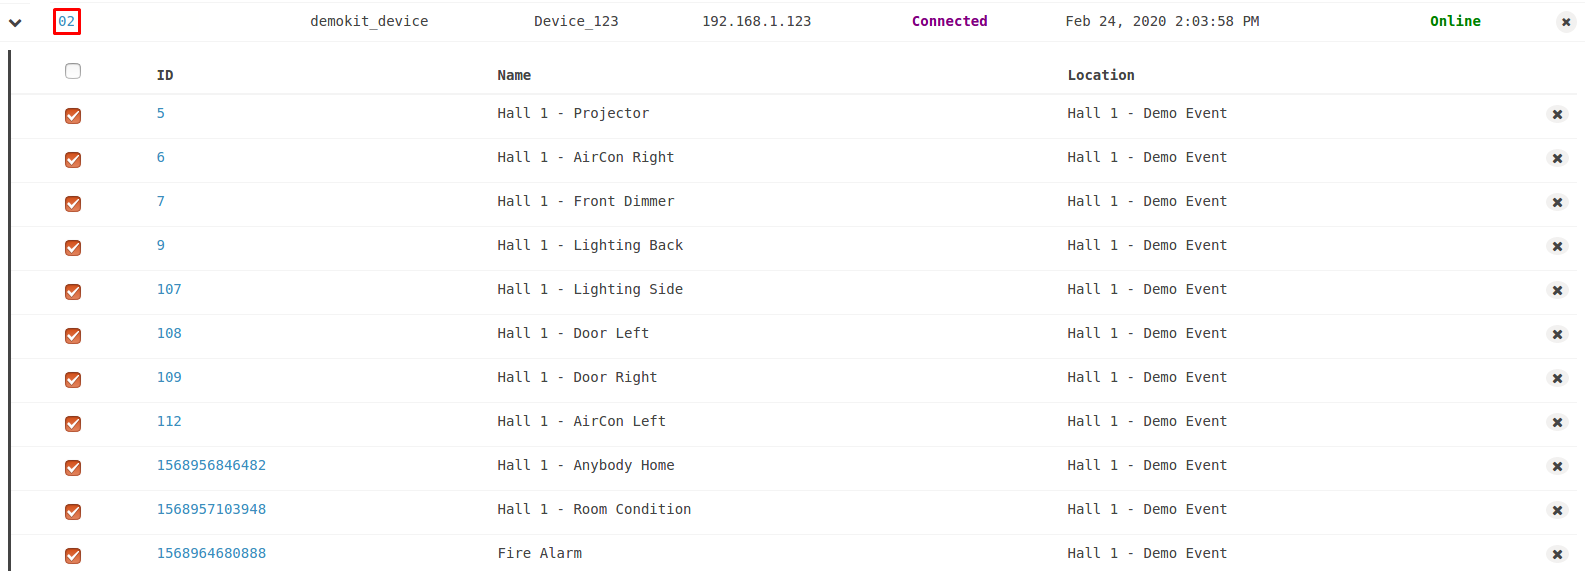
Select checkbox to make IO Point visible in mobile application.

Deselect checkbox to make IO Point invisible in mobile application.

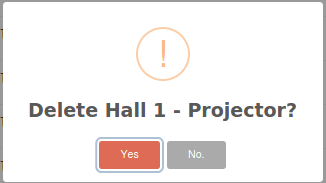
To delete an IO Point, click 'X' button.

Click "Yes" and the IO Point will be deleted.
In the Facility Management Controller (FMC) system, a Location represents a specific physical area within a facility where IO Points (Input/Output Points) are linked to Equipment. The Equipment is associated with a particular Location. IO Points function as interfaces for controlling and monitoring the equipment and systems within that area. The quantity of control devices varies based on the size and complexity of the Location. This arrangement facilitates effective management and control of the facility's equipment and systems.
Click "The Cloud".
Click "Locations".
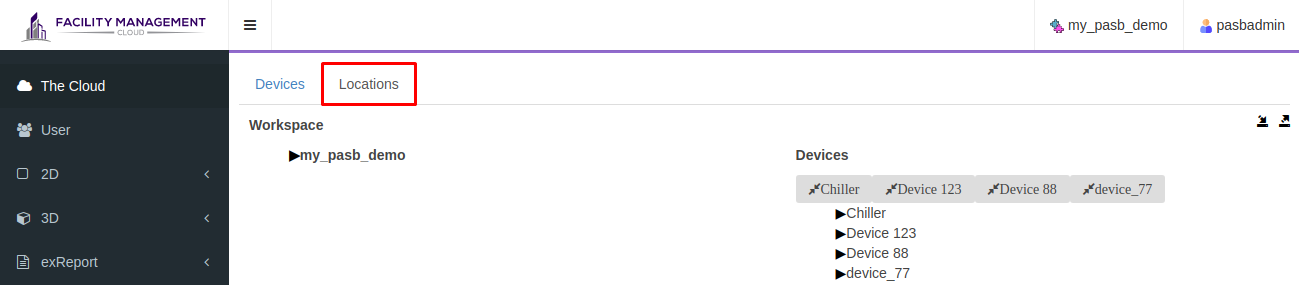
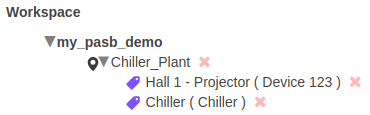
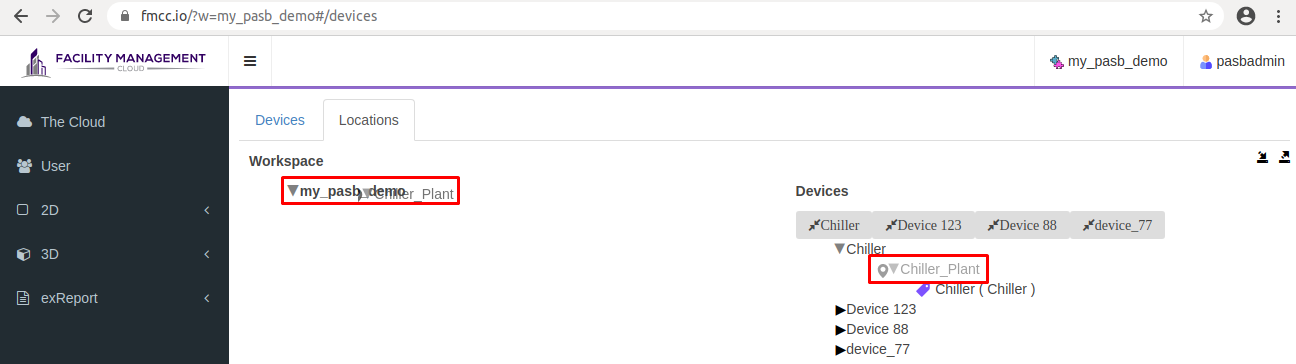
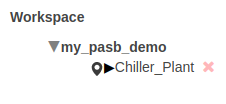
Workspace name:
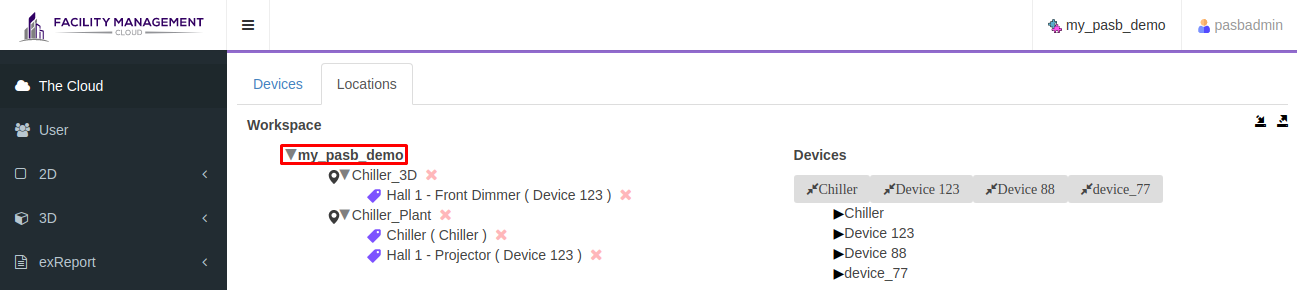
Locations name:
Equipments name:
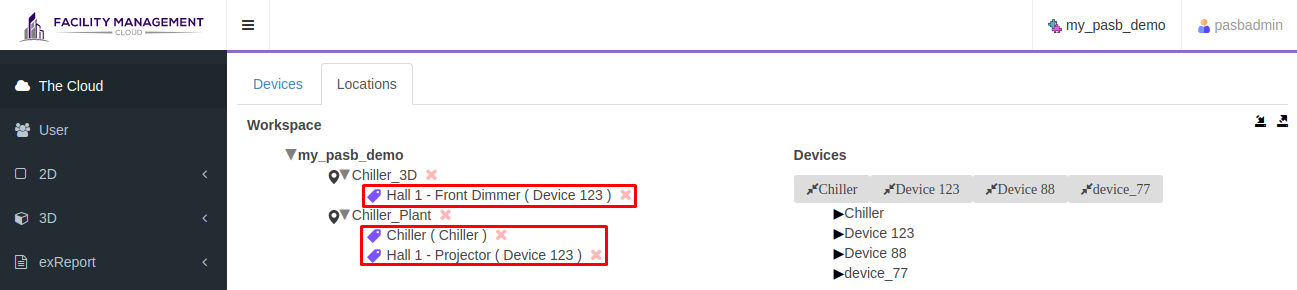
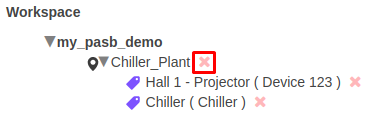
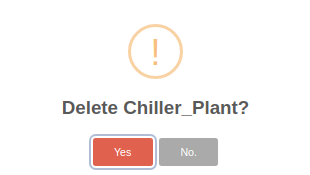
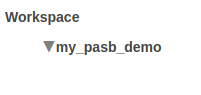
Chiller device control Chiller equipment in Chiller_Plant location.
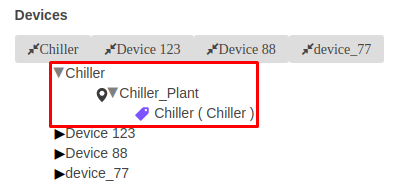
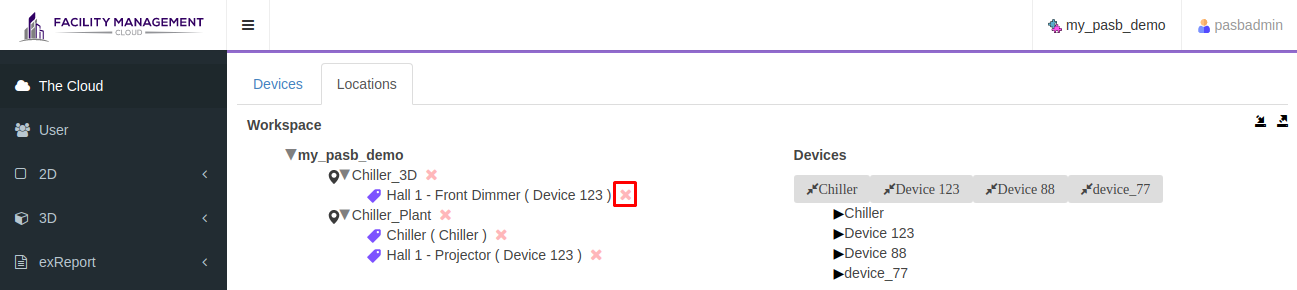
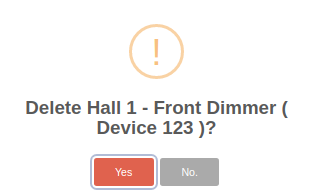
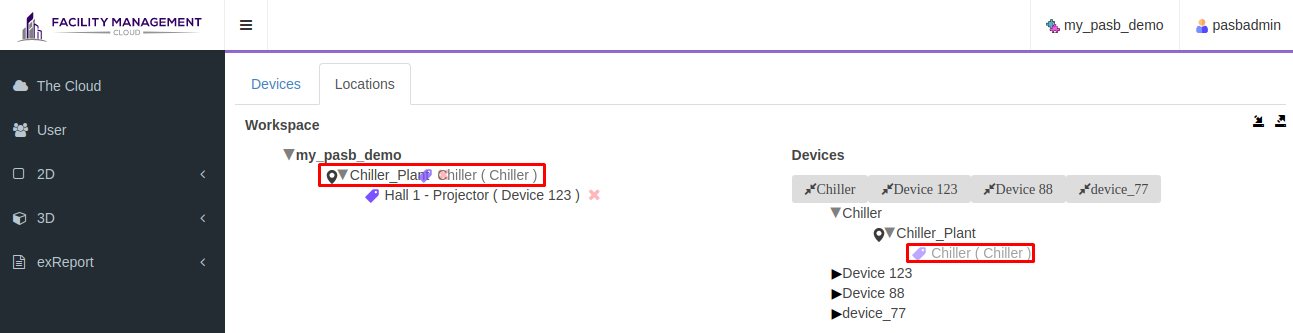
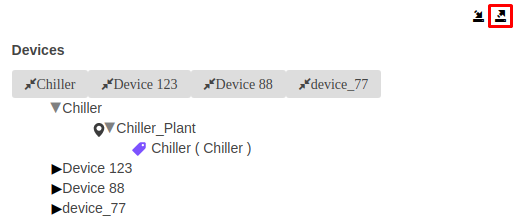
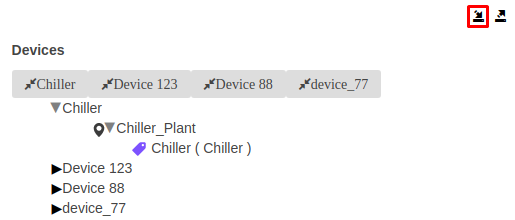
User can export current tree to JSON file as a backup.
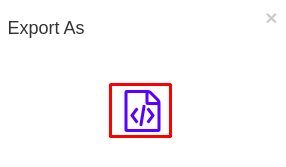
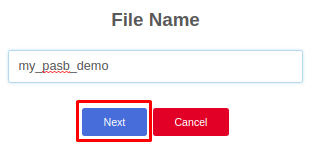

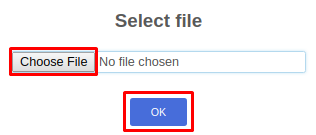
User can import tree from JSON file.
The Messaging module in our system is a powerful tool that enables users to send notifications and messages through various platforms. It offers flexibility by supporting multiple communication channels like Email, SMS, and other messaging platforms. The module is designed to send notifications when alarms are triggered, allowing users to receive immediate alerts. This helps optimise facility performance and ensures a comfortable and safe environment for occupants. With the Messaging module, users can stay informed and take prompt action to address any issues or alarms that arise.
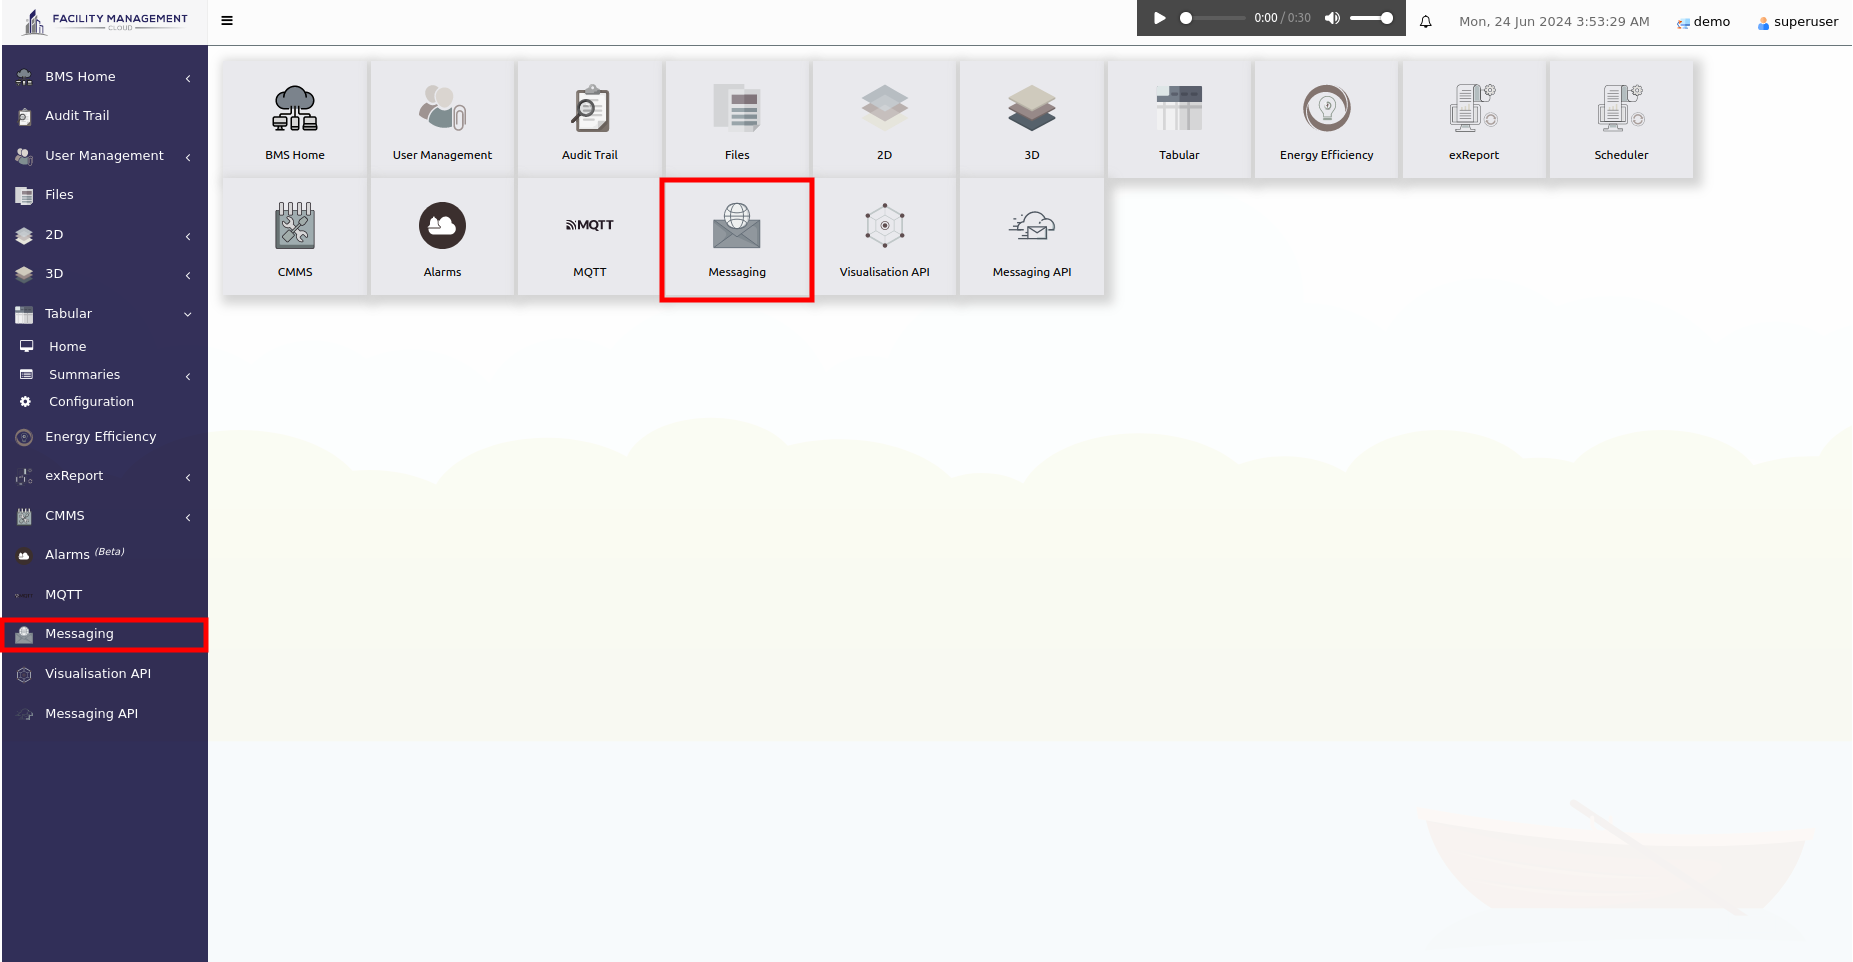
Once the Messaging module is activated, users will find the Messaging button conveniently located in the left sidebar and the main dashboard, providing easy access to send and manage messages. This feature enhances communication and ensures that important information reaches users effectively.

Send On Normal
After finish editing, click on “Save” button to apply to changes.
Recipients are the users or groups that have been registered to receive messages from the system. They are individuals or predefined groups who are designated to receive notifications, alerts, or messages generated by the system. By including recipients in the messaging system, the system can effectively deliver messages to the intended recipients based on their specific roles or preferences. This ensures that important information reaches the appropriate individuals or groups in a timely manner, facilitating effective communication and collaboration within the workspace.
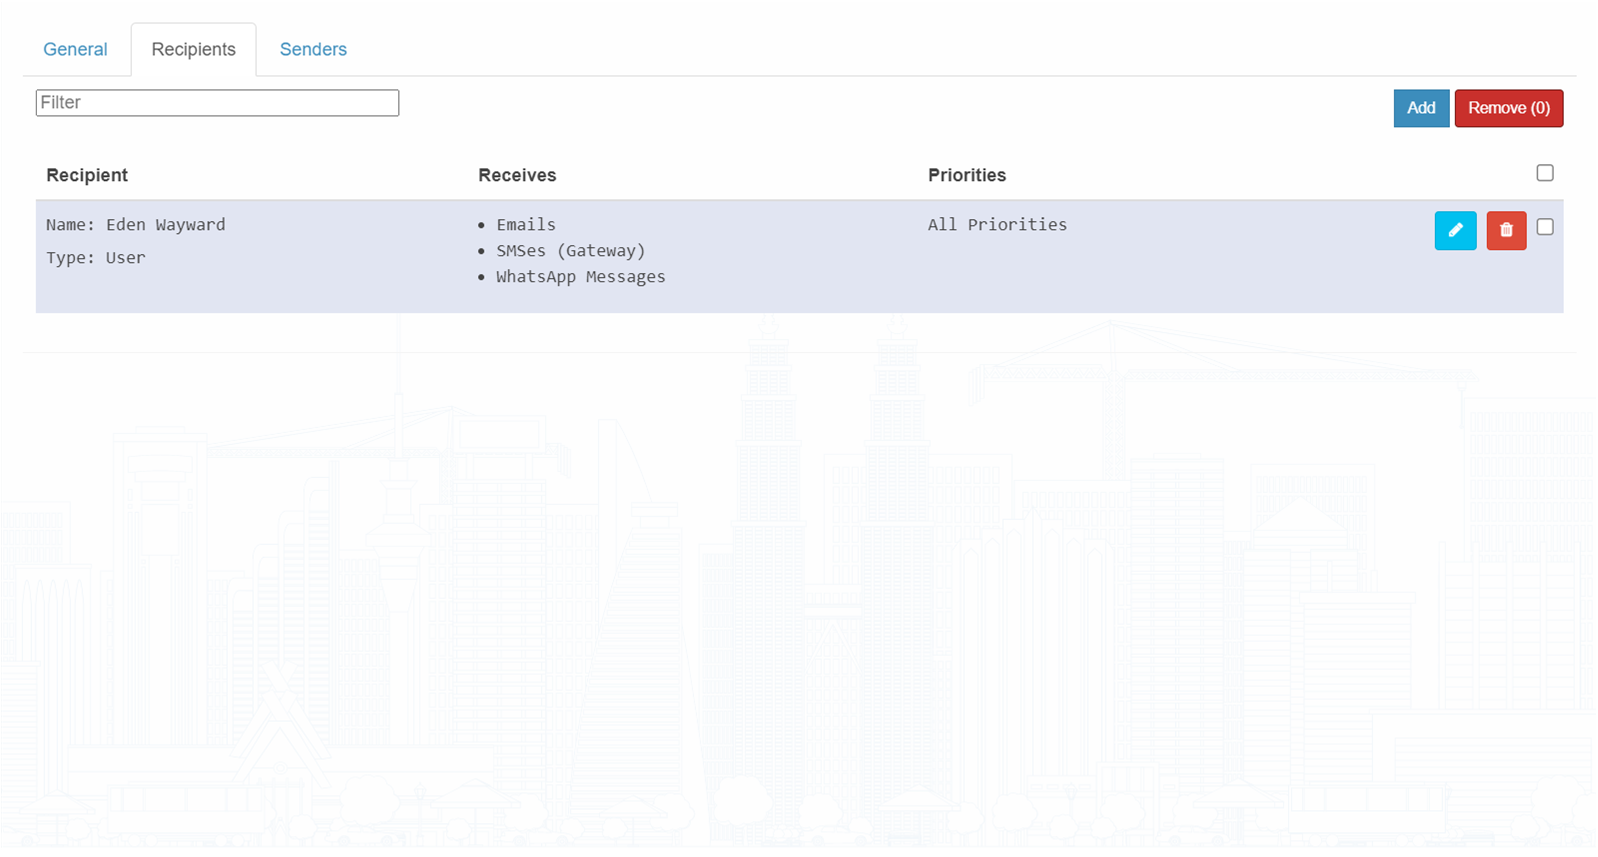
In the "Recipient" tab, click on the "Add" button at the top right, and a window will pop up as shown as image below.
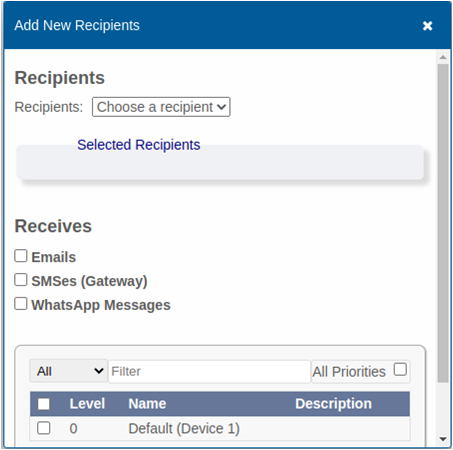
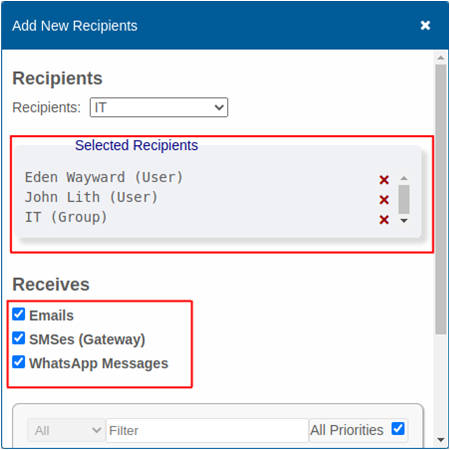
To select a user or group as a recipient, simply choose the desired recipient's name from the available options. Once selected, the name will appear and be added to the "Selected Recipients" box. If you need to add additional recipients, you can continue selecting names from the "Recipients" list, and they will be automatically added to the "Selected Recipients" box.
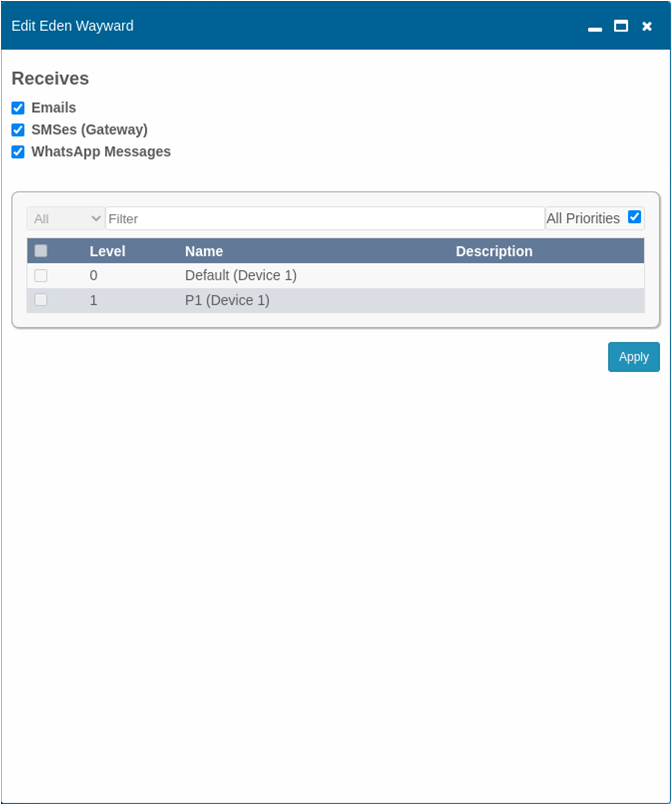
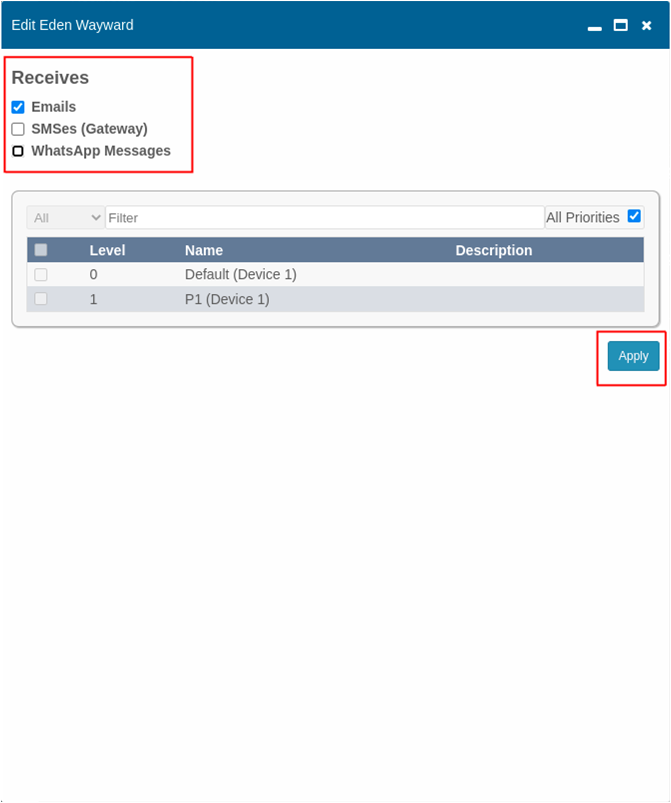
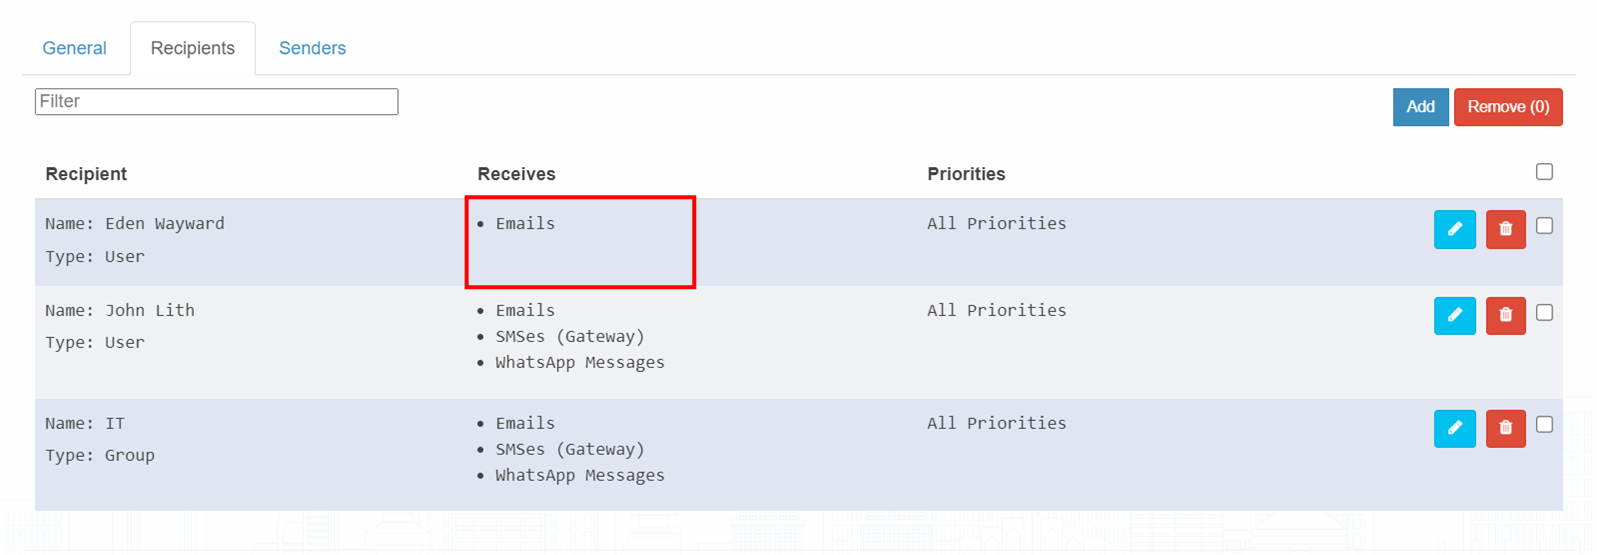
Furthermore , the "Receives" feature allows users to determine which types of communication platform that allow recipients receive the messages. You have the flexibility to specify whether they can receive messages from sources such as Emails, SMSes (Gateway), and WhatsApp Messages. By configuring the "Receives" settings, you can control the communication channels through which the selected recipients will receive messages, ensuring that they receive notifications through their preferred methods of communication.
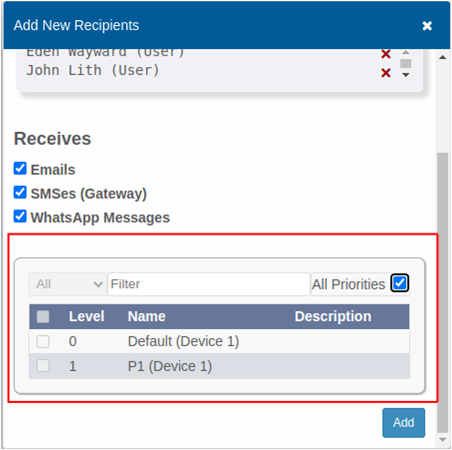
In the messaging system, users have the flexibility to choose the priority levels of the messages that recipients can receive. This allows you to determine the importance or urgency of the messages for different recipients. By selecting the appropriate priority levels, users can ensure that critical messages are received and addressed promptly, while less urgent messages can be prioritised accordingly.
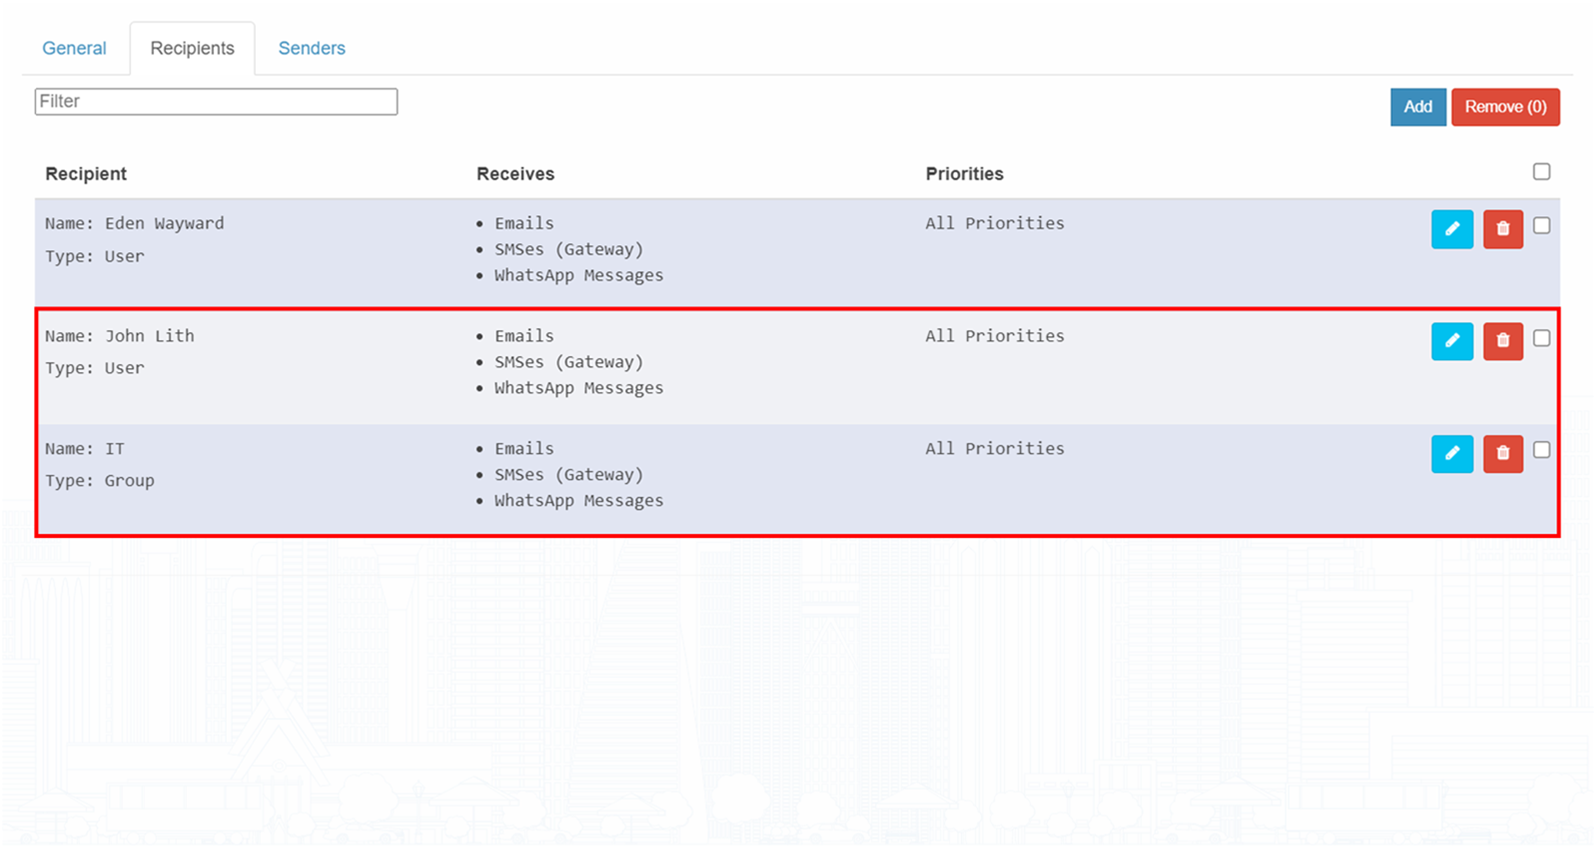
The newly added recipients will then be displayed in the table, providing a clear overview of the recipients that have been included. This table serves as a reference, allowing you to easily review and manage the recipients you have added. By having a comprehensive list of recipients, you can ensure that the right individuals or groups receive the messages they need in a timely manner.
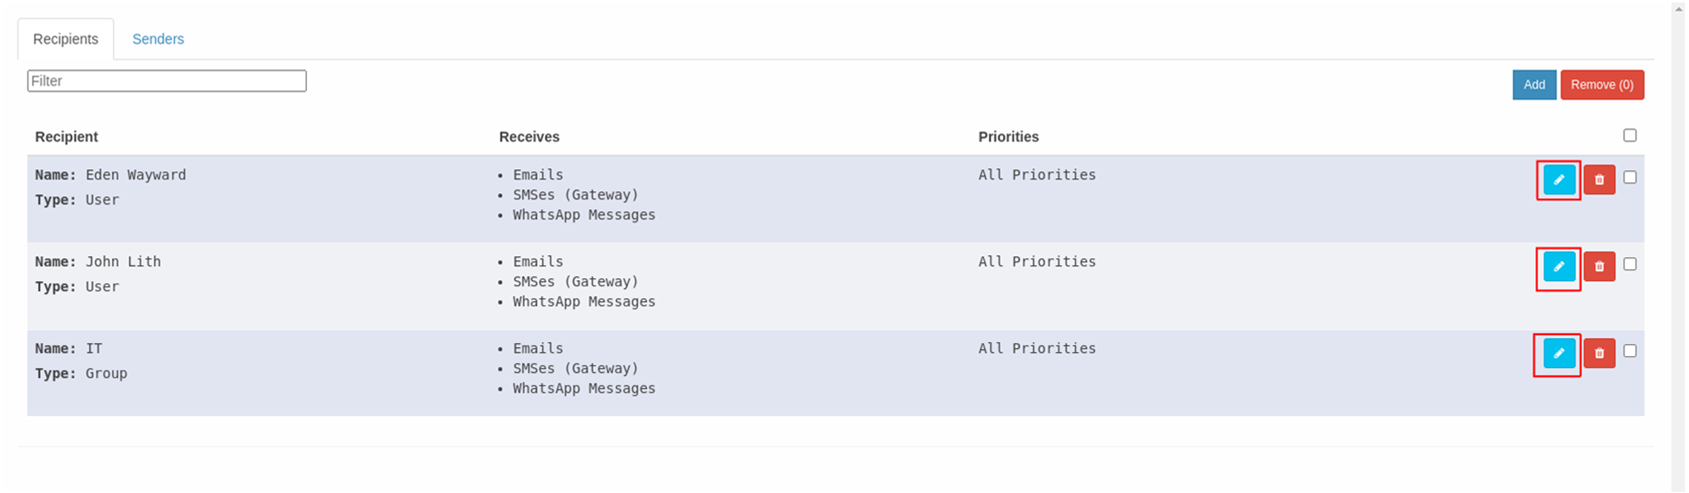
Clicking the buttons with a pencil icon at the right side will allow you to edit the recipient's configuration.
Users can change the type of sender to a specific user to receive and adjust the priority level of the device for that user.
After finishing editing, click the "Apply" button to update the changes.
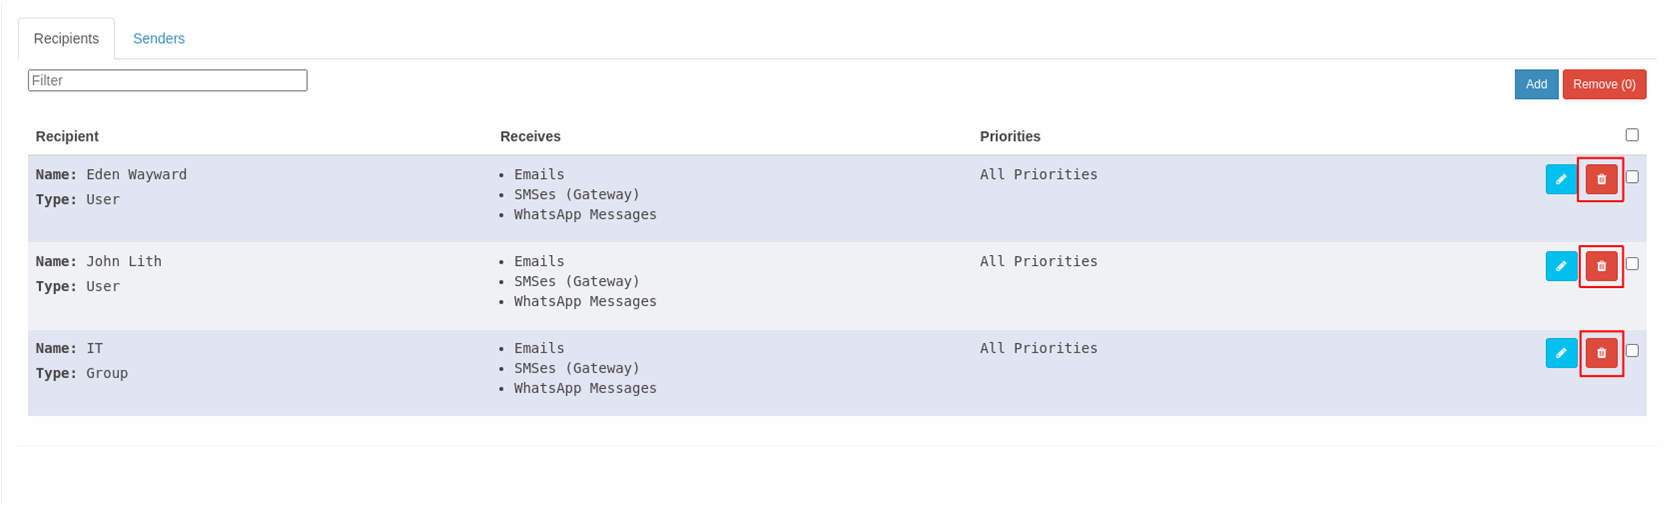
To remove a recipient from the list, locate the recipient entry in the table and click on the delete button located at the rightmost side of the entry. This will remove the recipient from the list, ensuring that they no longer receive messages or notifications from the system.
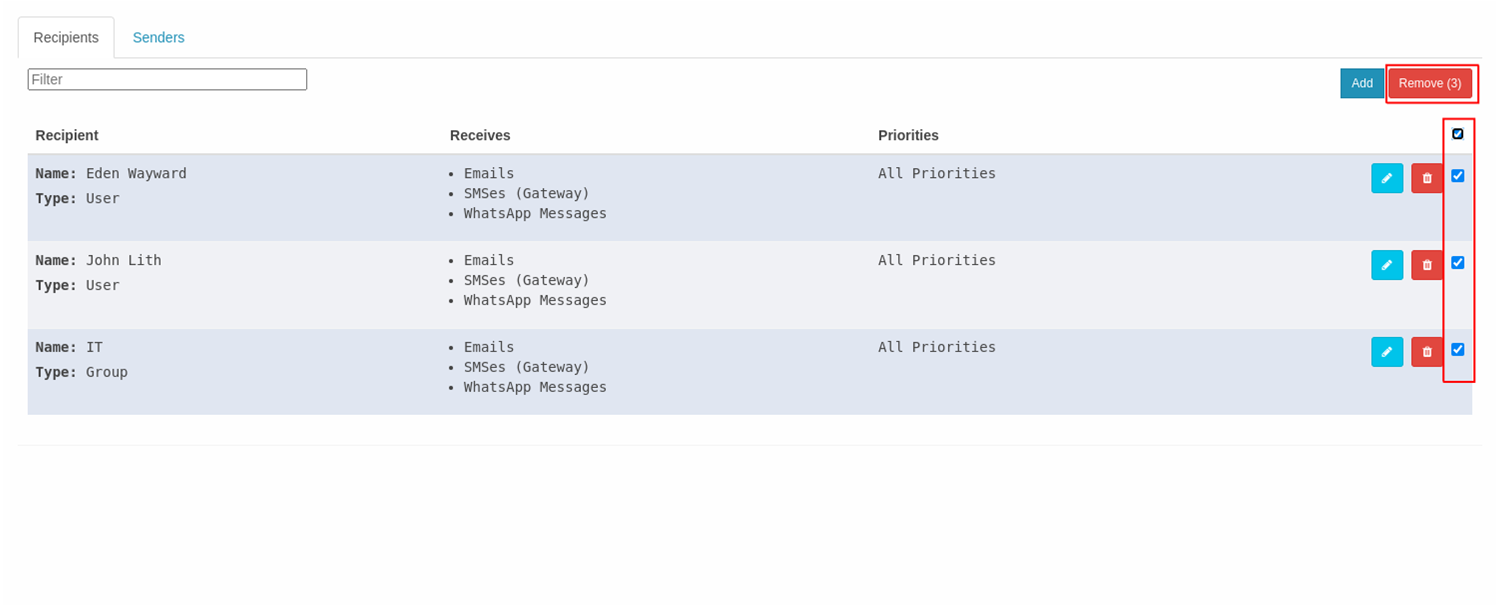
You can remove multiple recipients by checking the check-boxes at the rightmost of the table and click on the “Remove” button at the top right just beside the “Add” button. The number beside the “Remove” button is the number of selected recipients.
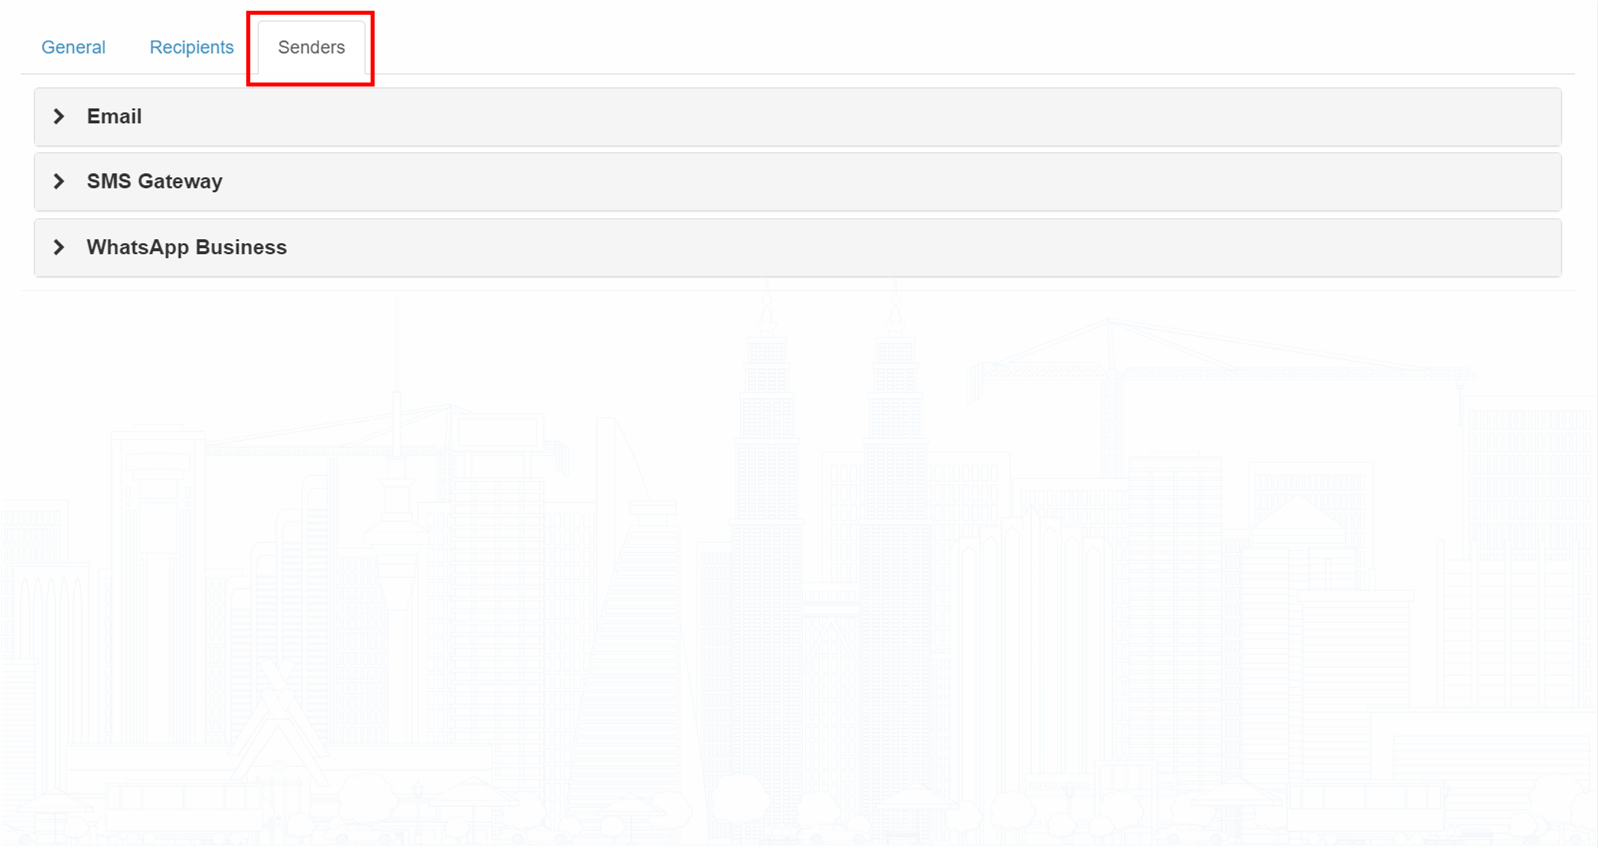
In the Senders page, users have the ability to select the communication platforms through which notifications will be sent to recipients. This provides users with the flexibility to choose their preferred methods of receiving messages. It's important to note that there are differences in the available platforms between the Controller and Cloud. The table below illustrates the communication platforms available for both the Controller and Cloud:
| Platform | Controller | Cloud |
|---|---|---|
| Emails | Yes | Yes |
| SMS Gateway | No | Yes |
| No | Yes | |
| SMS Modem | Yes | No |
Users can make their selections based on their preferences and requirements, taking into account the available platforms in each environment. This ensures that notifications are delivered through the desired channels, whether it's via email, WhatsApp, SMS Gateway or SMS Modem, providing a seamless and personalised messaging experience.
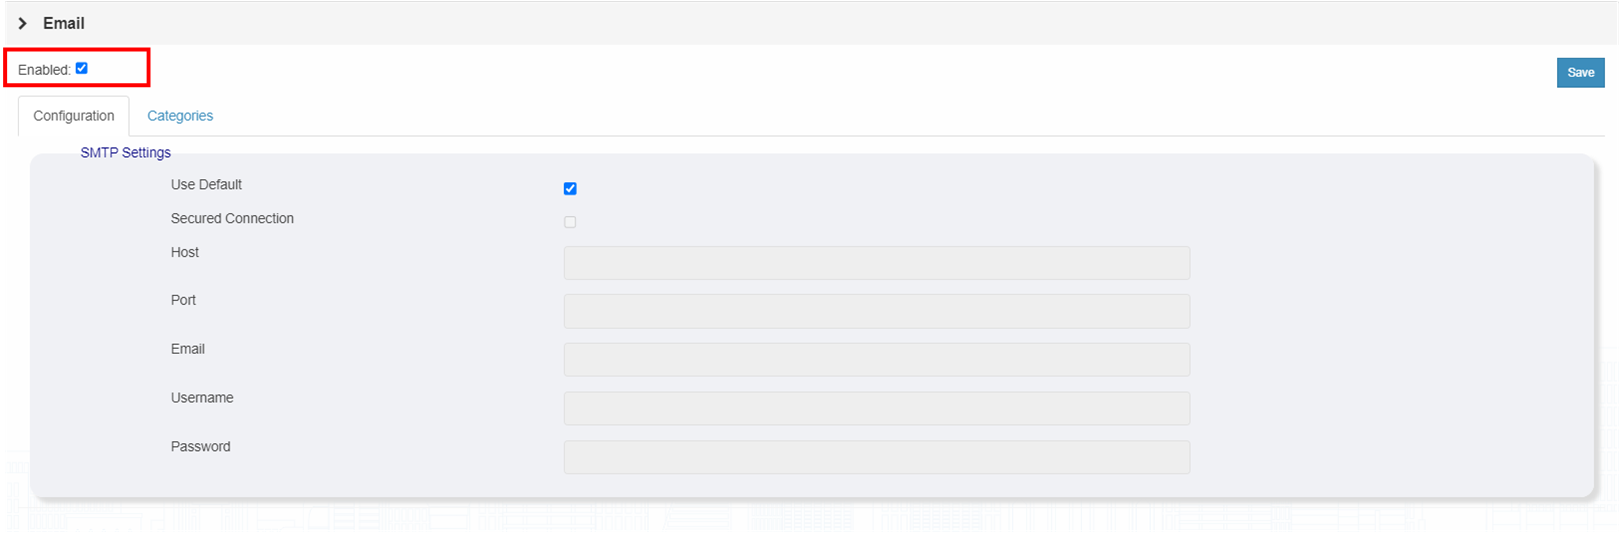
To enable the system to send messages through email, make sure to check the "Enabled" option. By selecting this option, you grant permission for the system to use the email platform as a means of communication. This ensures that recipients can receive messages via email and stay informed about important updates and notifications.
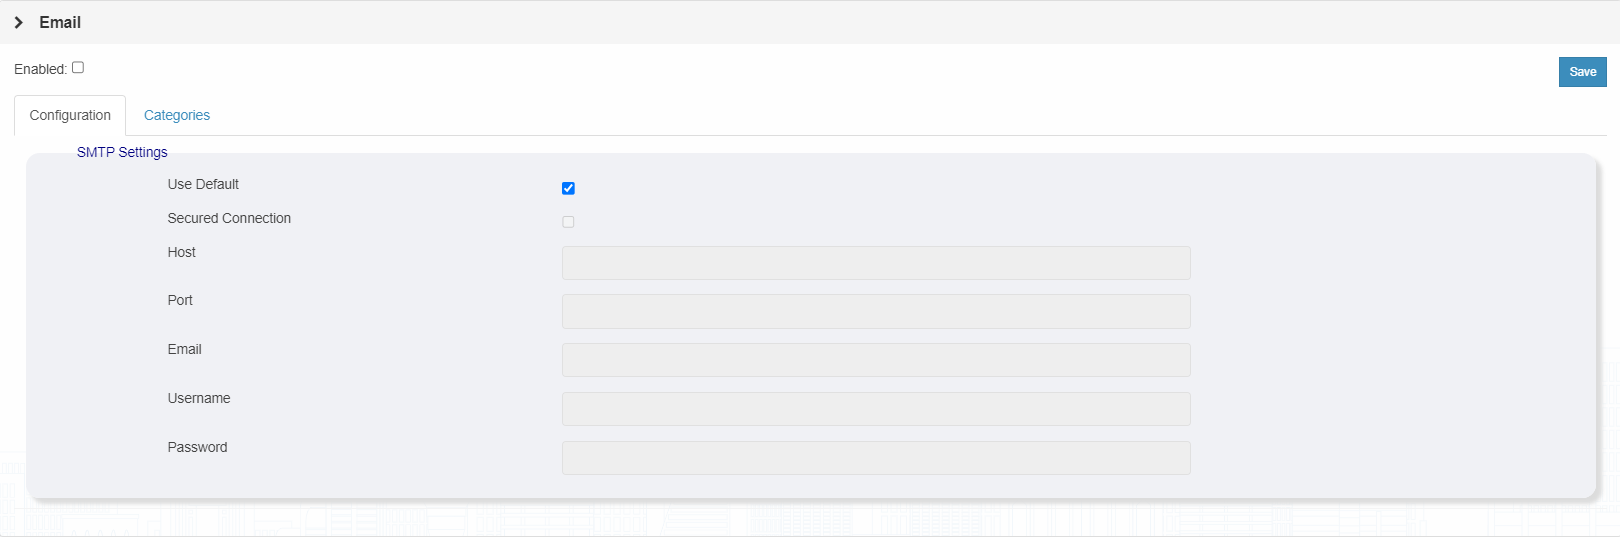
In the "SMTP Settings" section, you have the flexibility to configure and utilise your own SMTP server for sending emails. You have two options to choose from:
Use Default (Recommended): By enabling the "Use Default" option, you can utilise the FMC SMTP server to send emails. This option simplifies the setup process as the system automatically handles the SMTP configuration for you.
Custom SMTP Server: If you prefer to use your own SMTP server, you can disable the "Use Default" option. Once disabled, you need to provide the following details in the corresponding fields:
By configuring the SMTP settings, you can ensure that the system uses the appropriate SMTP server to send emails, either the default FMC server or your own custom server. This flexibility allows you to align the email sending process with your specific requirements and preferences.
NOTE:
In the bulk message, the arrangement of the messages will be sorted based on the priority level of the points. Messages with higher priority levels will be displayed first, followed by messages with lower priority levels. Within each priority level, the messages will be further sorted based on the time they were received, ensuring a clear and organised presentation of the messages.Configure the time interval to send alarm notification emails to the recipients. By default, the minimum time interval is one hour, and the system will send emails to the recipients every hour at the start of each hour.
Decide whether to use the default template or a custom one. If you choose the custom option, define your own templates for the Subject, Heading, and Content text fields.
We have provided the variable features for the template:
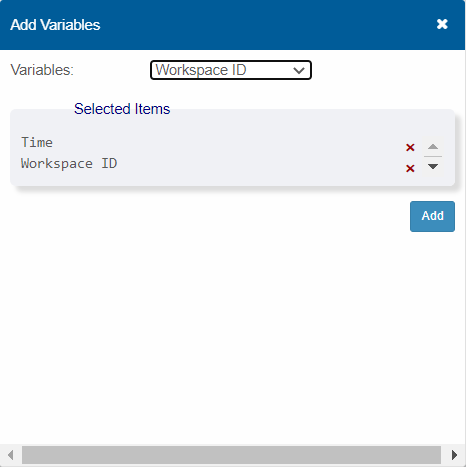
Users can select multiple variables, and click “Add”, it will show up in the text box like the figure below.
Users have the flexibility to modify the Subject, Header, and Content of your messages according to your preferences and specific requirements.

After finish editing, click on Save button to apply to changes.
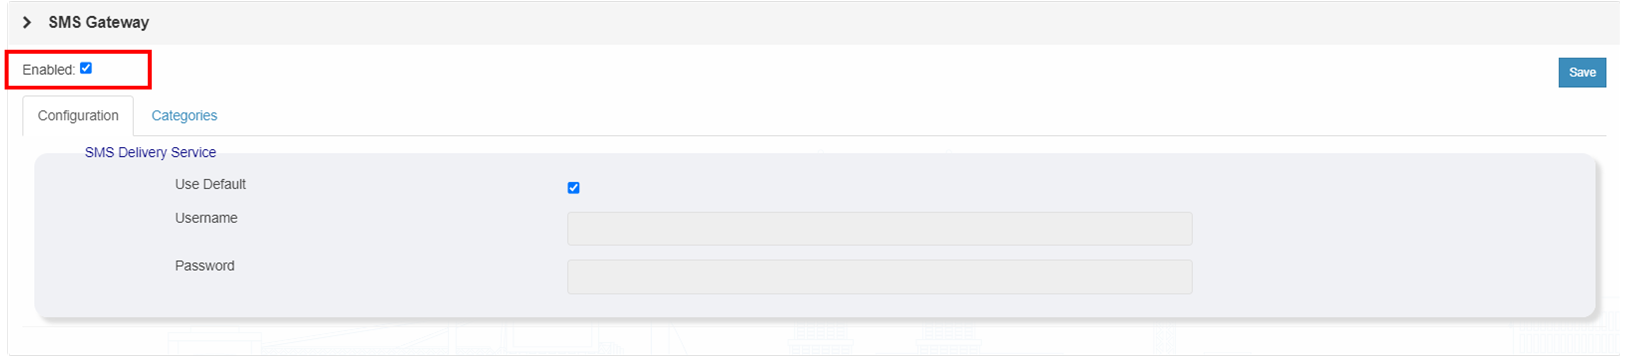
To enable the system to send messages through the SMS gateway, ensure that the "Enabled" option is checked. This setting allows the system to utilise the SMS gateway functionality and deliver messages via the configured SMS delivery service. By enabling this option, users can leverage the power of SMS communication to reach recipients effectively and ensure timely message delivery.
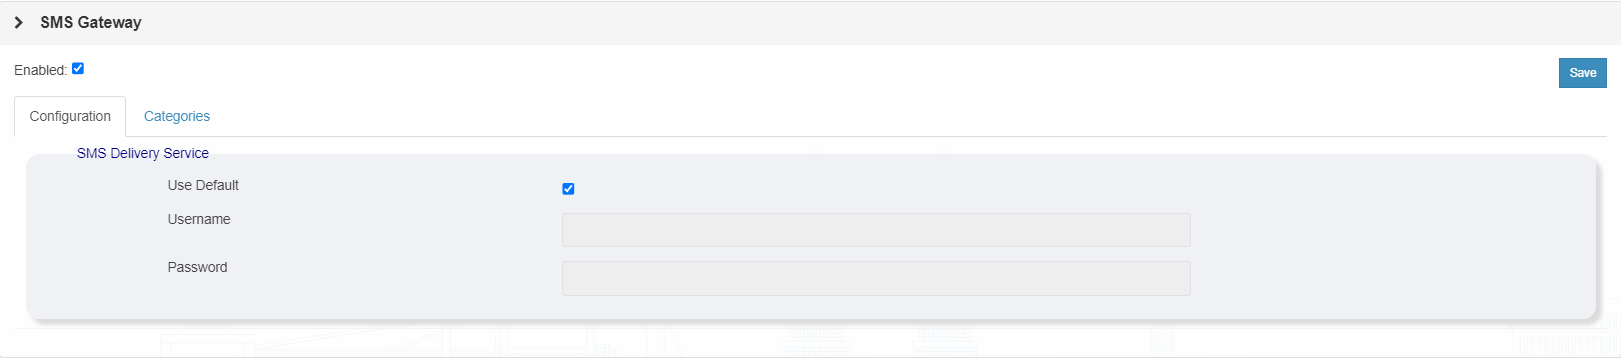
You can enable the SMS gateway feature to deliver messages through the SMS delivery service. Our system currently supports the SMS delivery service provider Exabytes.
If you prefer to use your own Exabytes account for the SMS gateway, you can fill in the respective fields with your Exabytes account "Username" and "Password".
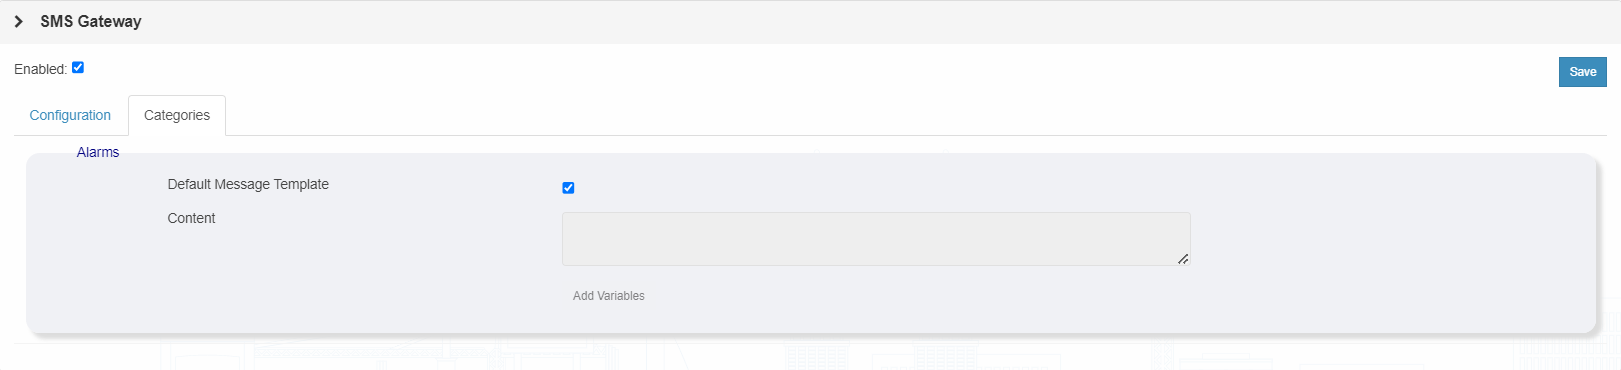
Default Message Template
Decide whether to use the default template or a custom one. If you choose the custom option, define your own templates for the Content text fields.
Content
Define the message template of the SMS text content.
To add variables to the "Selected Items" box:
To remove a variable from the "Selected Items" box:
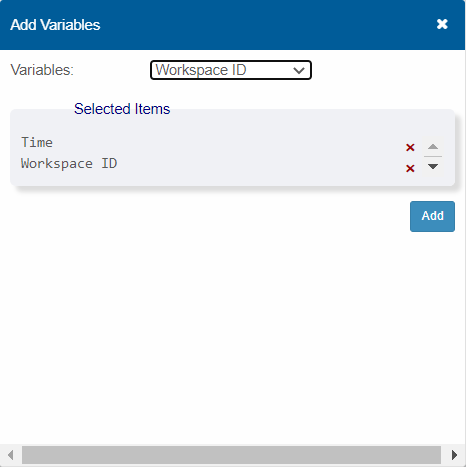
Users can select multiple variables, and click “Add”, it will show up in the text box like the figure below.

After finish editing, click on Save button to apply to changes.
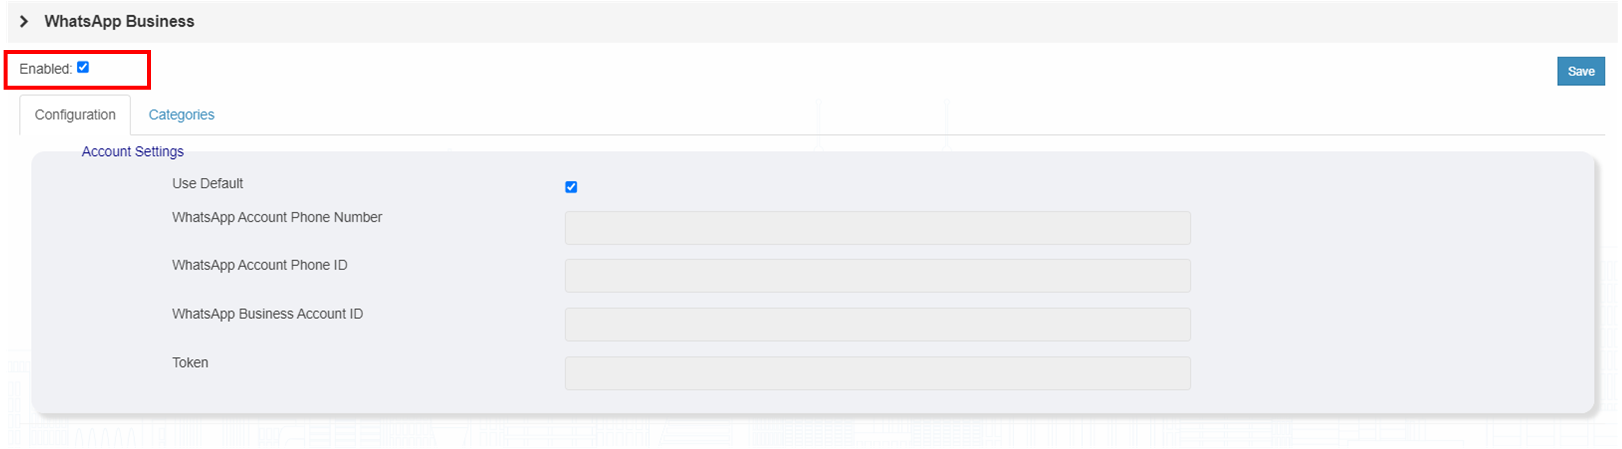
To enable the system to send messages using WhatsApp, please check the "Enabled" option. This will authorise the system to utilise WhatsApp as a communication channel for message delivery.
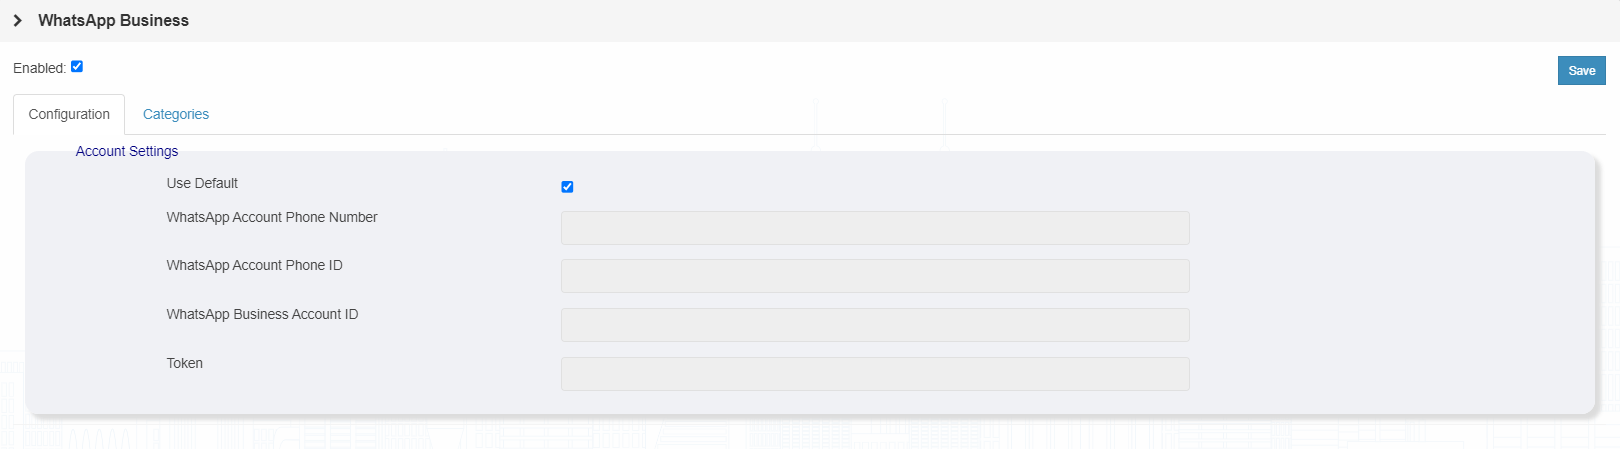
Account Settings:
To send messages to recipients via WhatsApp using the FMC WhatsApp Business Account, enable the "Use Default" option. This will ensure that messages are sent through the default FMC WhatsApp Business Account.
However, if you wish to send messages using your own WhatsApp Business Account, you will need to provide the following details in the respective fields:
Please note that a community WhatsApp Account will not be compatible for this purpose.
By filling in these fields with the appropriate information, you can configure the system to send messages using your preferred WhatsApp Business Account, providing flexibility and customization options for your messaging needs.
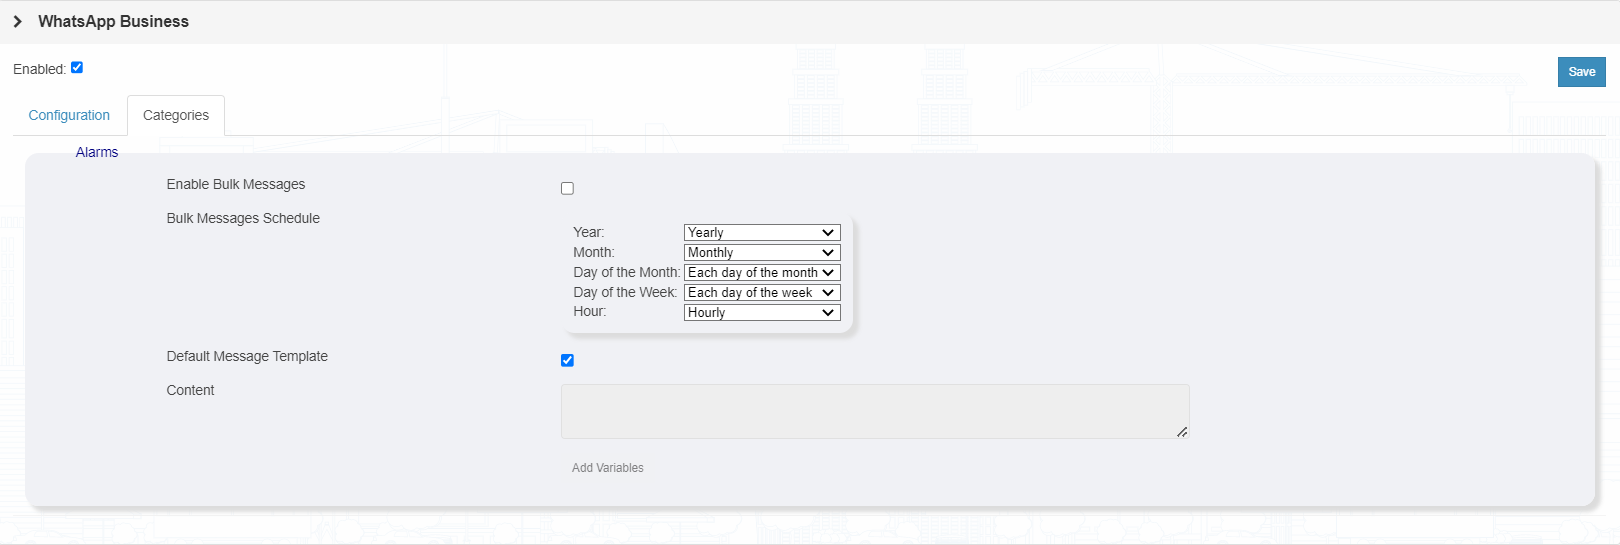
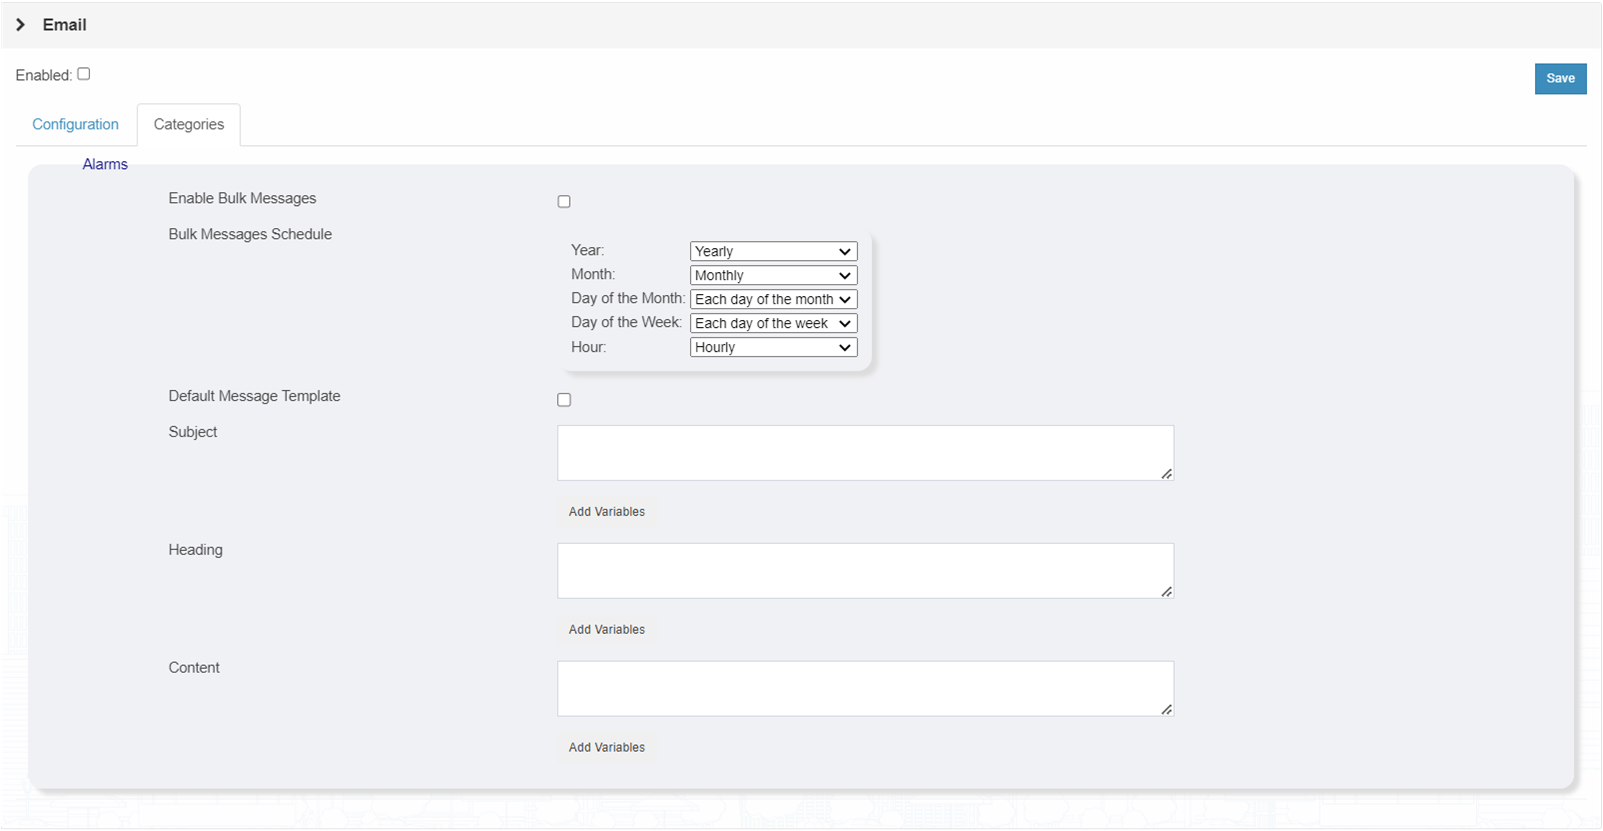
Configuration options in “Alarms”:
Enable Bulk Messages
Enabled: All the alarm notifications will be stored and send it as a single email to the recipients. The time interval to send the emails can be configured at “Bulk Messages Schedule” section.
Disabled: Each alarm notification will be sent as a single email to the recipients immediately.
NOTE :In the bulk message, the arrangement of the messages will be sorted based on the priority level of the points. Messages with lower priority levels will be displayed first, followed by messages with higher priority levels. Within each priority level, the messages will be further sorted based on the time they were received, ensuring a clear and organised presentation of the messages.
Bulk Messages Schedule
Configure the time interval to send alarm notification emails to the recipients. By default, the minimum time interval is one hour, and the system will send emails to the recipients every hour at the start of each hour.
Default Message Template
Decide whether to use the default template or a custom one. If you choose the custom option, define your own templates for the Subject, Heading, and Content text fields.
Content
Define the custom message template here. Add new lines, tabs, more than 4 consecutive spaces are not allowed and will turn into a single space.
To add variables to the "Selected Items" box:
To remove a variable from the "Selected Items" box:
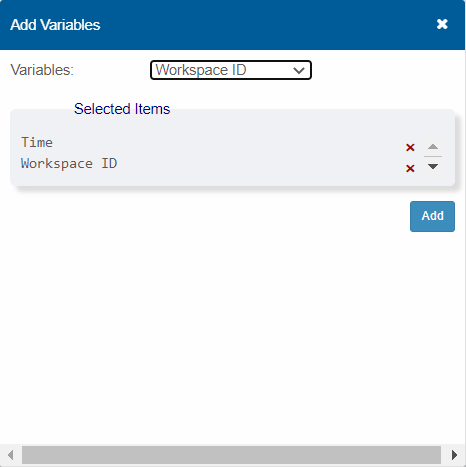
Users can select multiple variables, and click “Add”, it will show up in the text box like the figure below
After finish editing, click on “Save” button to apply to changes.
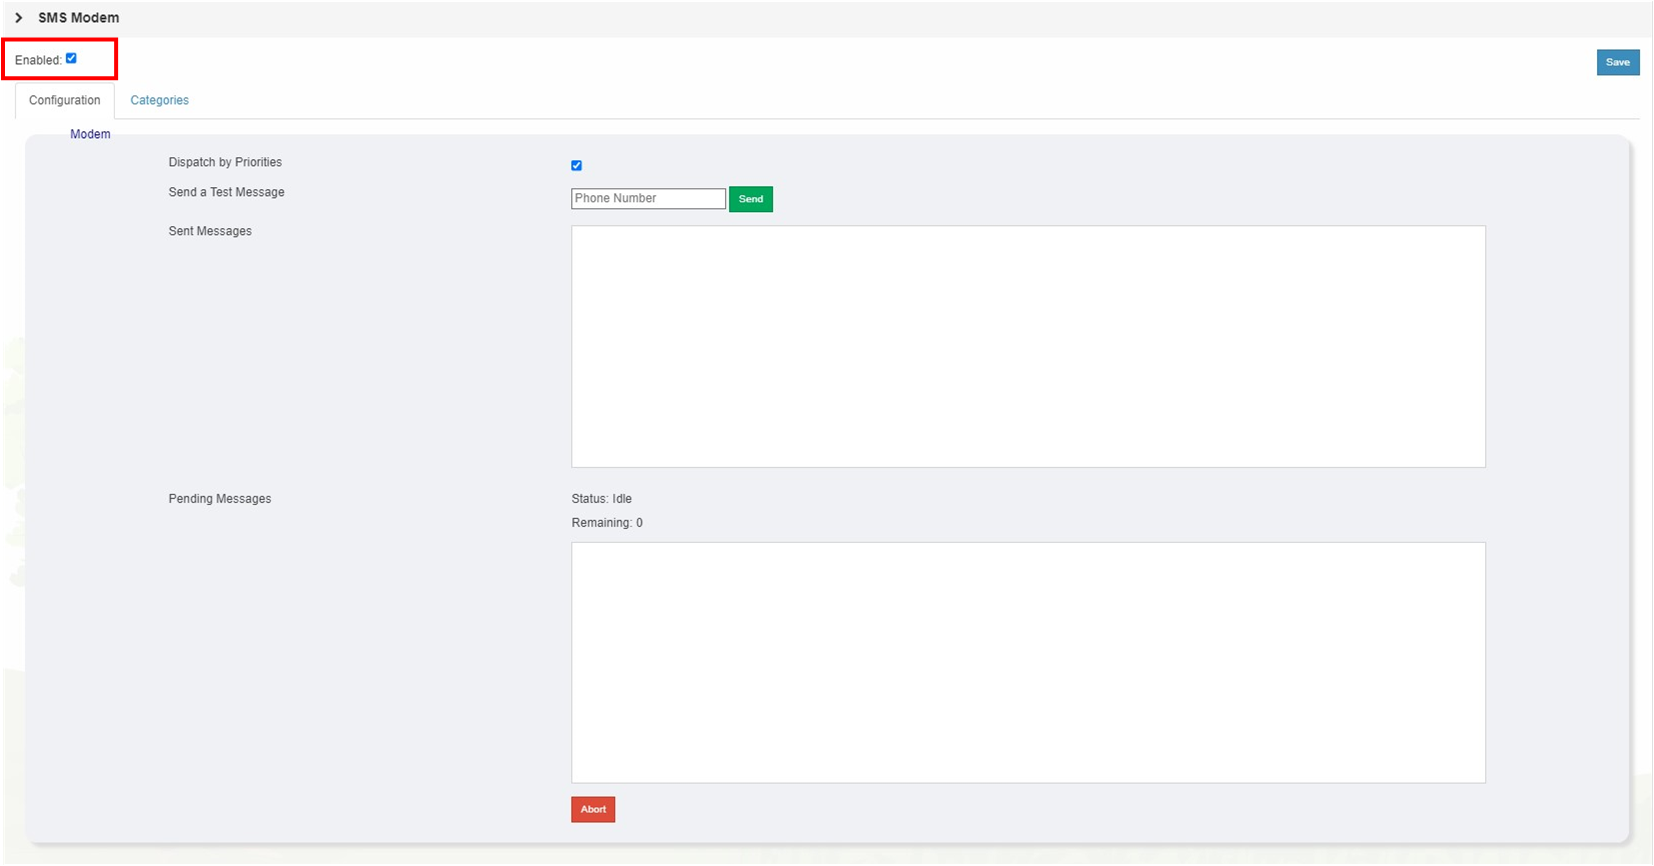
Enable to allow the system to send messages by SMS modem.
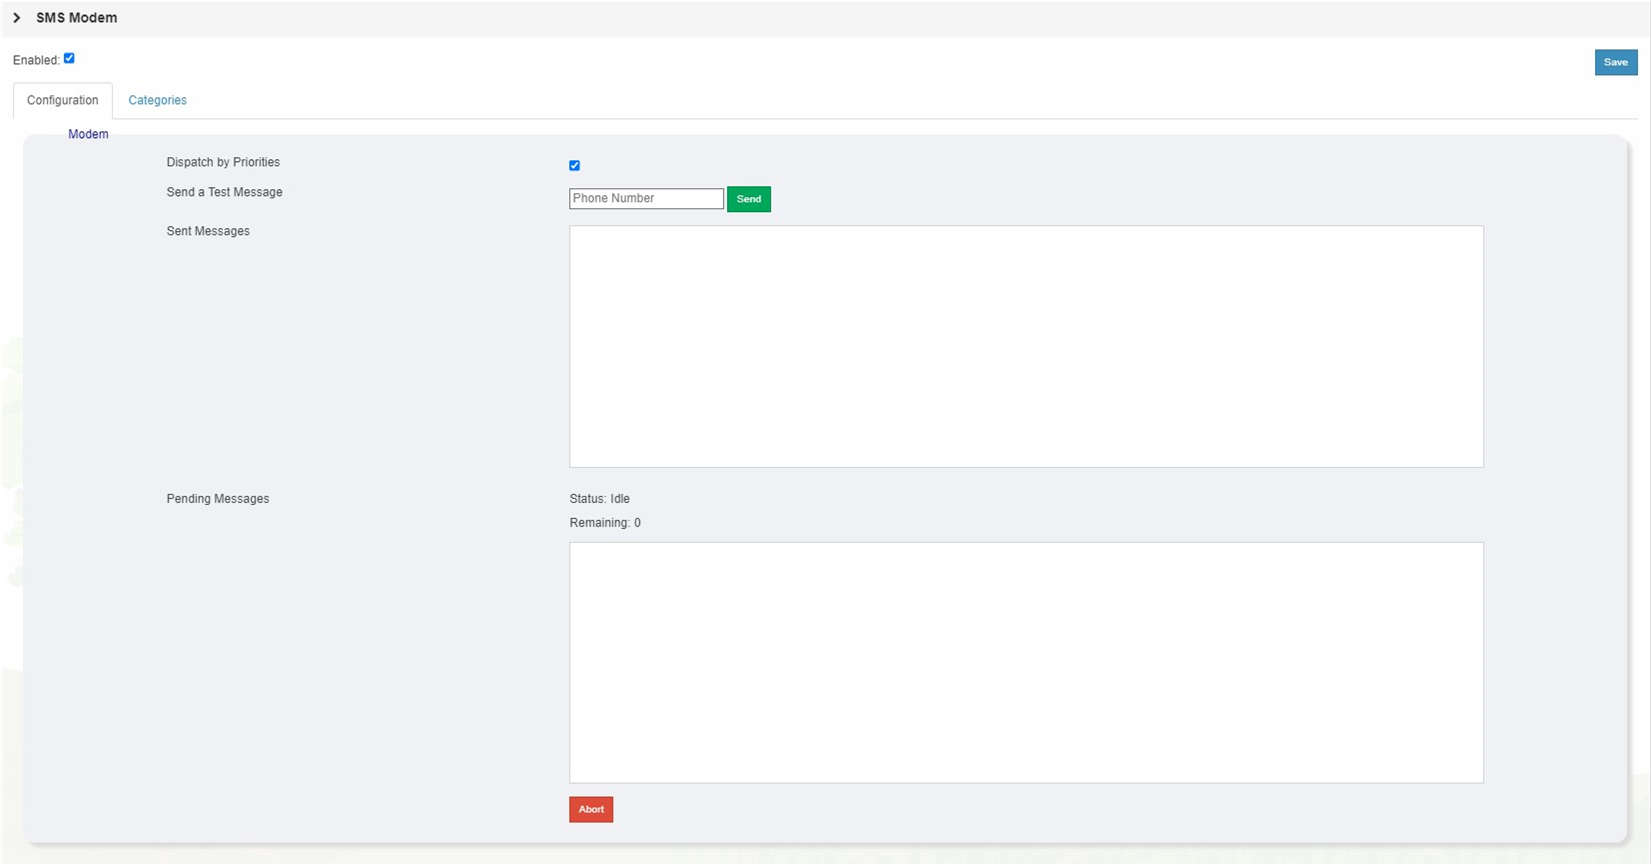
Enable: The messages will be dispatched to the recipients based on the priority of the IO Points. The system follows a prioritization order, where higher-priority IO Points will have their messages sent first. This ensures that critical information and notifications are promptly delivered to recipients, allowing for timely response and action.
Disable: By disabling the dispatch by priorities, all messages will be treated equally regardless of the priority assigned to the associated IO Points. This approach can be useful in situations where the order of message delivery is not determined by priority levels but rather by chronological order or other factors.
NOTE :Please note that the priority of the recipients is determined based on the priority level assigned to the IO Points. The IO Points with a priority level of 0 will be given the highest priority, followed by IO Points with priority levels 1, 2, 3, and so on.
Send a Test Message
Allows users to test the messaging functionality within the system. This feature is particularly useful for verifying if users' phone numbers can receive messages via SMS. By initiating a test message, users can confirm the successful delivery of messages to their designated phone numbers.
NOTE :Please note that the "Send a Test Message" feature is primarily intended for testing purposes and should not be used for sending actual messages or notifications to recipients. It serves as a valuable tool to ensure the proper functioning of the messaging system and validate the communication channels between the system and the recipient's device.
Sent Messages
The sent messages will be stored and kept within the table with the following format:
Example:

Pending Messages
The message is in a pending state and has not been sent yet.
NOTE: If the "dispatch by priority" feature is enabled, the latest high priority messages will be prioritised and placed in the pending queue. As a result, lower priority messages may experience delays in being sent.
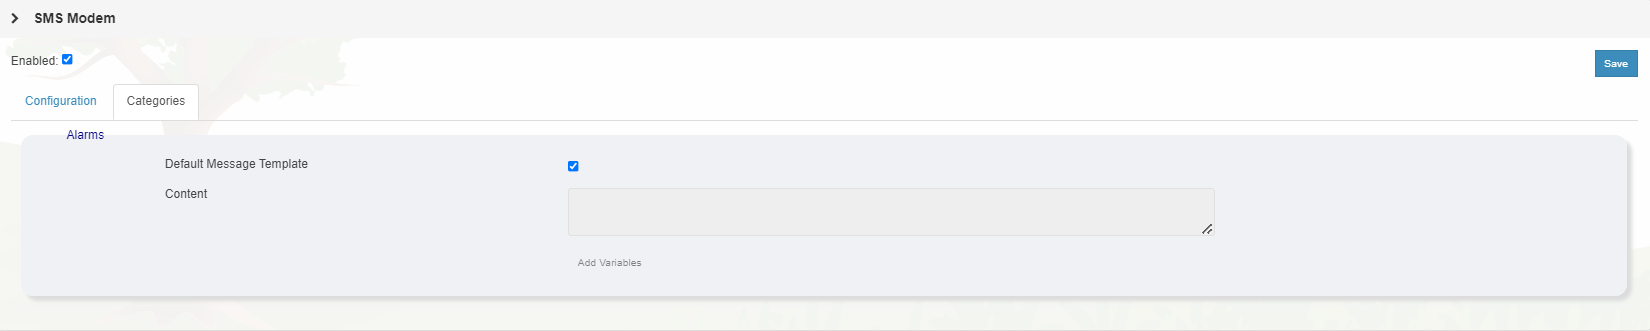
Decide whether to use the default template or a custom one. If you choose the custom option, define your own templates for the Subject, Heading, and Content text fields.
Define the custom message template here. Add new lines, tabs, more than 4 consecutive spaces are not allowed and will turn into a single space.
To add variables to the "Selected Items" box:
To remove a variable from the "Selected Items" box:
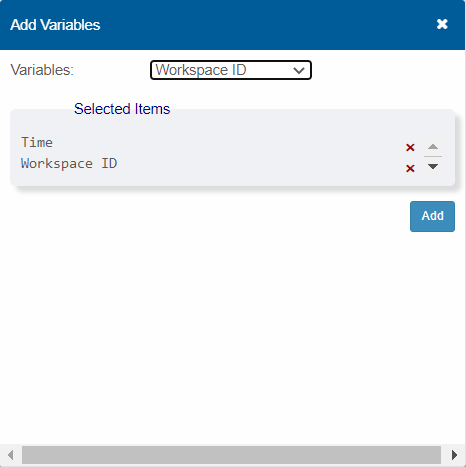
Users can select multiple variables, and click “Add”, it will show up in the text box like the figure below
After finish editing, click Save button to apply to changes.
All queries to the system are served over HTTP and need to be presented in the following form:
POST
application/octet-stream
| Field | Type | Description |
|---|---|---|
| tokenId | String | The unique token identifier generated via the "Messaging API" module |
| sender | String |
The type of sender to send the message with. We support four types of senders:
|
| message | Message | Text of the message to be sent. API clients are responsible for formatting the message. |
| recipients | Array of String |
The recipients of the message. Format varies by sender type:
|
| Field | Type | Description |
|---|---|---|
| status | String | Status code for the request: 200: Successful request. 500: Failed request. |
| error | Error | Optional. Presented to the API client only when the request fails. |
| Field | Type | Description |
|---|---|---|
| title | String | Title of the message. Only include if the sender is “Email”. |
| heading | String | Header of the message. Only include if the sender is “Email”. |
| content | String | Text of the message to be sent. |
| Field | Type | Description |
|---|---|---|
| errorCode | String | Unique identifier of the error. Not handled by the system if absent. |
| message | String | The error message explaining the reason for failure. |
| Error code | Description |
|---|---|
| 97 | The length of the octet stream is too short. |
| 98 | The length of the JSON string is too short compared to the specified JSON length. |
| 99 | The JSON string received is not valid JSON. |
| 100 | Unknown internal error while decoding the JSON string. |
| module11NotEnabled | The "Messaging" module is not enabled. |
| module11E1002 | The sender provided is not found (sender not enabled or invalid). |
| module11E1003 | The sender provided is not enabled. |
| module11E1004 | Internal error when interpreting the message. |
| module11E1201 | Invalid properties in the "message" property. |
| module11E2001 | The SMTP client for the sender type "Email" is not available. |
| module11E3001 | Invalid username or password for SMS gateway authentication. |
| module11E3002 | Request to the SMS gateway timed out. |
| module11WhatsappNotSupported | The sender type "WhatsApp" is not supported in FMC controllers. |
| module11Whatsapp<error> | Error responded by the WhatsApp API. Refer the link for the error codes : https://developers.facebook.com/docs/whatsapp/on-premises/errors |
| module13NotEnabled | The "Messaging API" module is not enabled. |
| requestTimeout | The message request to the sender timed out. |
| smtpClient1001 | The "recipients" property must be an array of emails. |
| smtpClient1004 | The "recipients" property is an empty array. |
| smtpClient1005 | The "recipients" property contains an invalid email format. | smtpClient1008 | The property “message” is invalid. |
| smtpClientEx | Generic SMTP client error. |
| smtpClientEx<error> | The error returned by the SMTP server. Refer to the SMTP service provider of your own for the error. If the API client is opting for using the default SMTP service, refer to the following website for error codes: https://ph.godaddy.com/help/fix-rejected-email-with-a-bounce-error-40685 NOTE: If the errorCode is not recognised by FMC, the error code will be remained as SmtpClient_Ex |
| tokenNotExist | The tokenId provided in the API request is not found in the system. |
| tokenInvalid | The tokenId provided is invalid (expired or inactive). |
This section will illustrate how to set up the network for the device.
Each FMCC device comes with three network ports, namely WiFi, LAN, and WAN.
The device can be configured to work with three independent subnet masks, as shown in the diagram below:
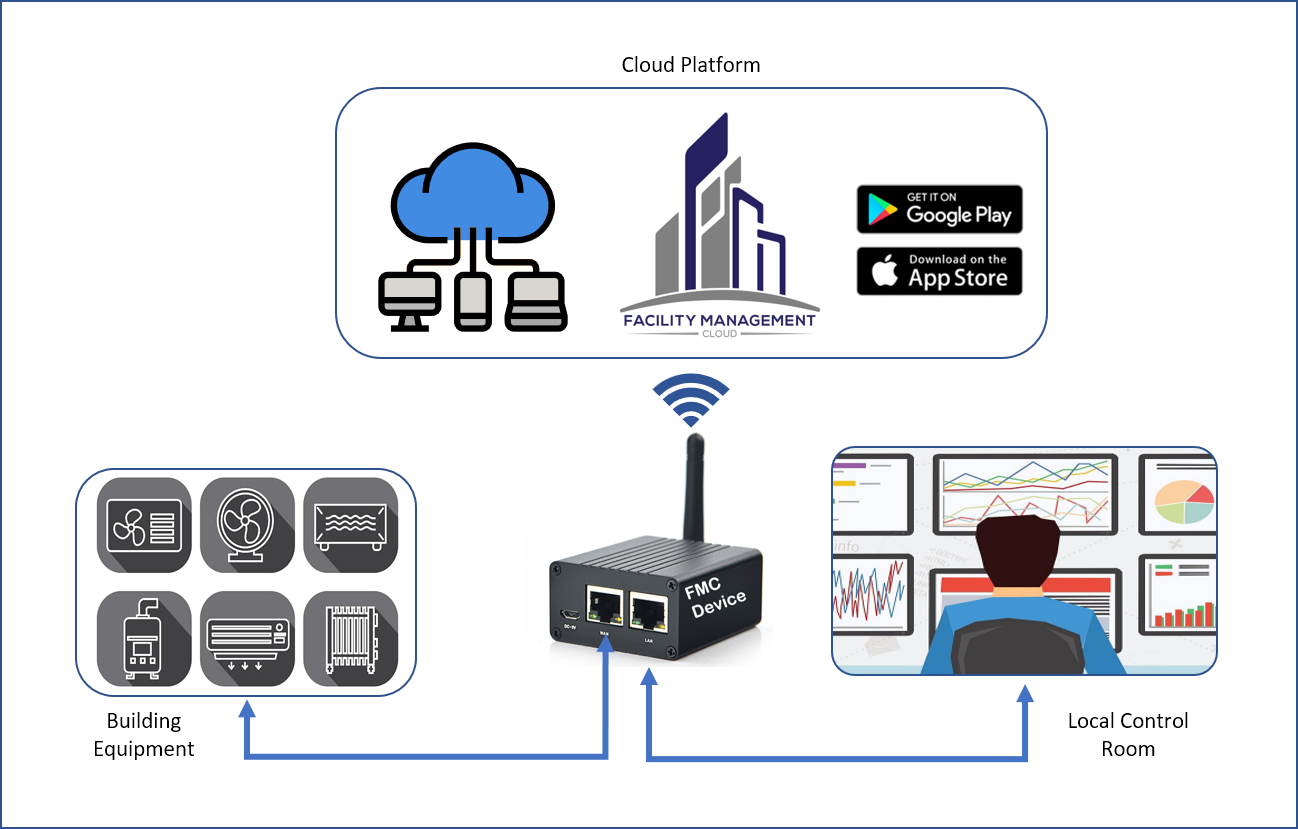
The connection to LAN must be to the local BMS. WAN and WiFi can be interchangeable to connect to the Internet or a local Access Point (AP) respectively.
WAN port for FMCC is the primary network port for the FMCC Device. Users can connect the WAN port directly to the internet to access the FMCC Cloud.
To communicate with equipment, connect the network cable from the network switch to the WAN port. In this case, if the facility is running BACNet protocol, it must connect to the WAN port. It is the default port for FMCC to read the equipment status.
FMCC WAN Port does not support DHCP. It must be configured as fixed-IP in order to work.
As factory default, WAN port is configured with the below parameters:
| Default IP: | 192.168.1.50 |
| Default Gateway: | 192.168.1.1 |
| Subnet: | 255.255.255.0 |
| DNS: | 8.8.8.8 |
To edit the WAN port settings, click on the WAN tab in network management, and enter all the necessary information.
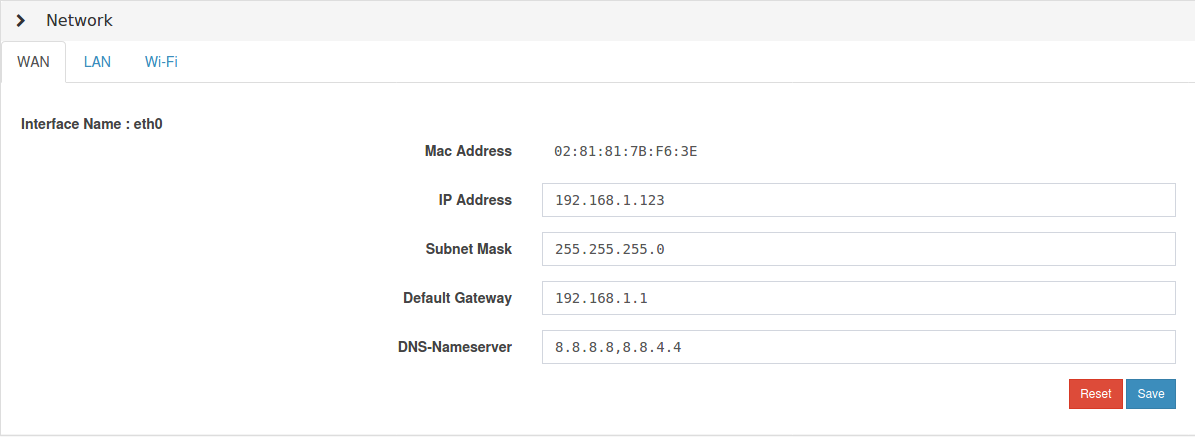
LAN port is the secondary network port on FMCC device. It is meant to connect to the local network, normally to Control Room for Supervisory Control purpose. In this case, LAN will allow FMCC Device to communicate in a different subnet mask.
LAN can also be used to connect to the internet. Just insert the proper subnet and gateway and DNS. Connecting to the internet is important, so the FMCC cloud will be able to get the data from the FMCC device.
To setup LAN, click the LAN tab.
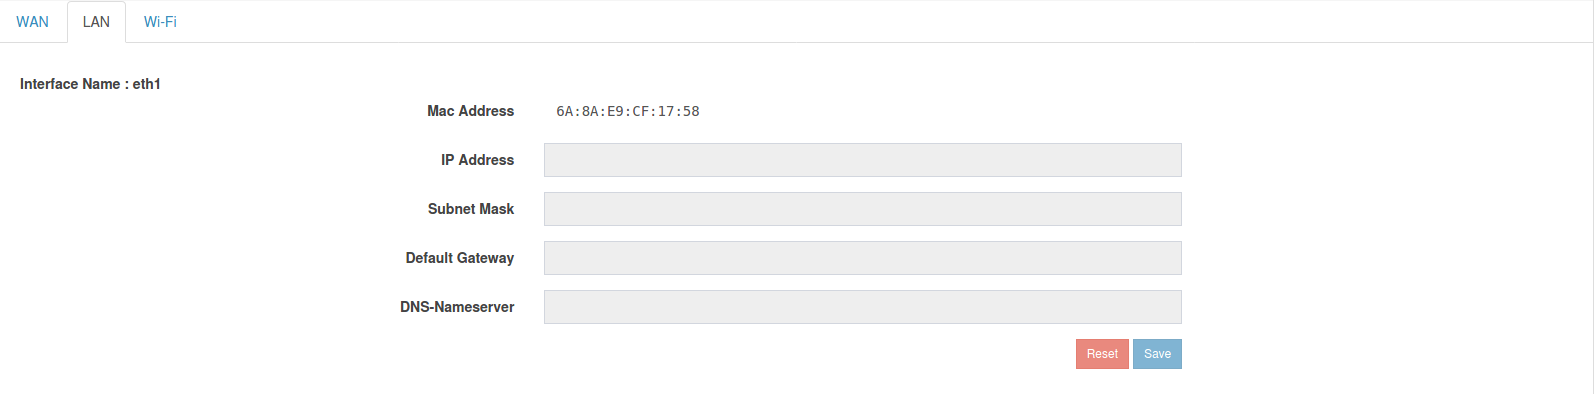
Click the WiFi tab to enter the WiFi configuration page.
From here, users can view and select which Access Point to join, based on the SSID. Select and enter the password to join. After joining the AP, the IP address will be assigned by the AP.
Previous setting of IP address (in LAN or WAN) will not affect the WiFi IP Address, as all LAN, WAN, and WiFi all work independently to each other.

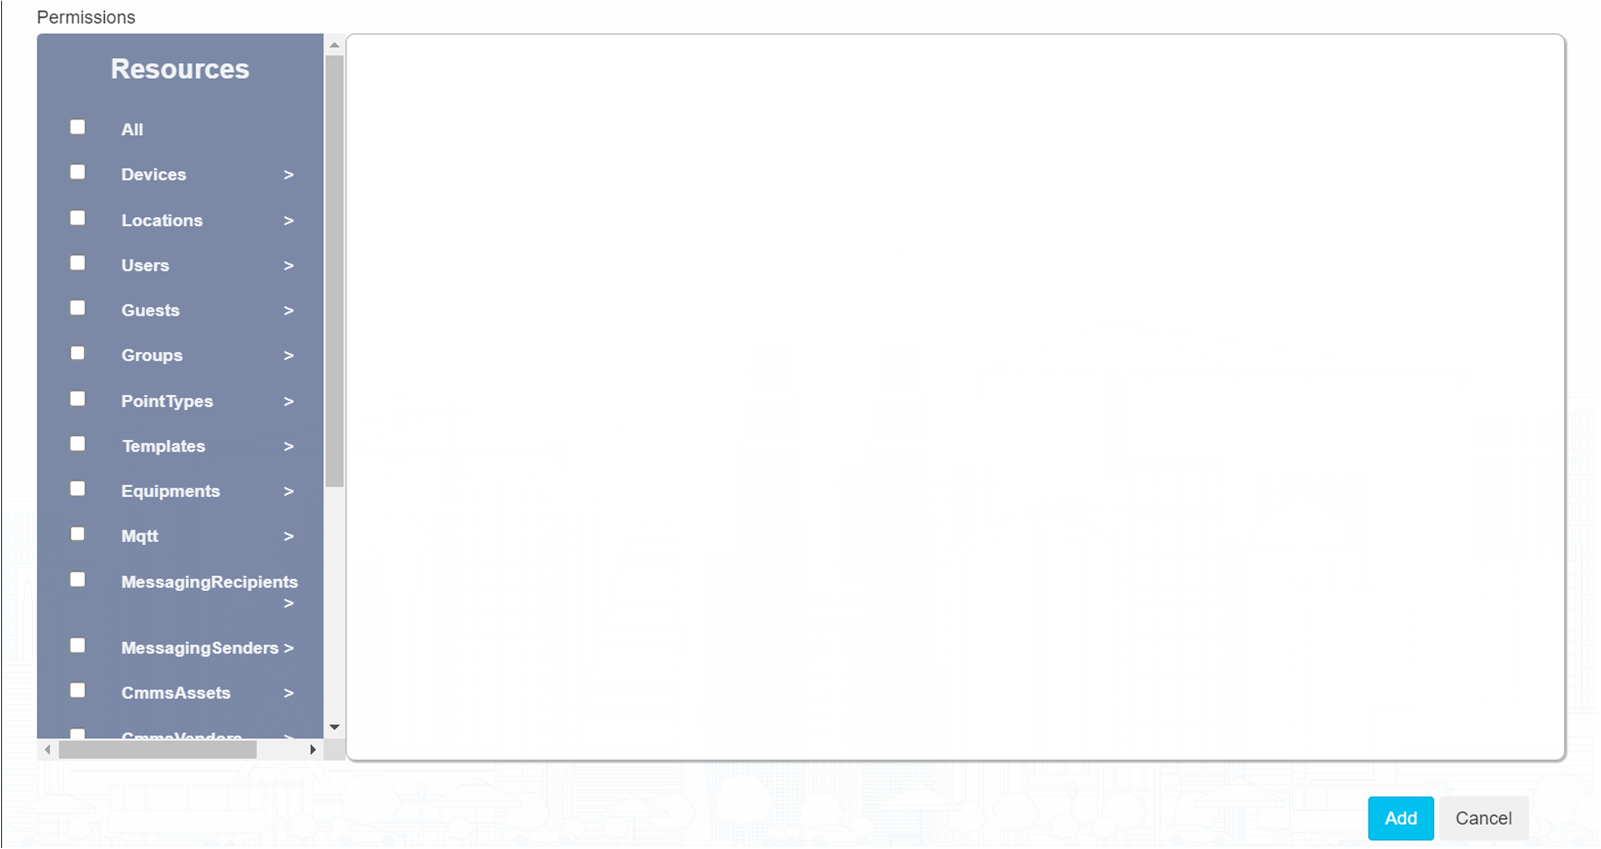
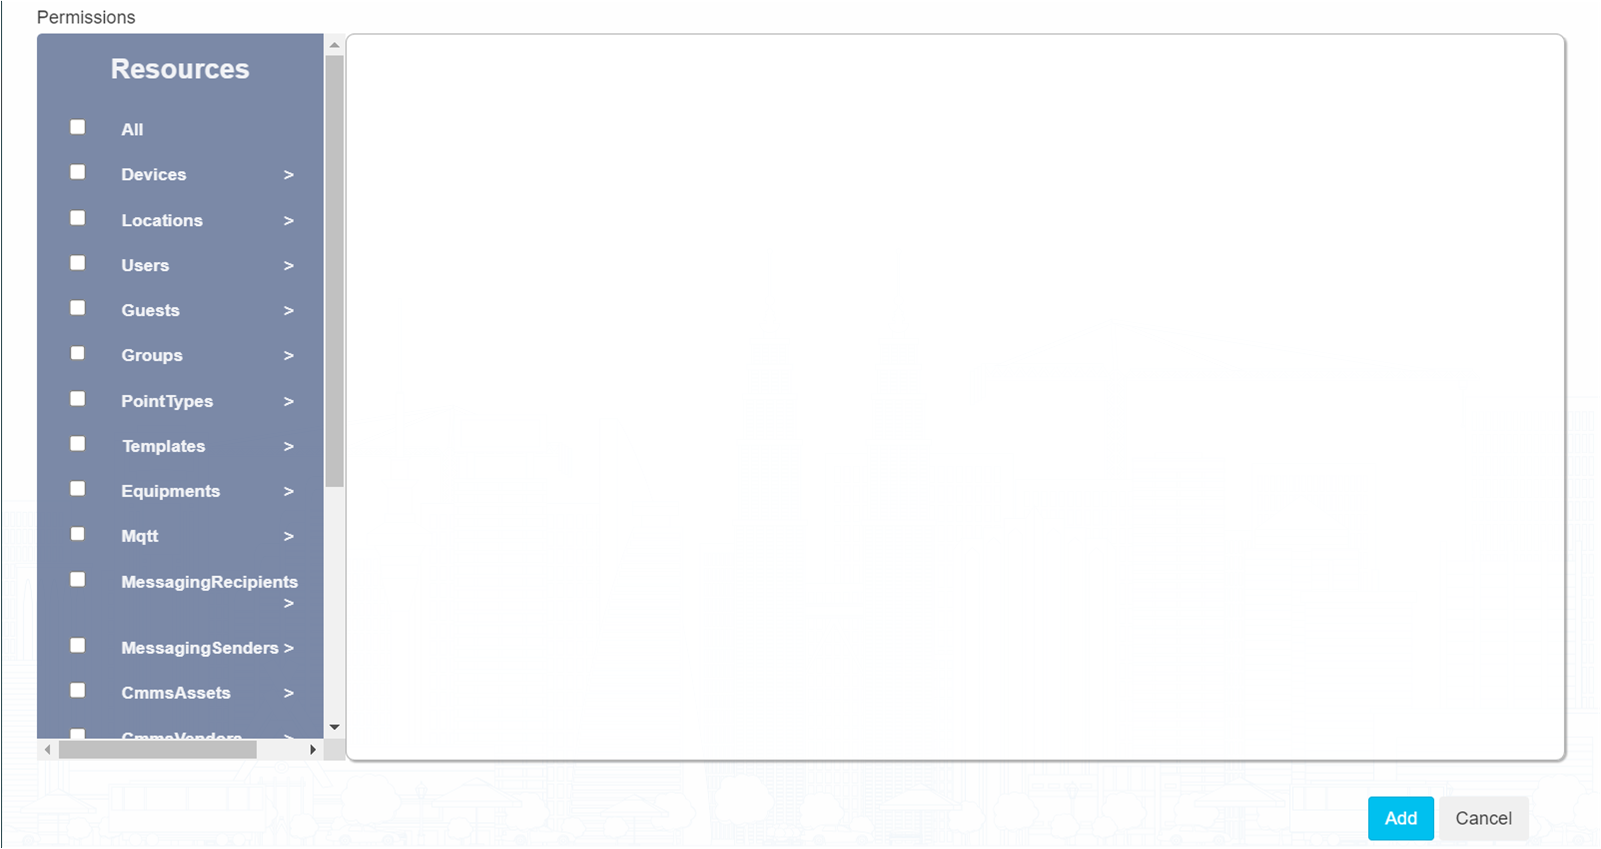
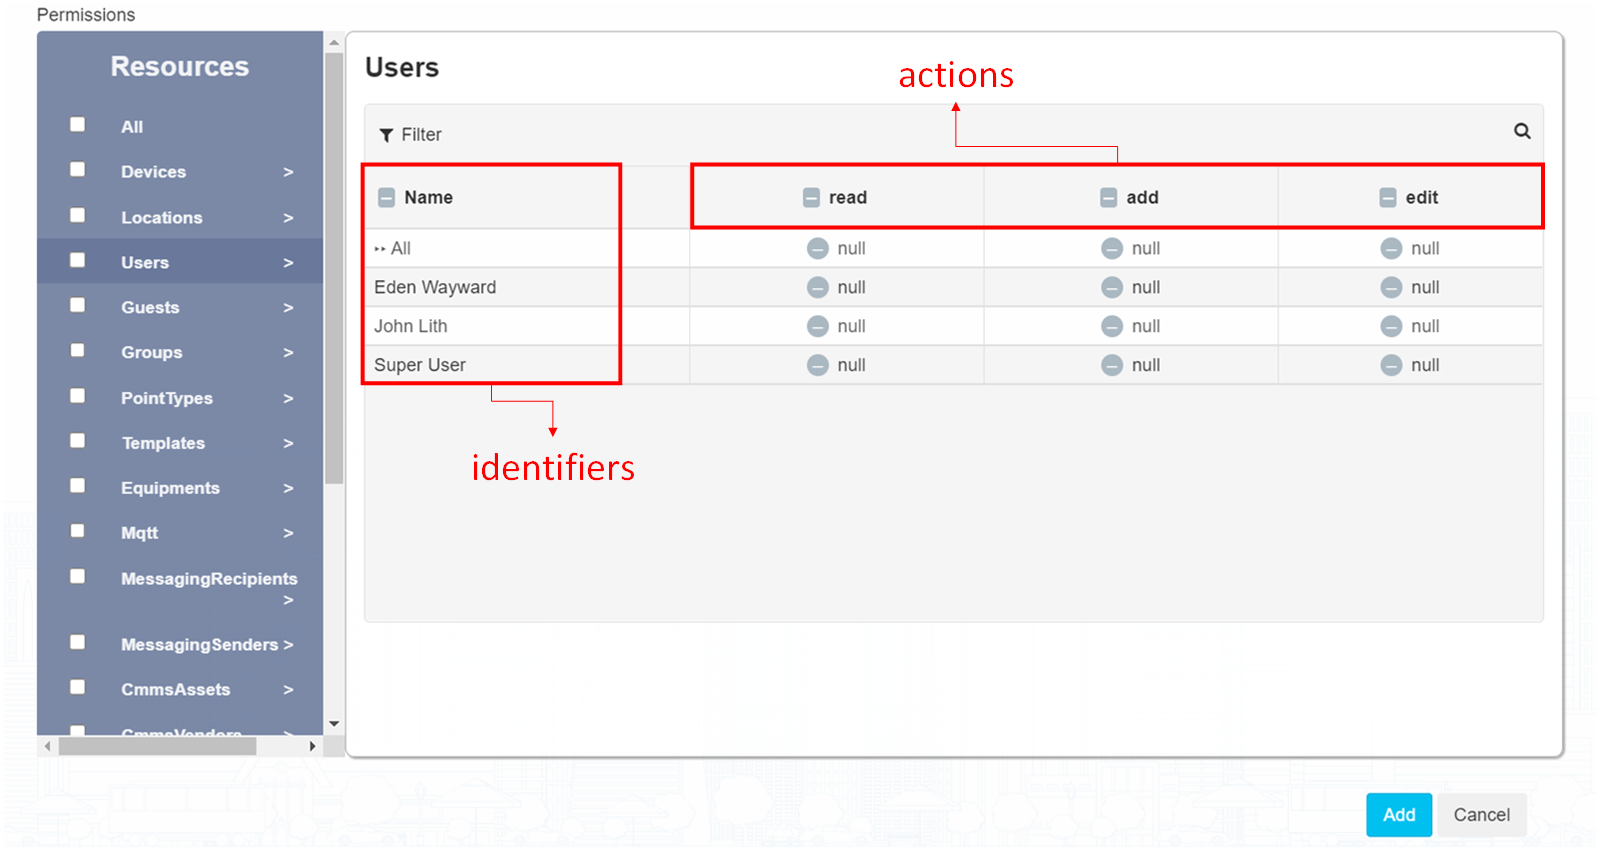
Access control is the selective restriction of access to a place or other resources. In this system, resources are the components of a device, locations, users and groups while access is broken down to actions. For example, actions can be the CRUD operation (Create, Read, Update, Delete). A resource is further broken down into individual identifier to provide a flexible configuration of access control. For resources, actions and identifiers, there is a special entry named "All". This entry means all access in resource level, all types of action in action level and entire resource in identifier level.
Both users and groups have access control feature. However, the access control feature might be different to other system. The golden rule of access control in this system is users' access control is always the priority. If there is permission to access a resource on the user's level access control, even though the user is in a group that have all access denied, he/she still can access the resource without having any issues.
A resource depends on other resources. To access a dependent resource, the user must also have a granted permission for the parent resource besides the dependent resource. The dependent resources in the system are "Equipments" and "Templates". "Equipments" Resource is depending on "Templates" Resource while "Templates" is depending on "PointTypes" Resource. In short, without the access to the "PointTypes" Resource, there will be no access to any equipment in the system. These will be the only two dependent resources so far in the system.
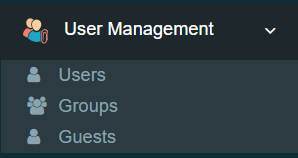
Users - Users in a workspace refer to individuals who have an account and the ability to sign in to a specific workspace. These users have access to the features, resources, and information within that workspace, allowing them to collaborate, communicate, and perform various tasks as part of the shared environment.
Groups - Groups in a workspace can include multiple users or guests, providing a convenient way to organise and manage users within the system. Each user or guest can join multiple groups, allowing for flexibility and collaboration across different teams and projects.
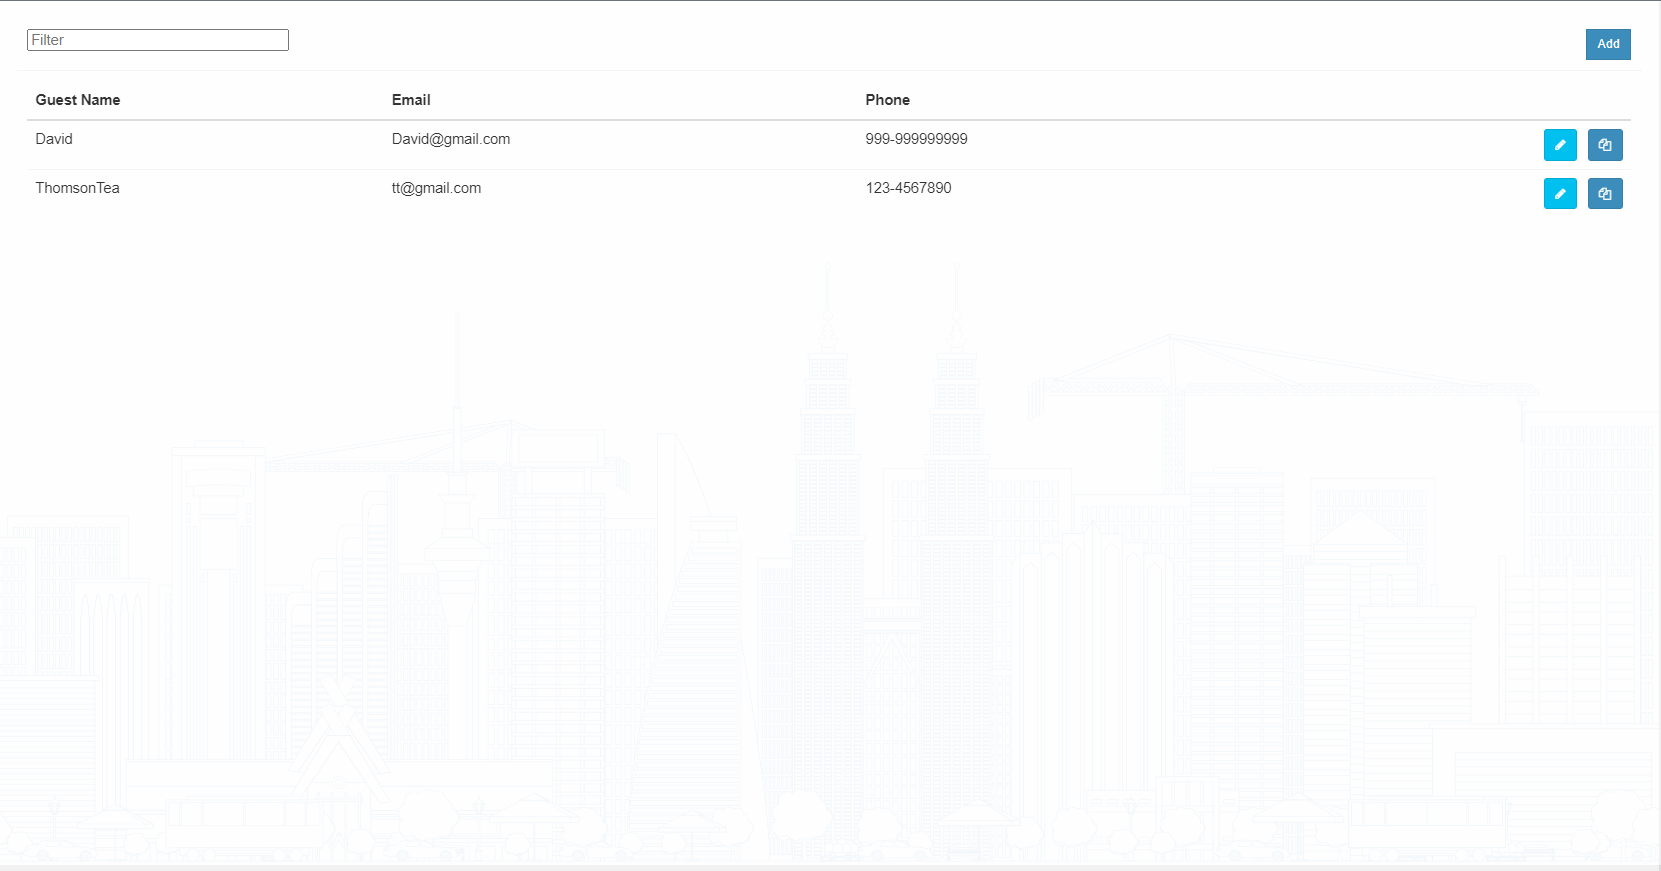
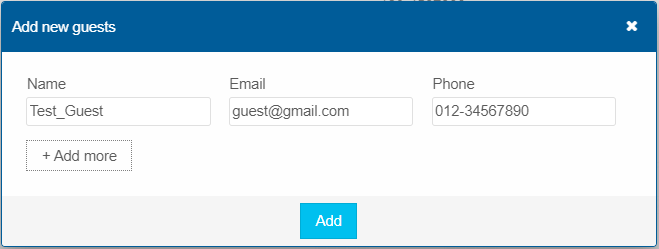
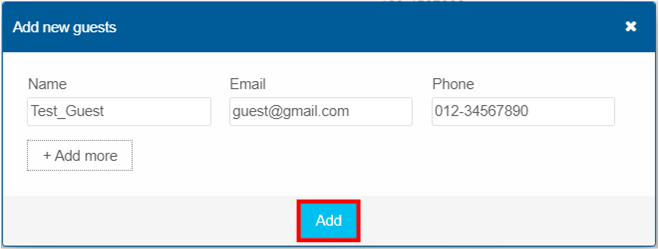
Guests - Guests in a workspace do not have the ability to sign in to the workspace. They are external participants who are invited to join the workspace and have limited permissions. Guests do not have control over the features and functionalities within the workspace, and their main role is to receive messages and notifications through the messaging feature. They serve the purpose of staying informed and engaged with the workspace's activities without having administrative access or control over the workspace.
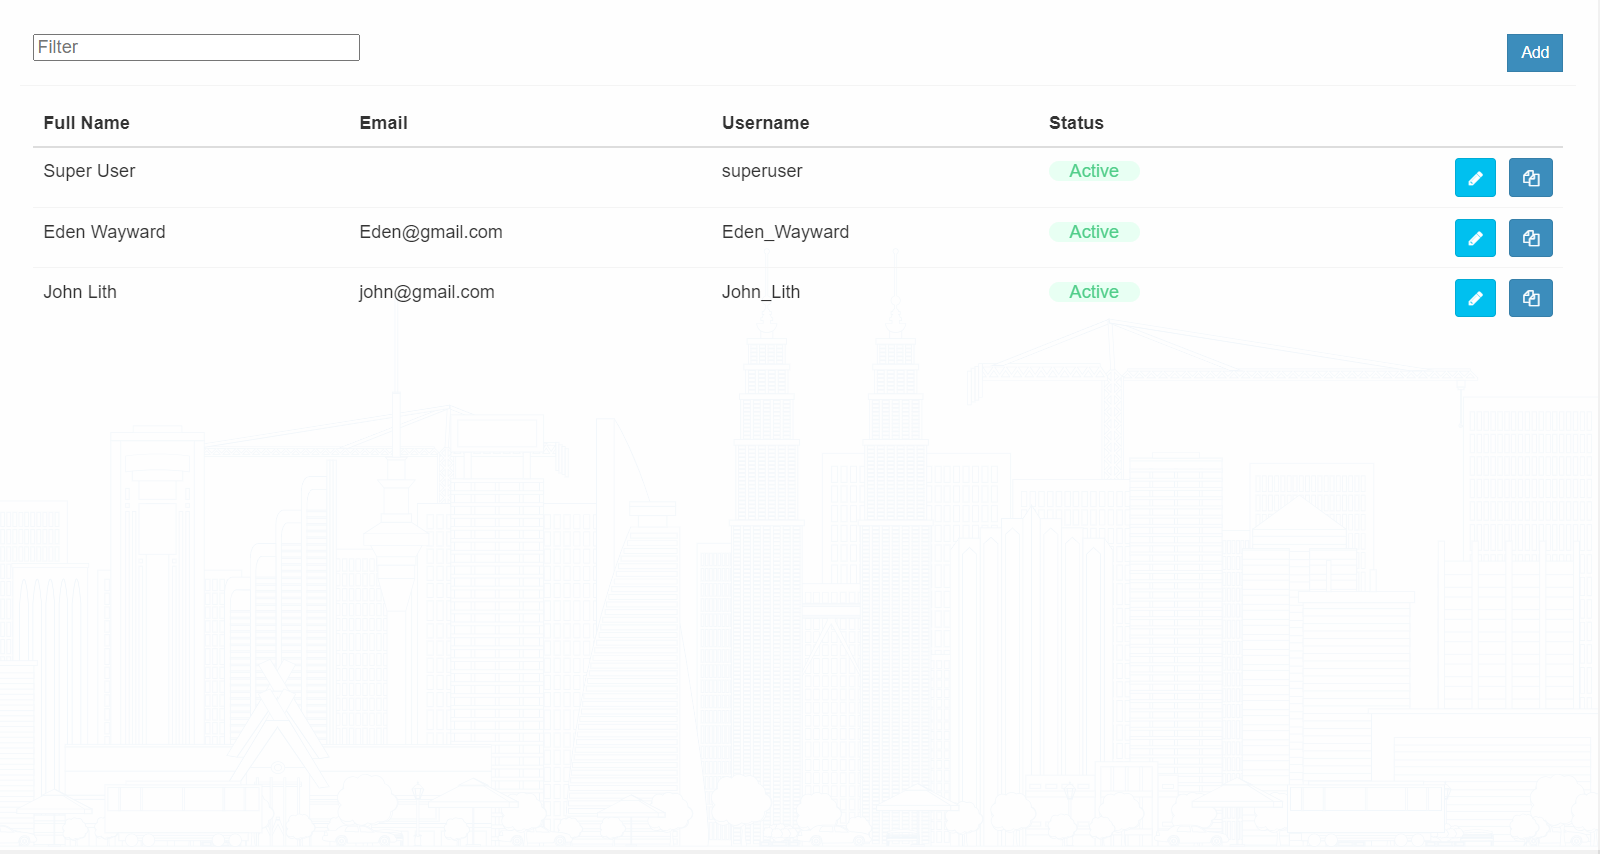
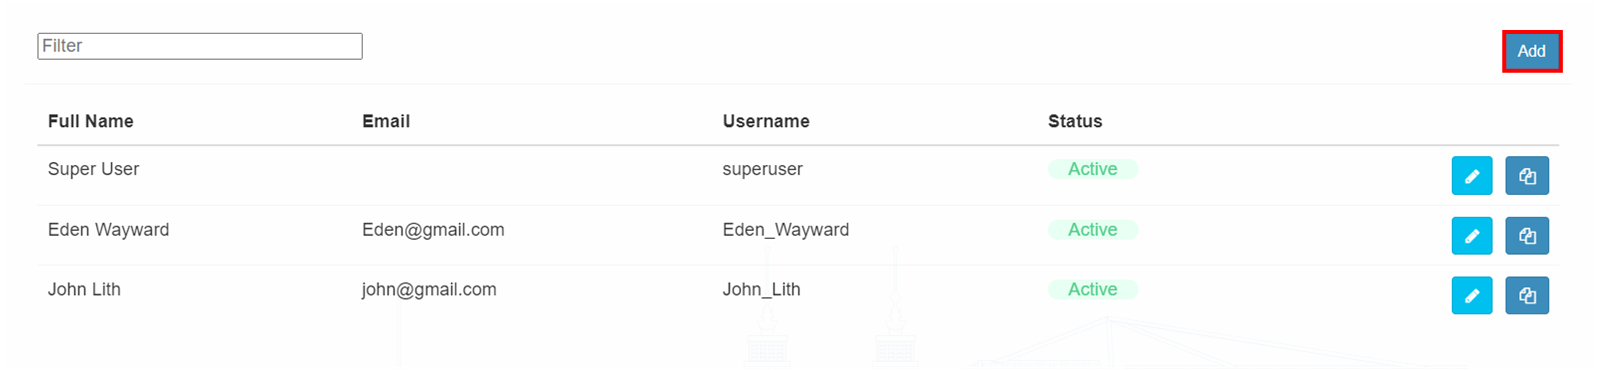
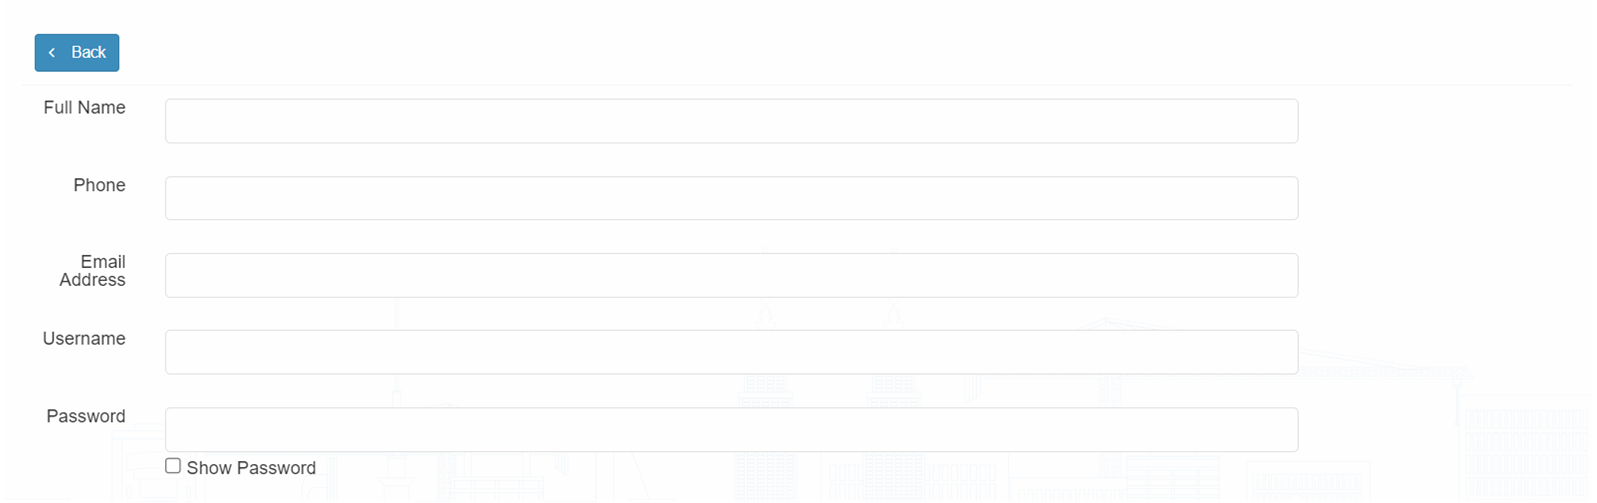
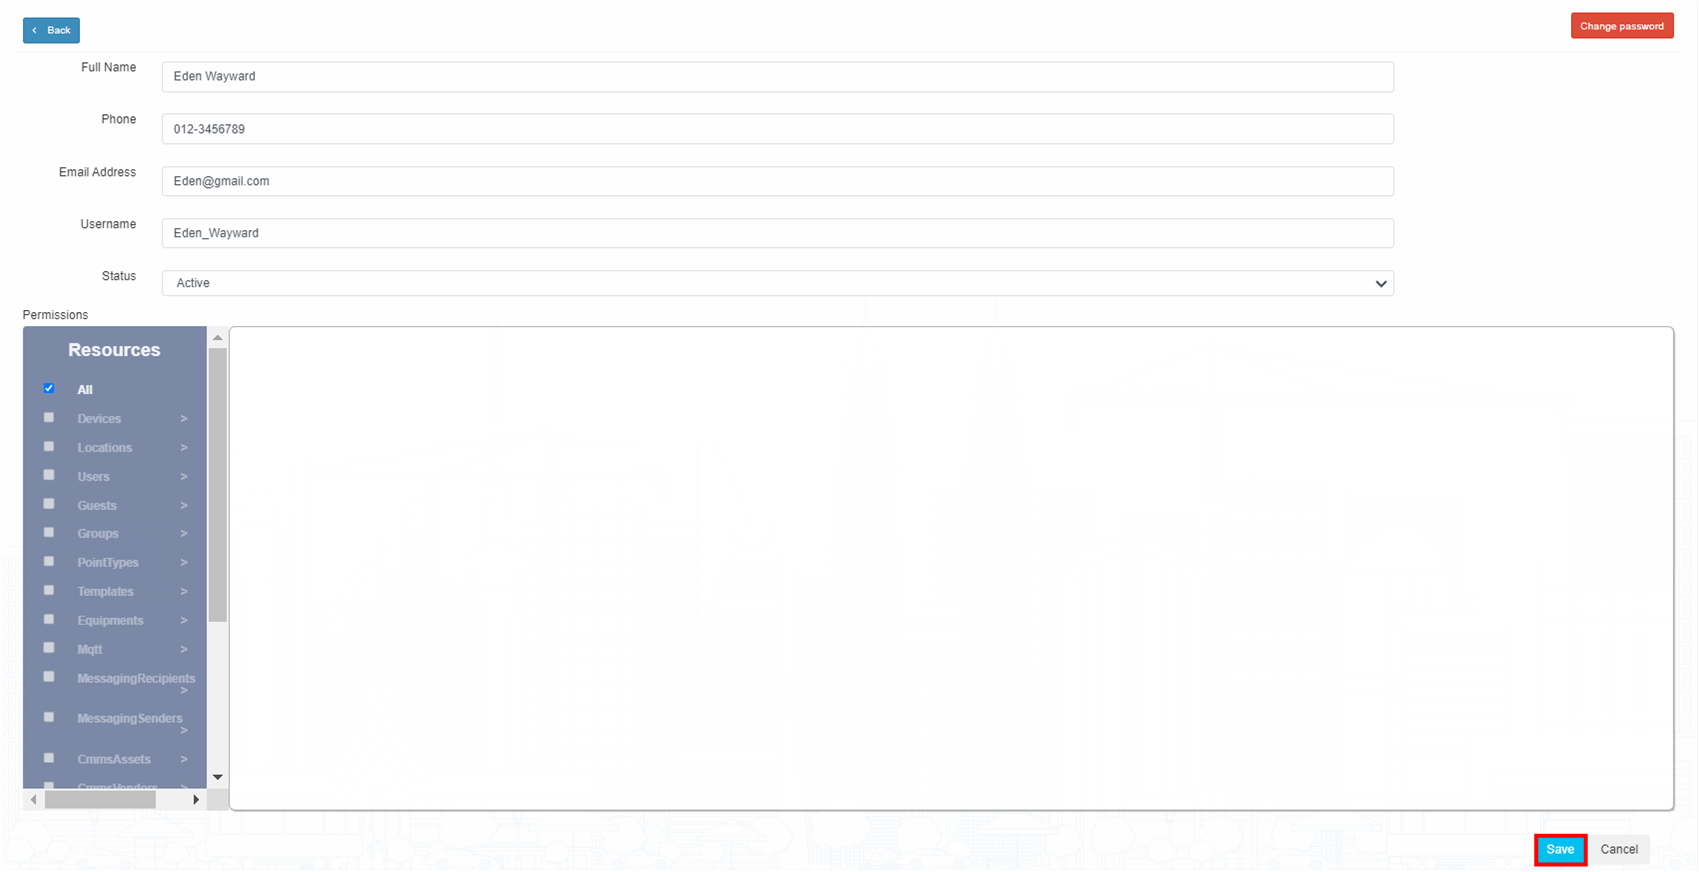
Users in a workspace refer to individuals who have an account and the ability to sign in to a specific workspace. These users have access to the features, resources, and information within that workspace, allowing them to collaborate, communicate, and perform various tasks as part of the shared environment.
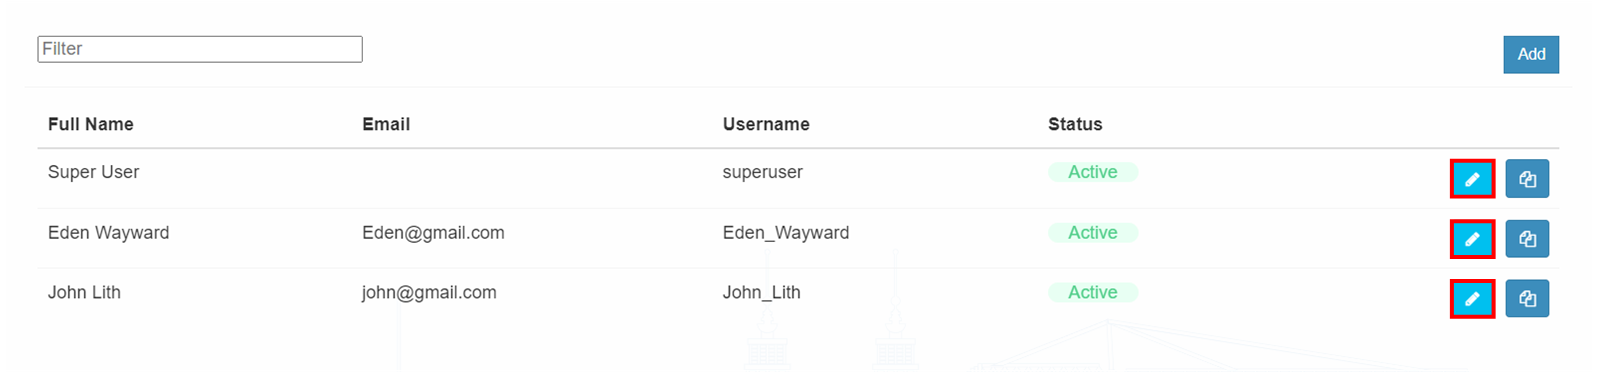
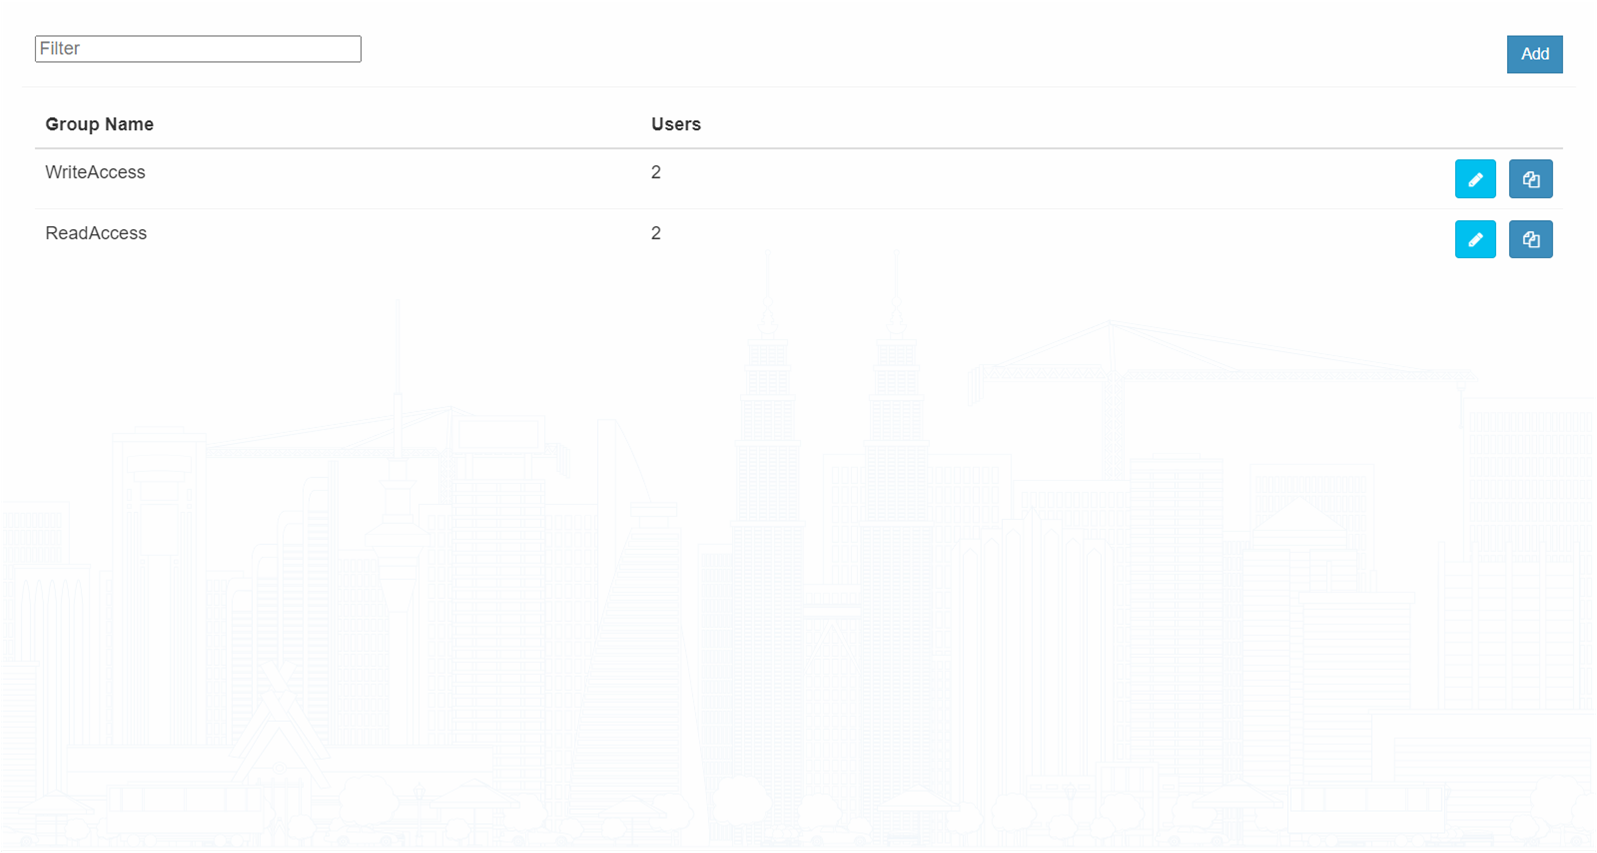
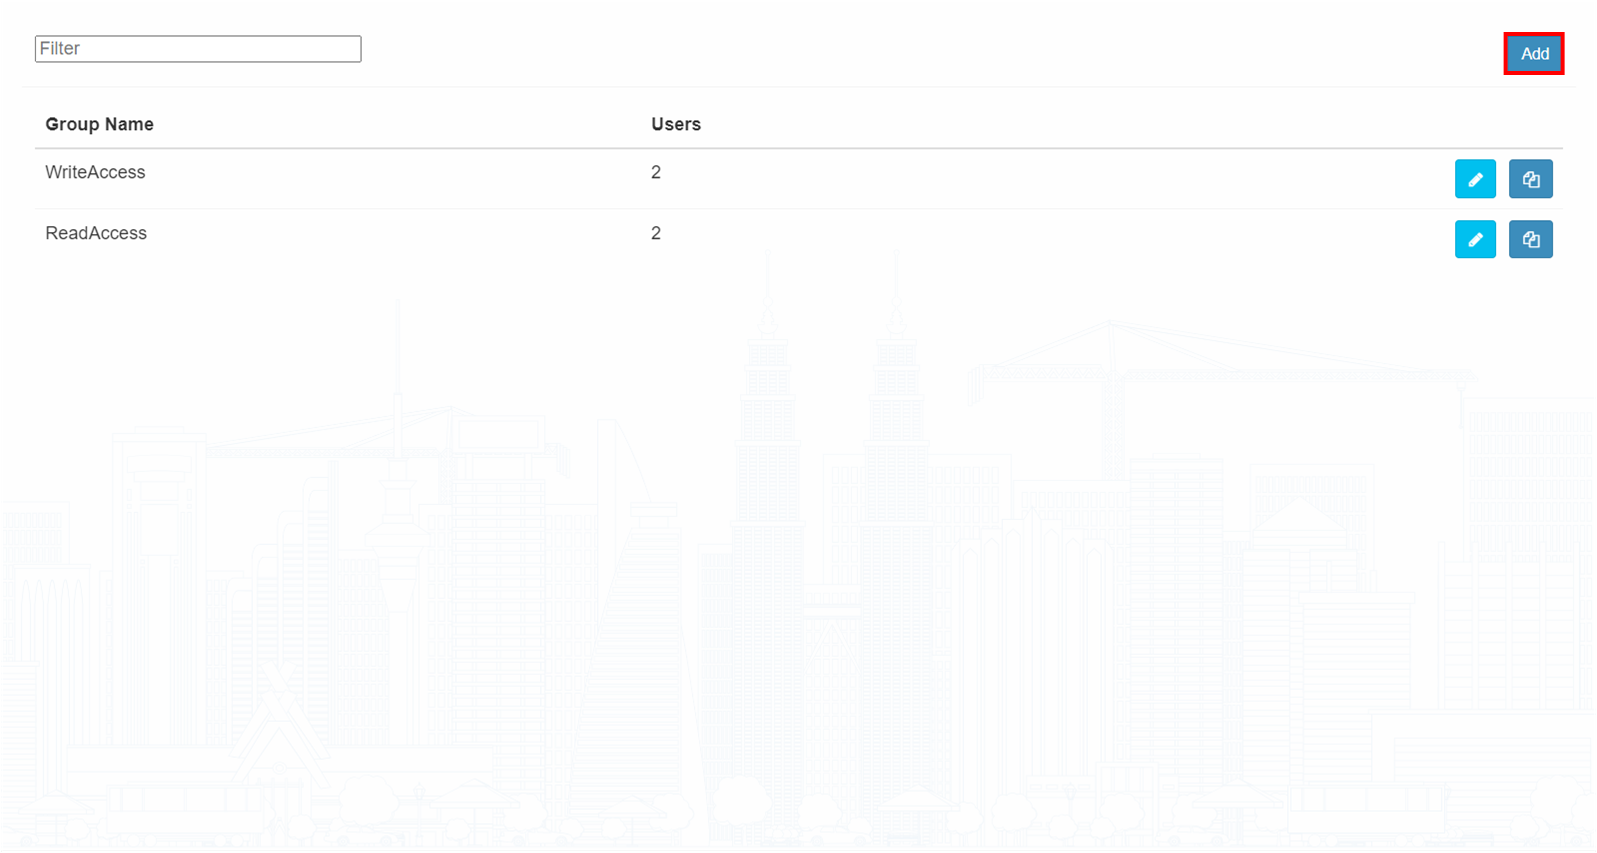
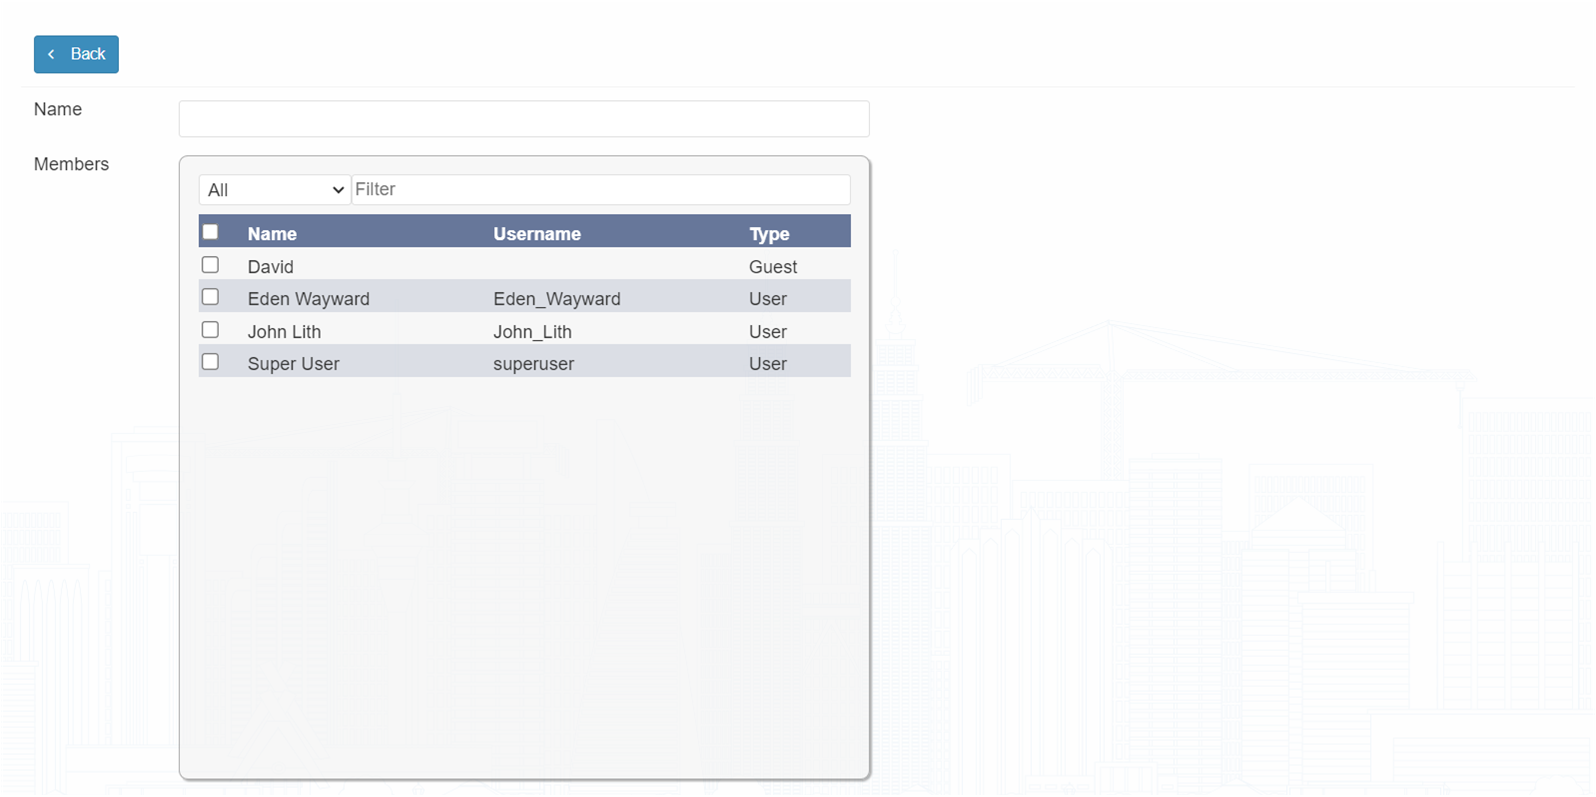
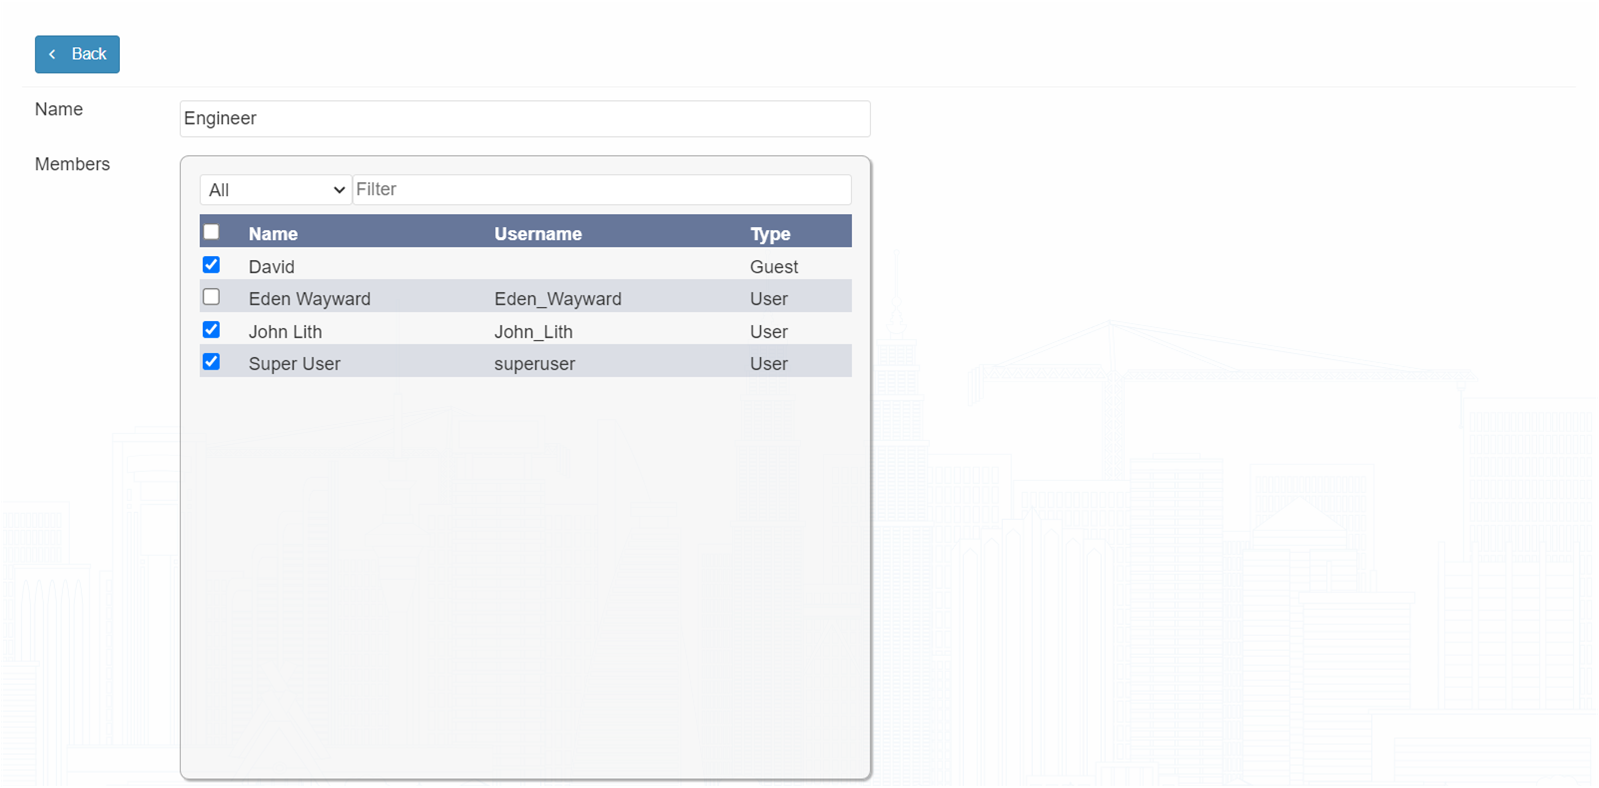
A user group is an access control group. A user can join multiple user groups.
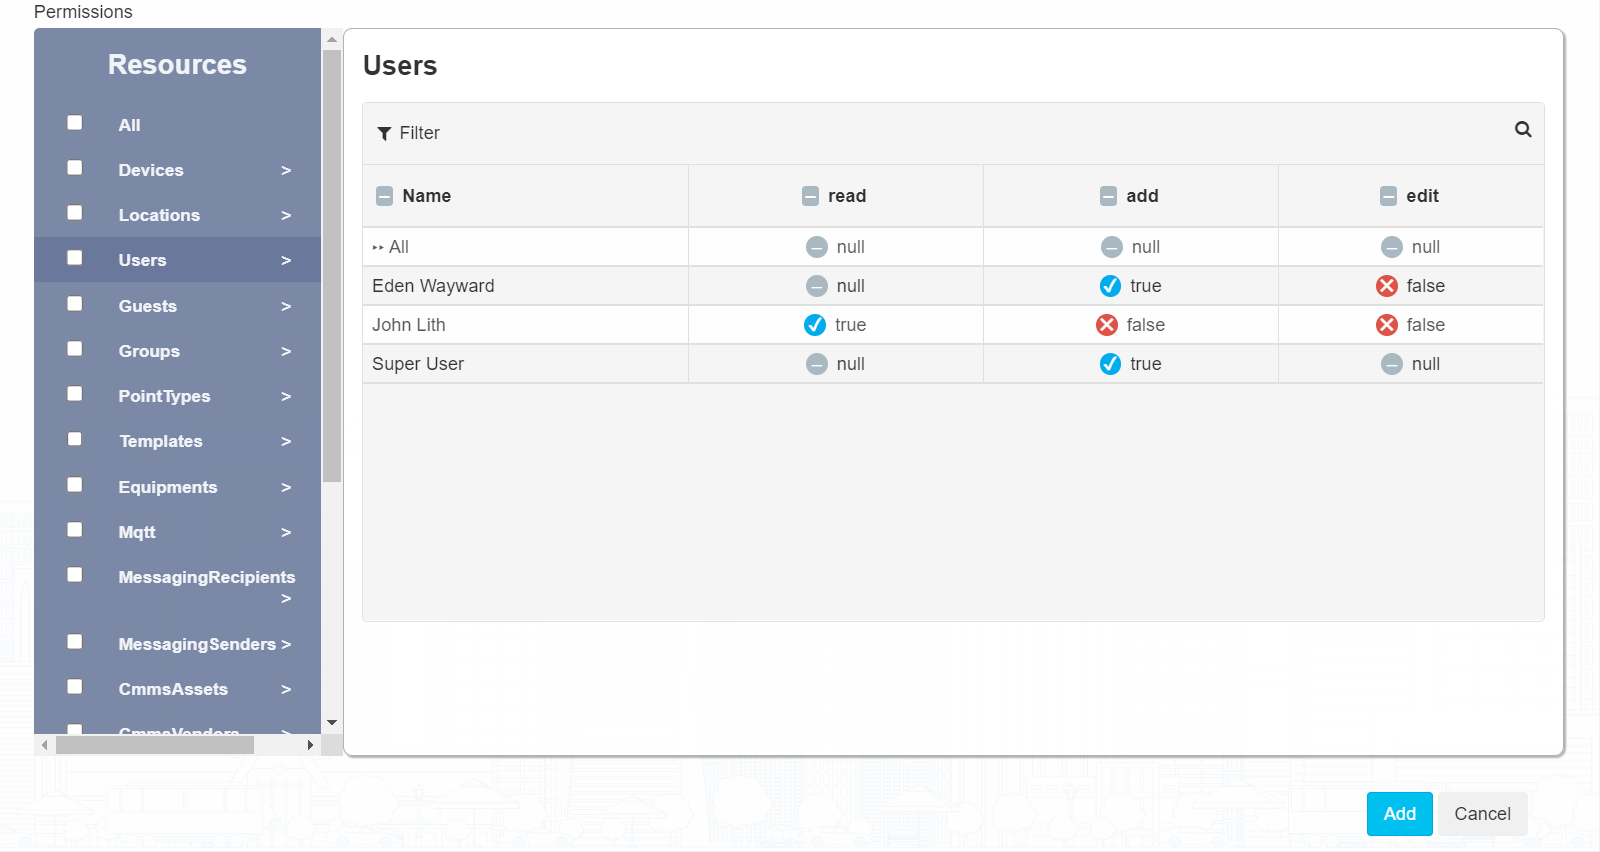
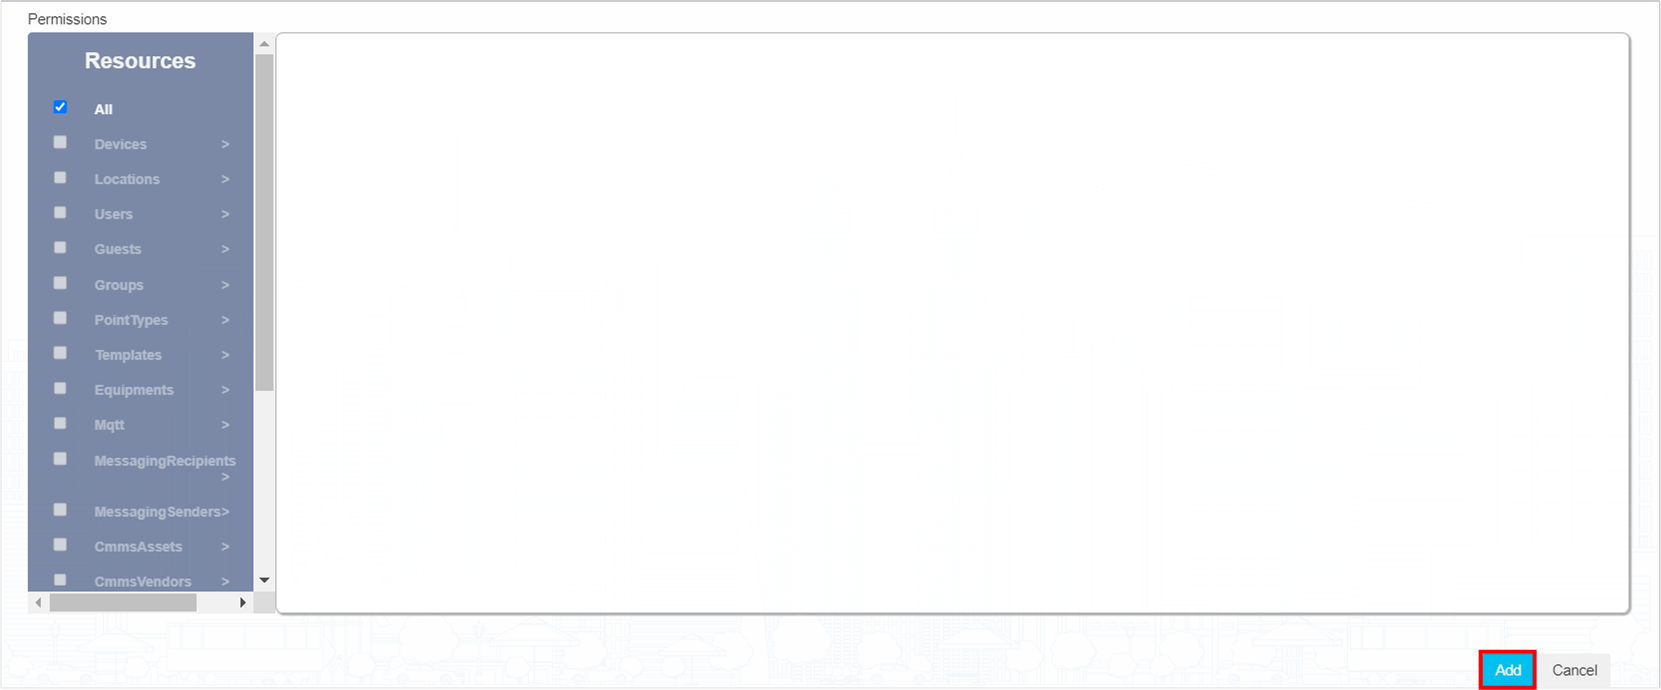

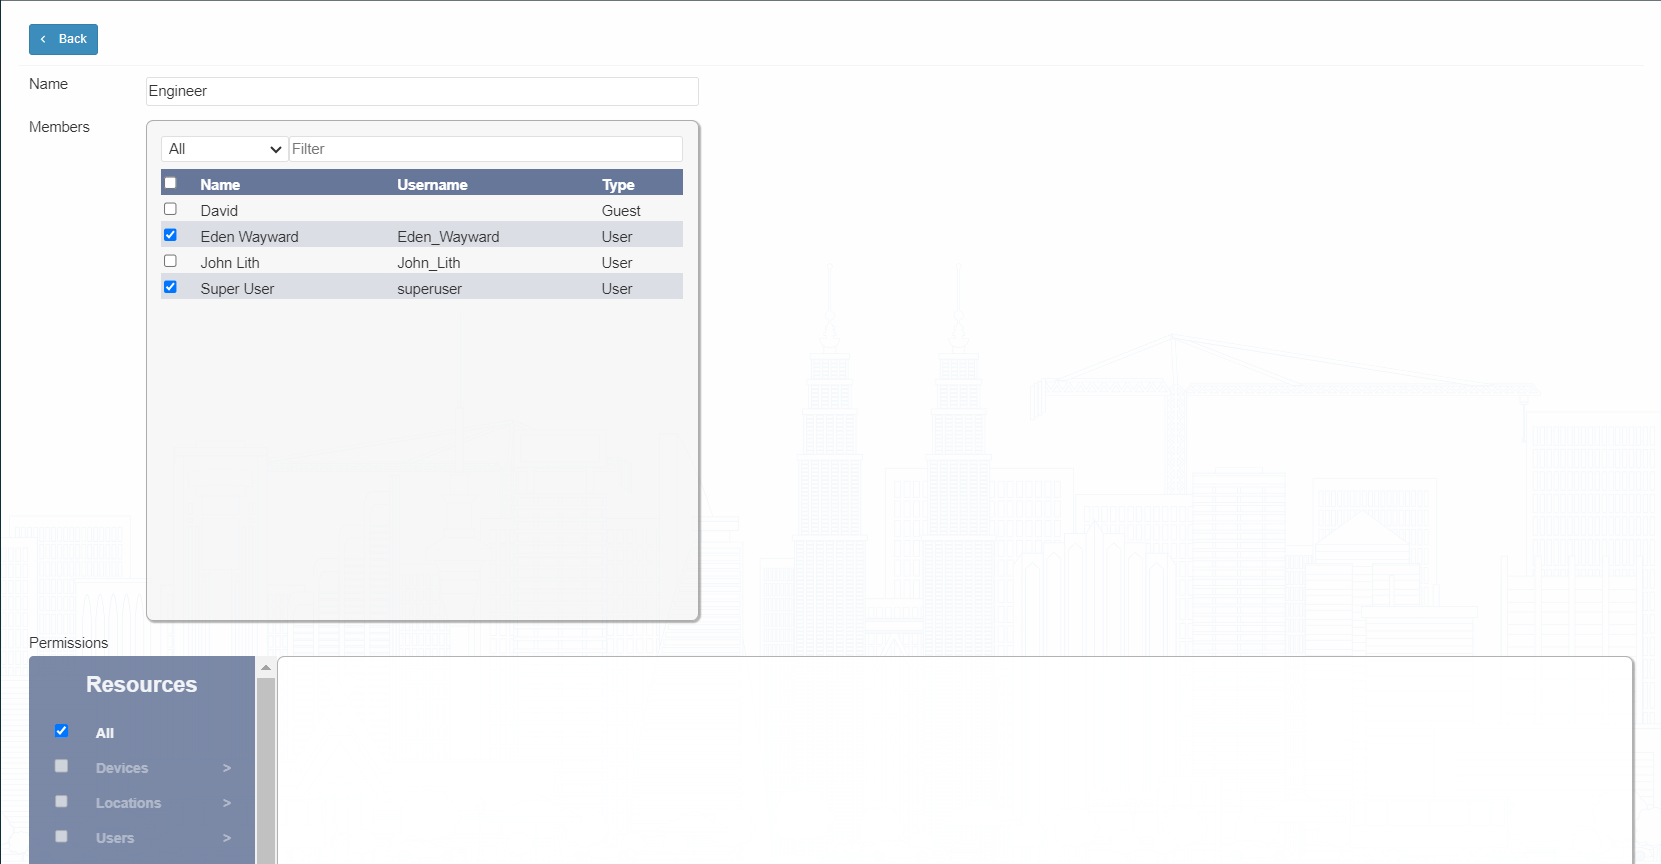
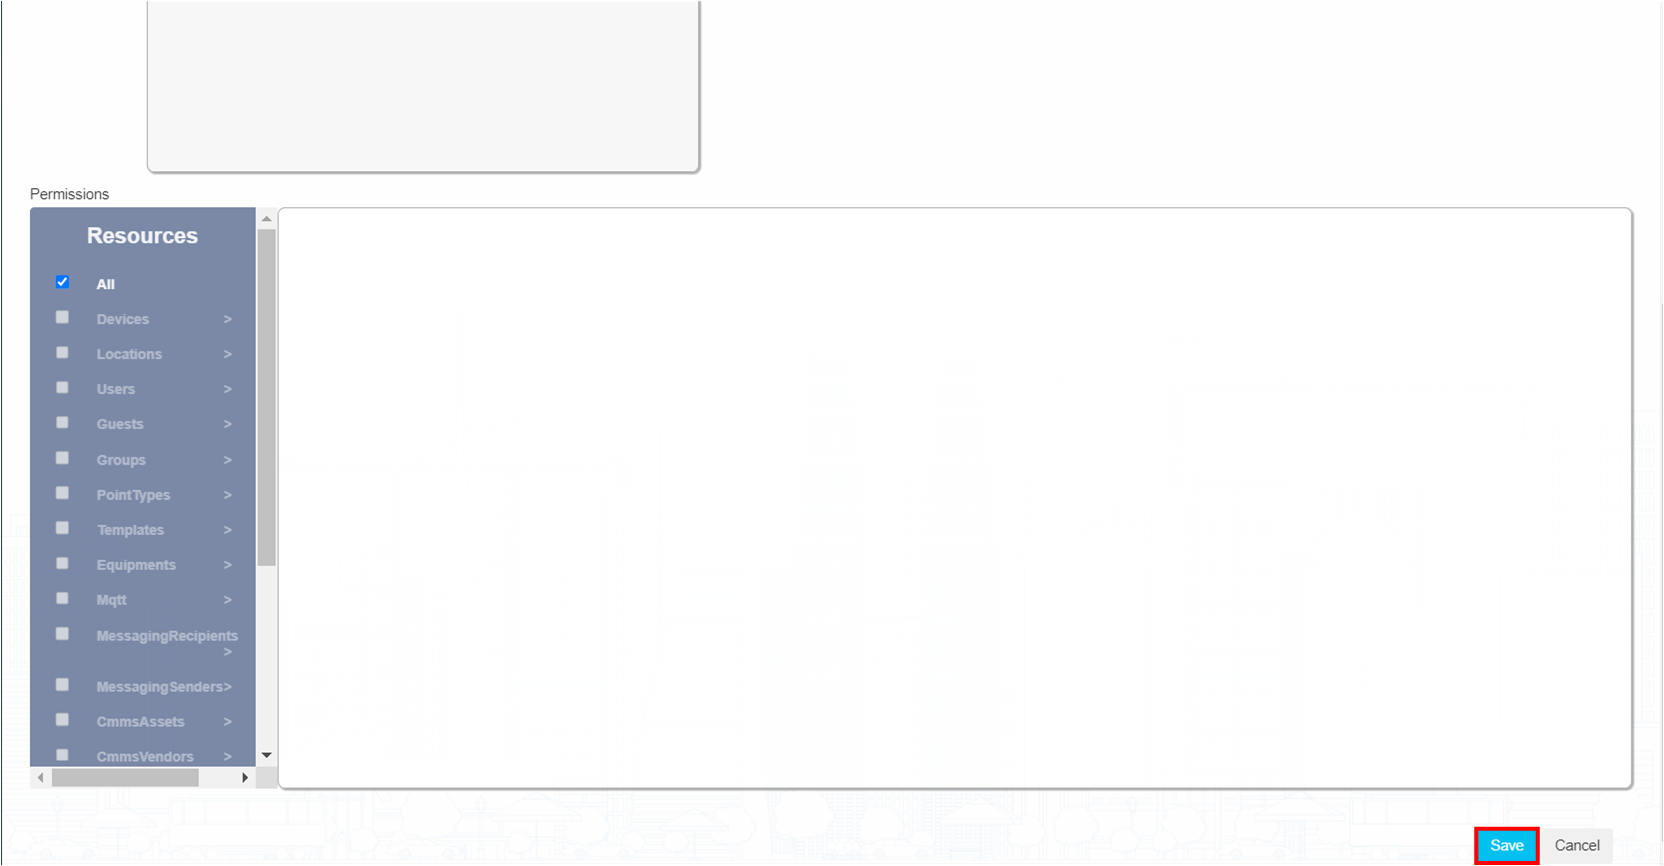



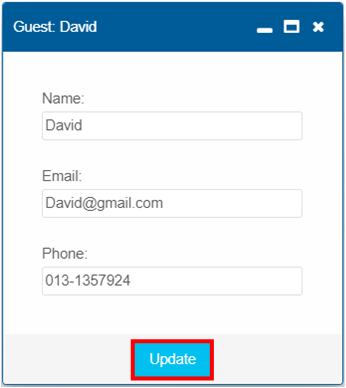
Unlike user's details, permission to change a user password is exclusively granted to the user itself and the workspace's master. There are two ways to change password. Method 1 demonstrates the steps to change user's own password while Method 2 demonstrates the steps to change other user's password or user's own password. To change password using Method 2, users must also have "Read" and "Edit" permission on "Users" resources as the page is only accessible with these permissions. Unlike Method 1, Method 2 does not require the user's old password. Hence, if someone forgets his/her own password, please contact the workspace's master to reset the password. For the case of changing own password using Method 2, if the user is logged in and has all the permissions stated above, he/she can reset his/her password without providing the old password.
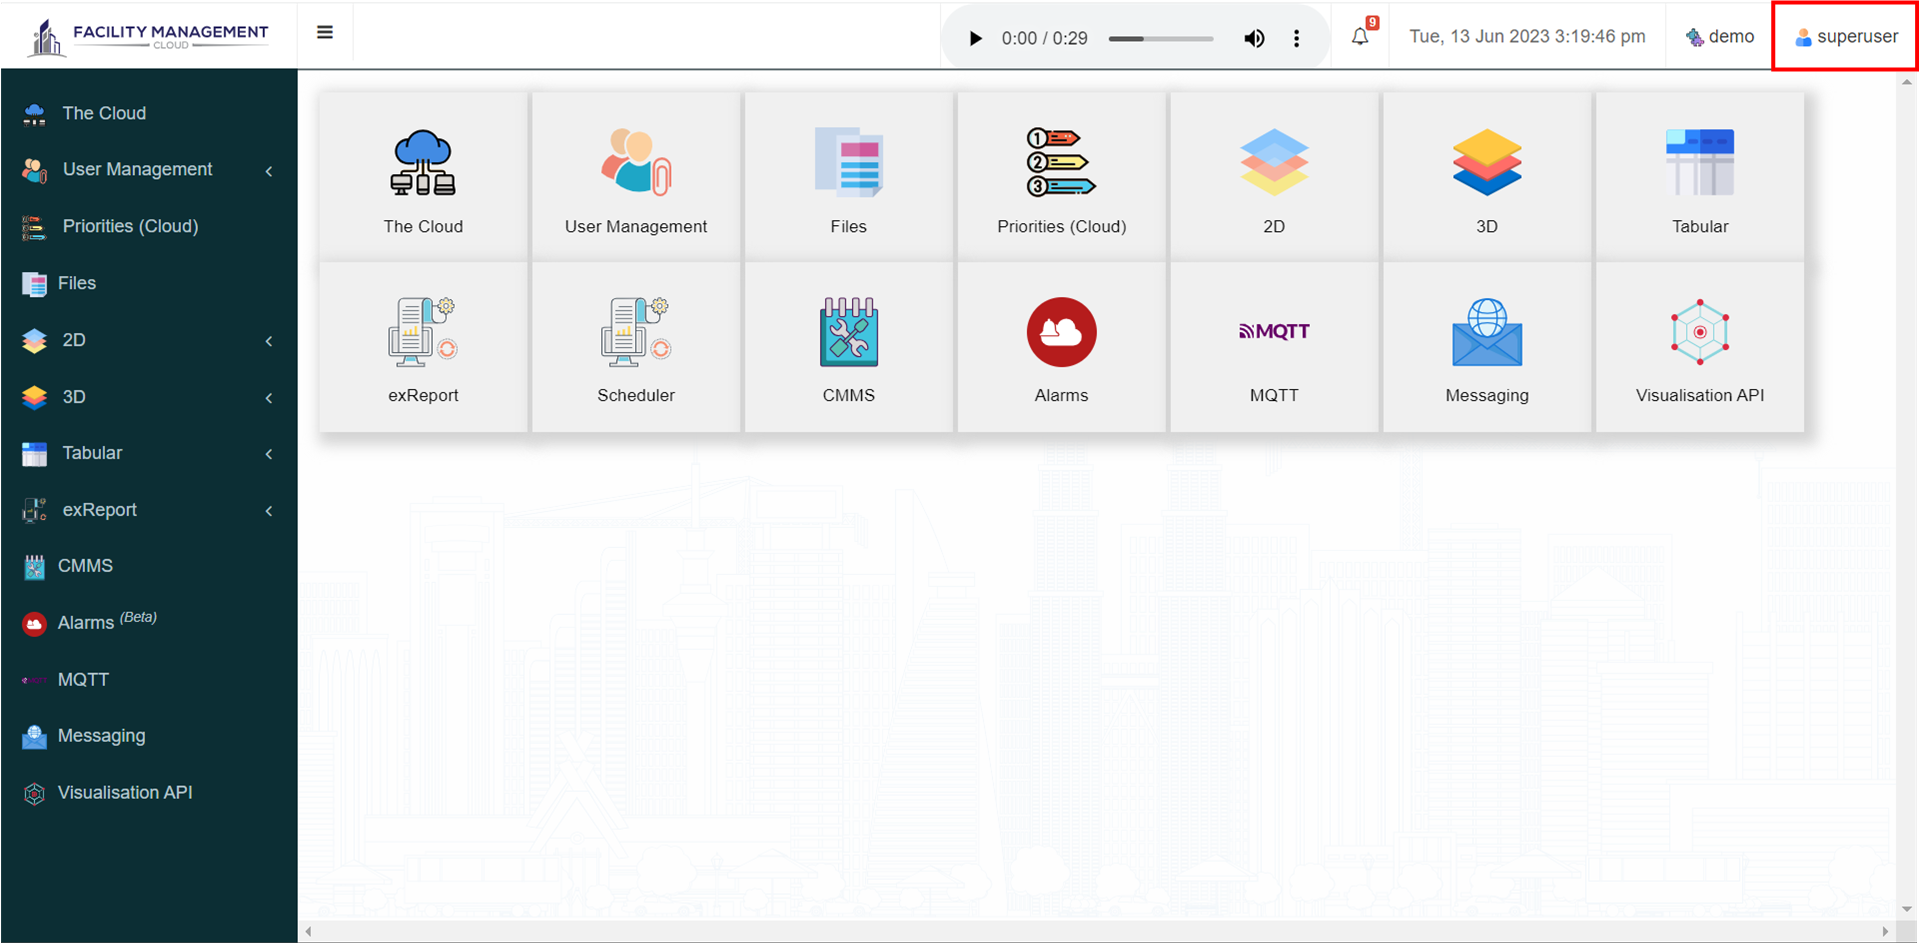
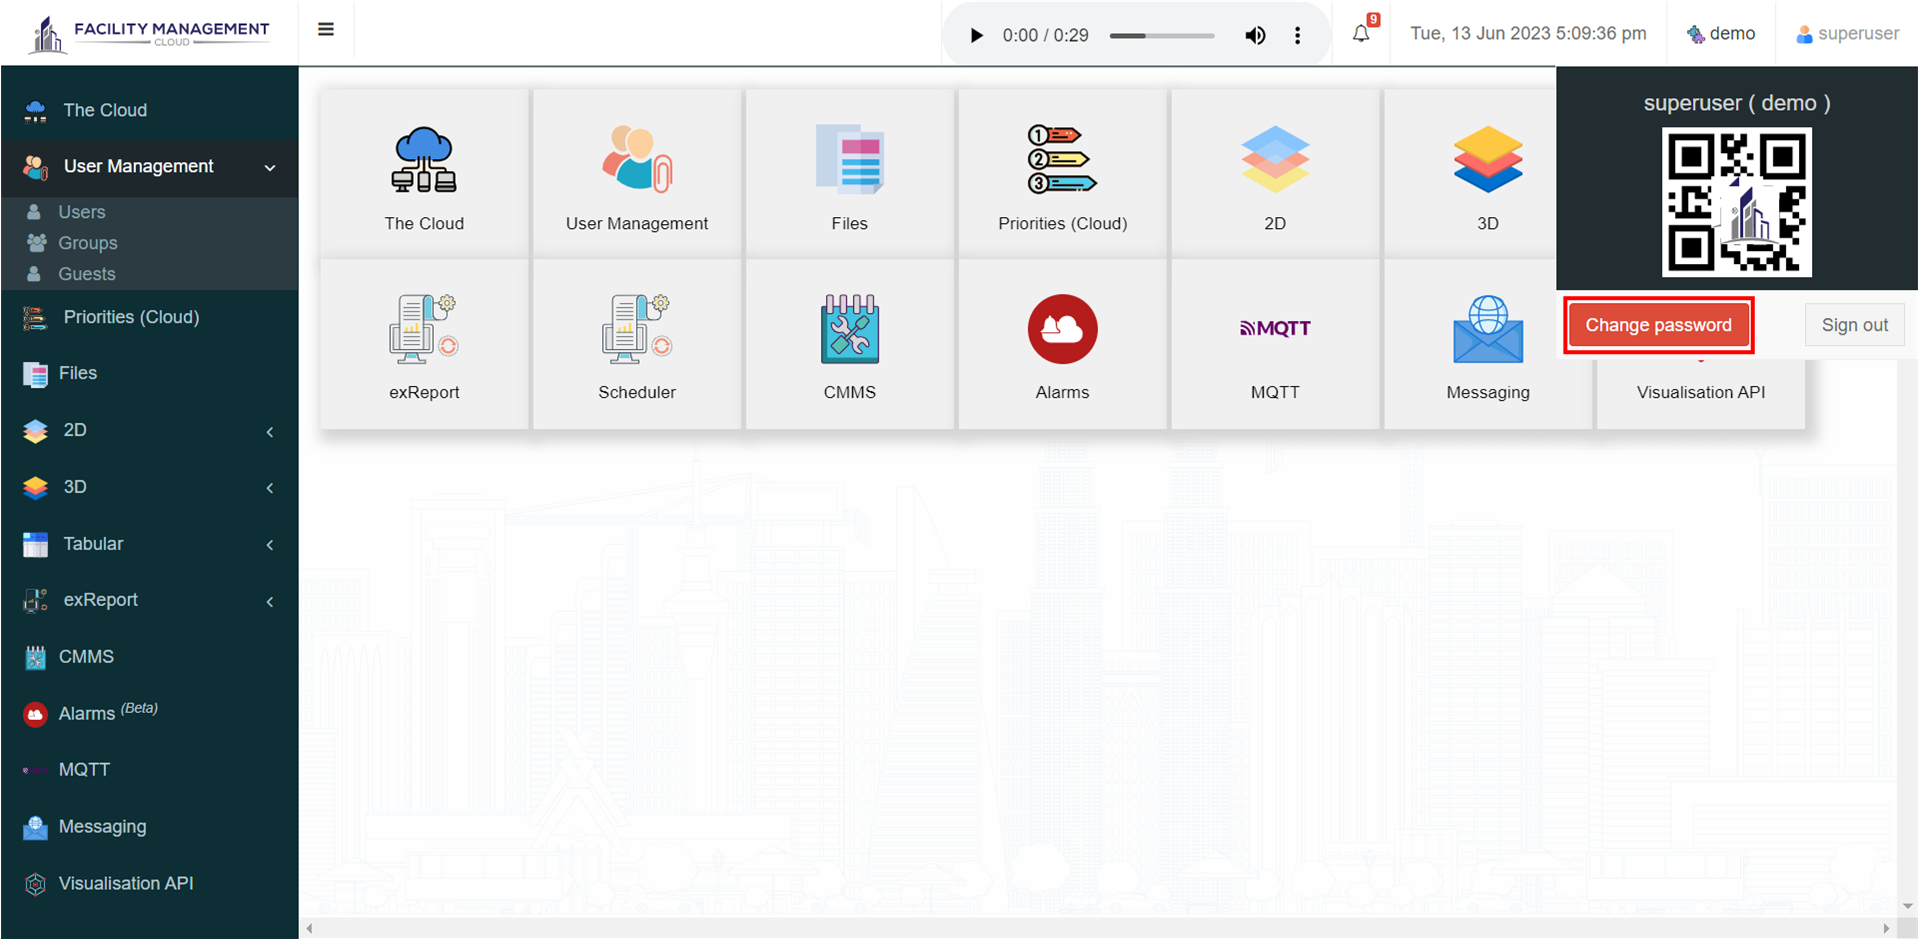
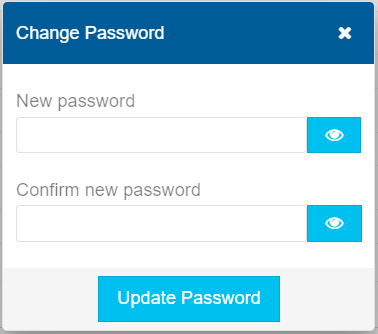
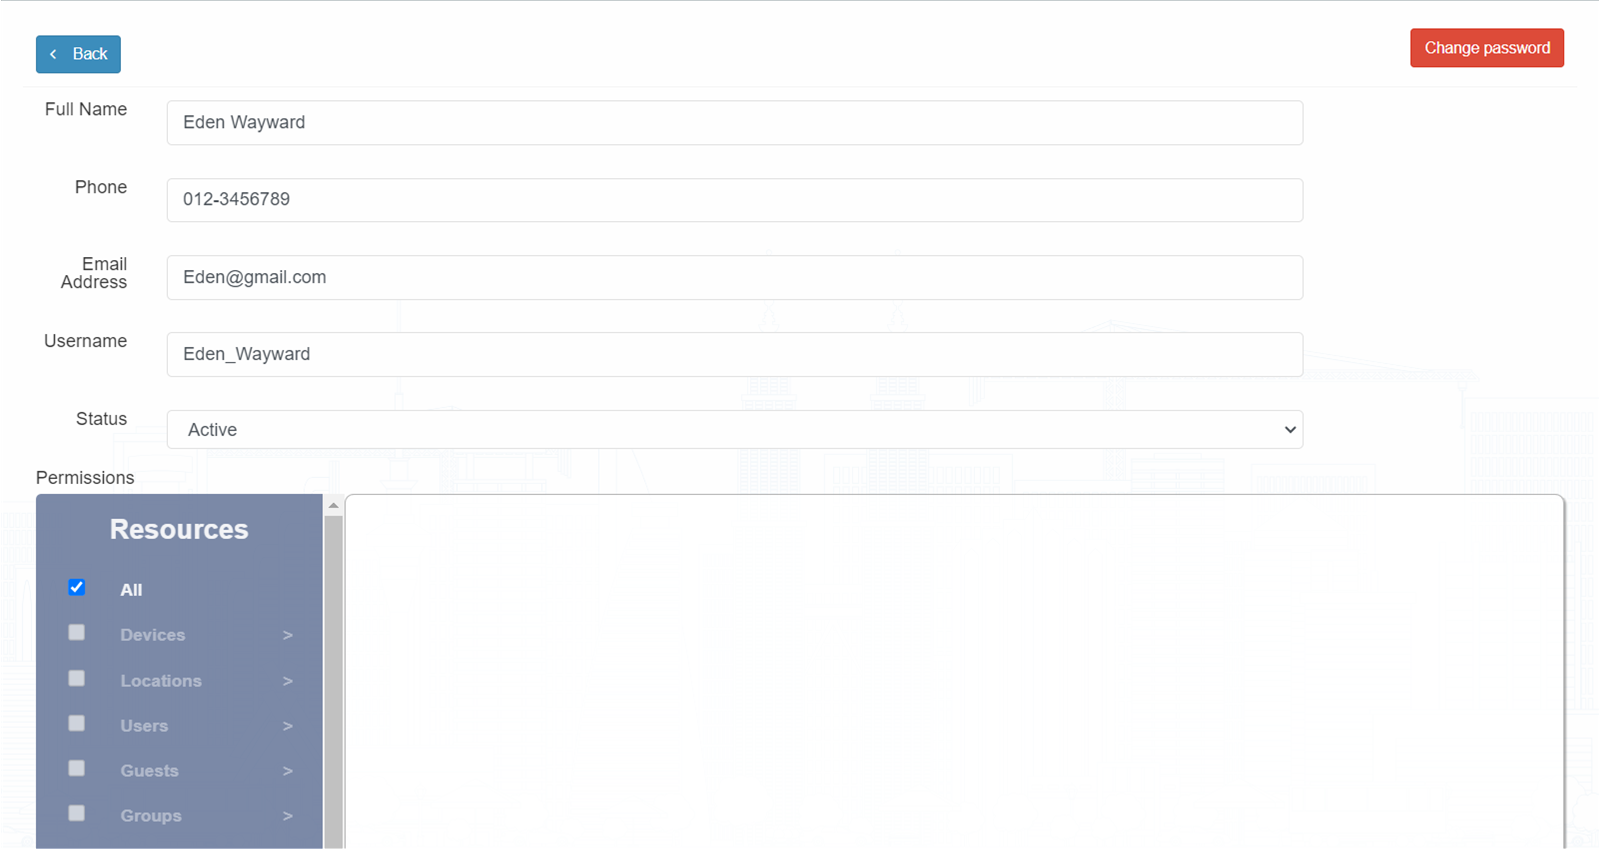
If you have forgotten your password, there are a few ways for you to recover it:
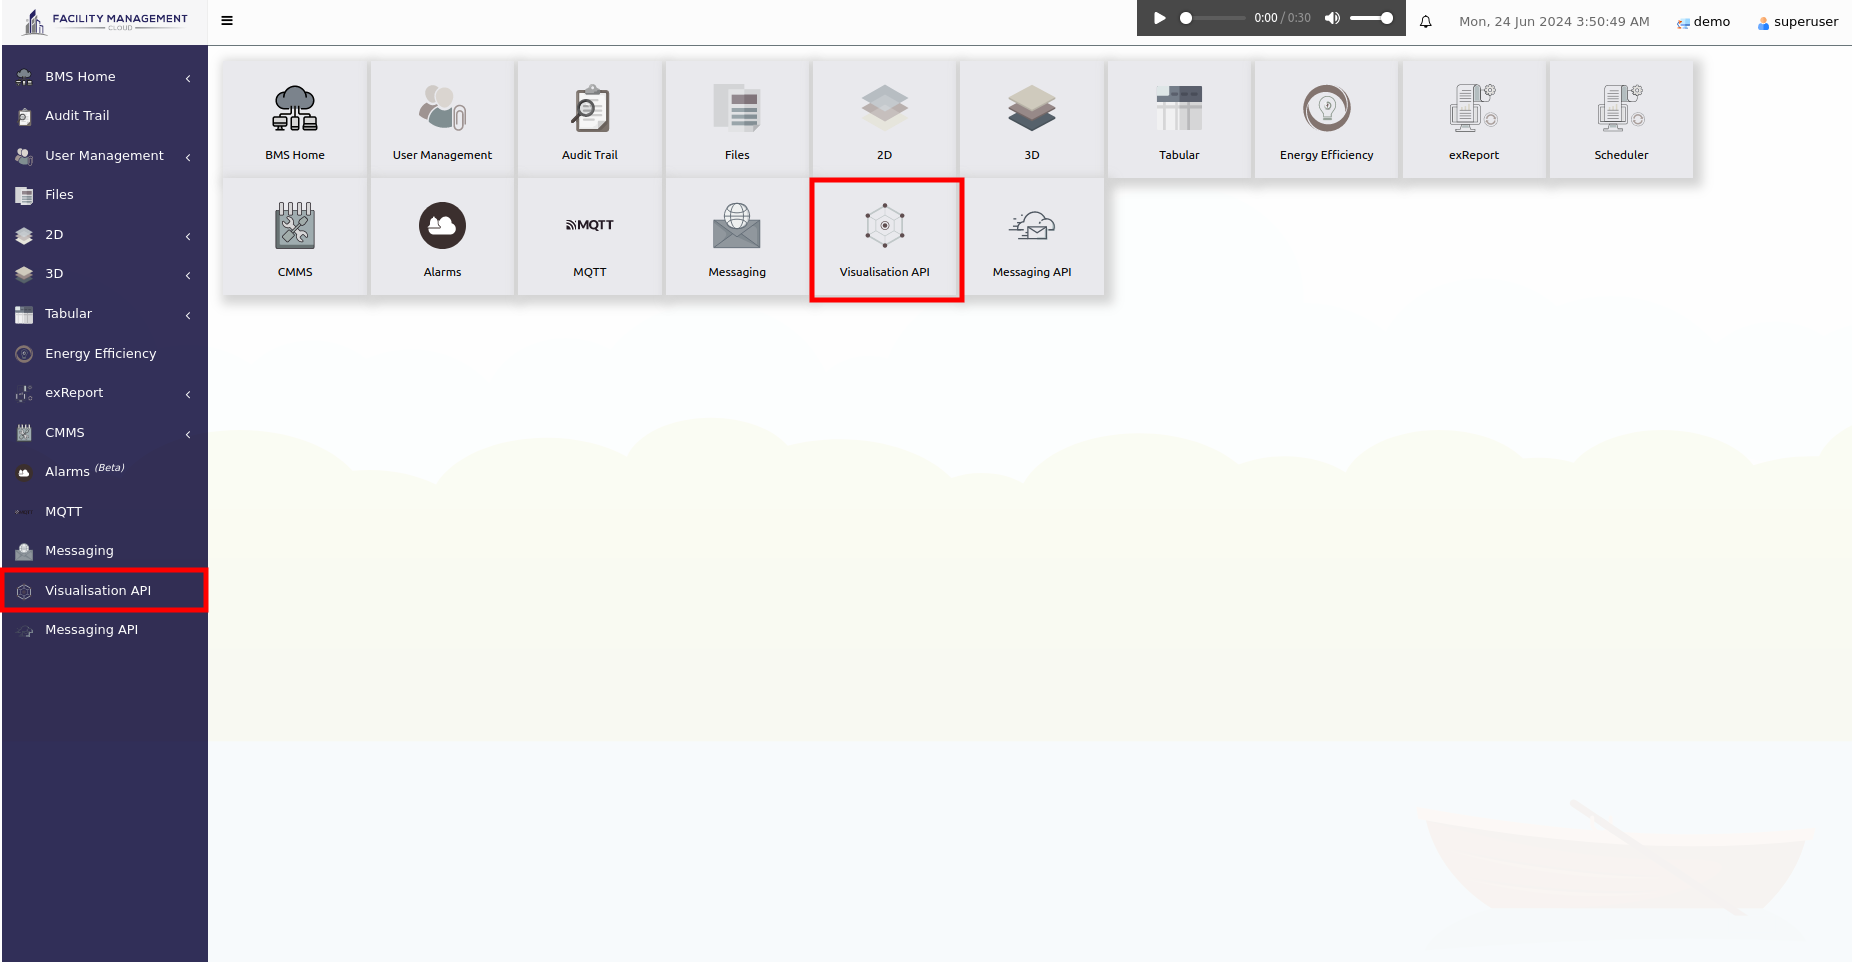
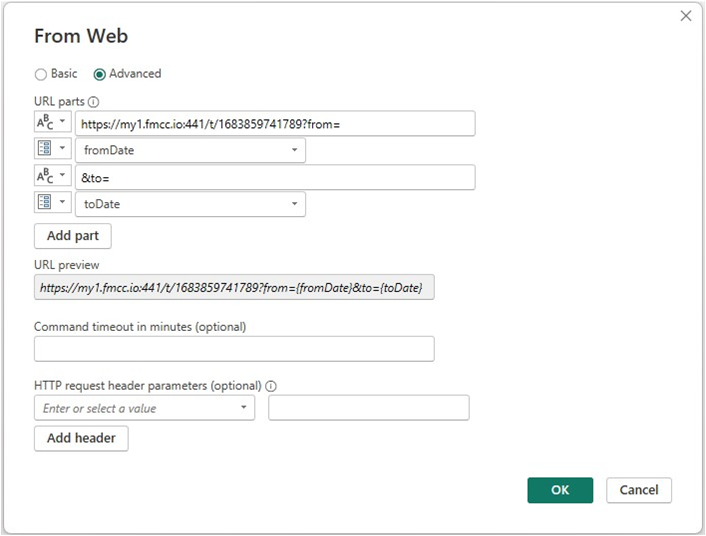
The Visualisation API (VAPI) is a software interface that enables developers to interact with and control visualisation technologies. It provides functions and protocols for creating, managing, and monitoring visualisation resources and environments. With Visualisation API, developers can easily integrate visualisation features into their software systems, including the creation and management of virtual machines, networks, and storage volumes. It also provides access to visualisation data for monitoring and automation purposes.
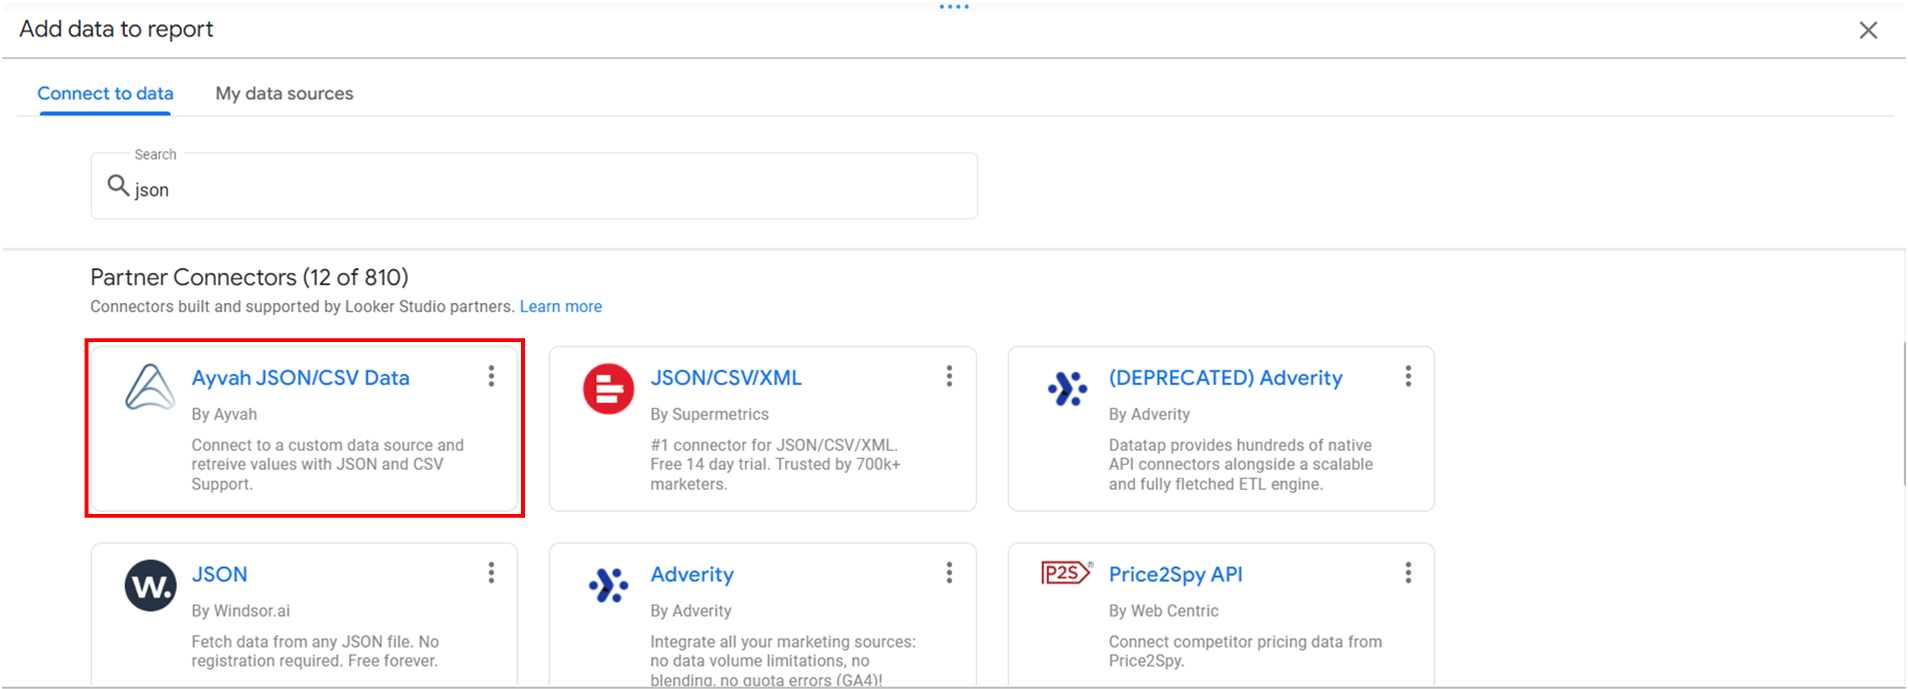
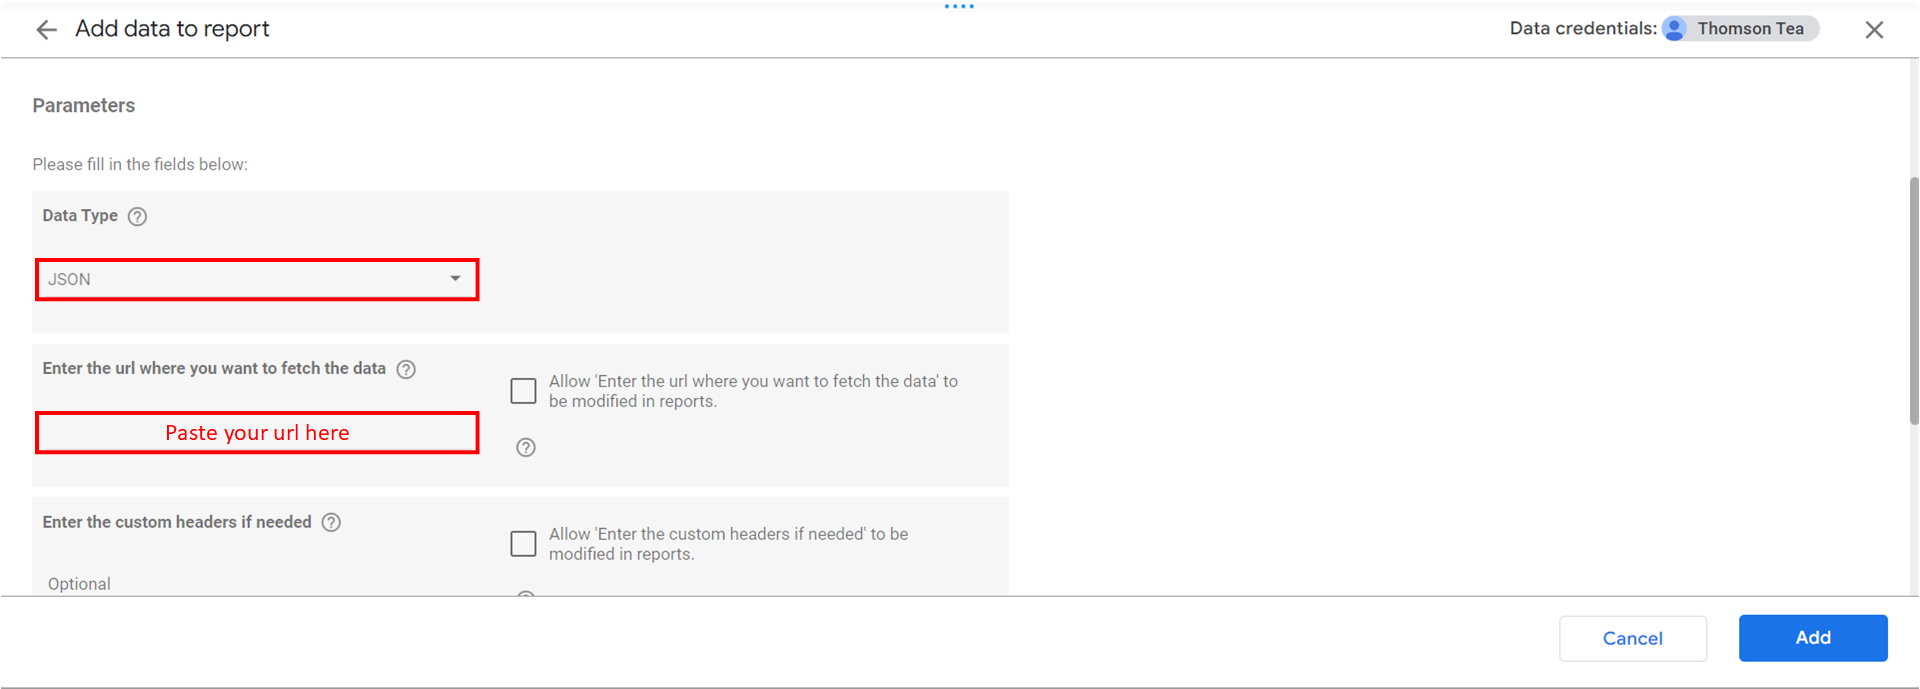
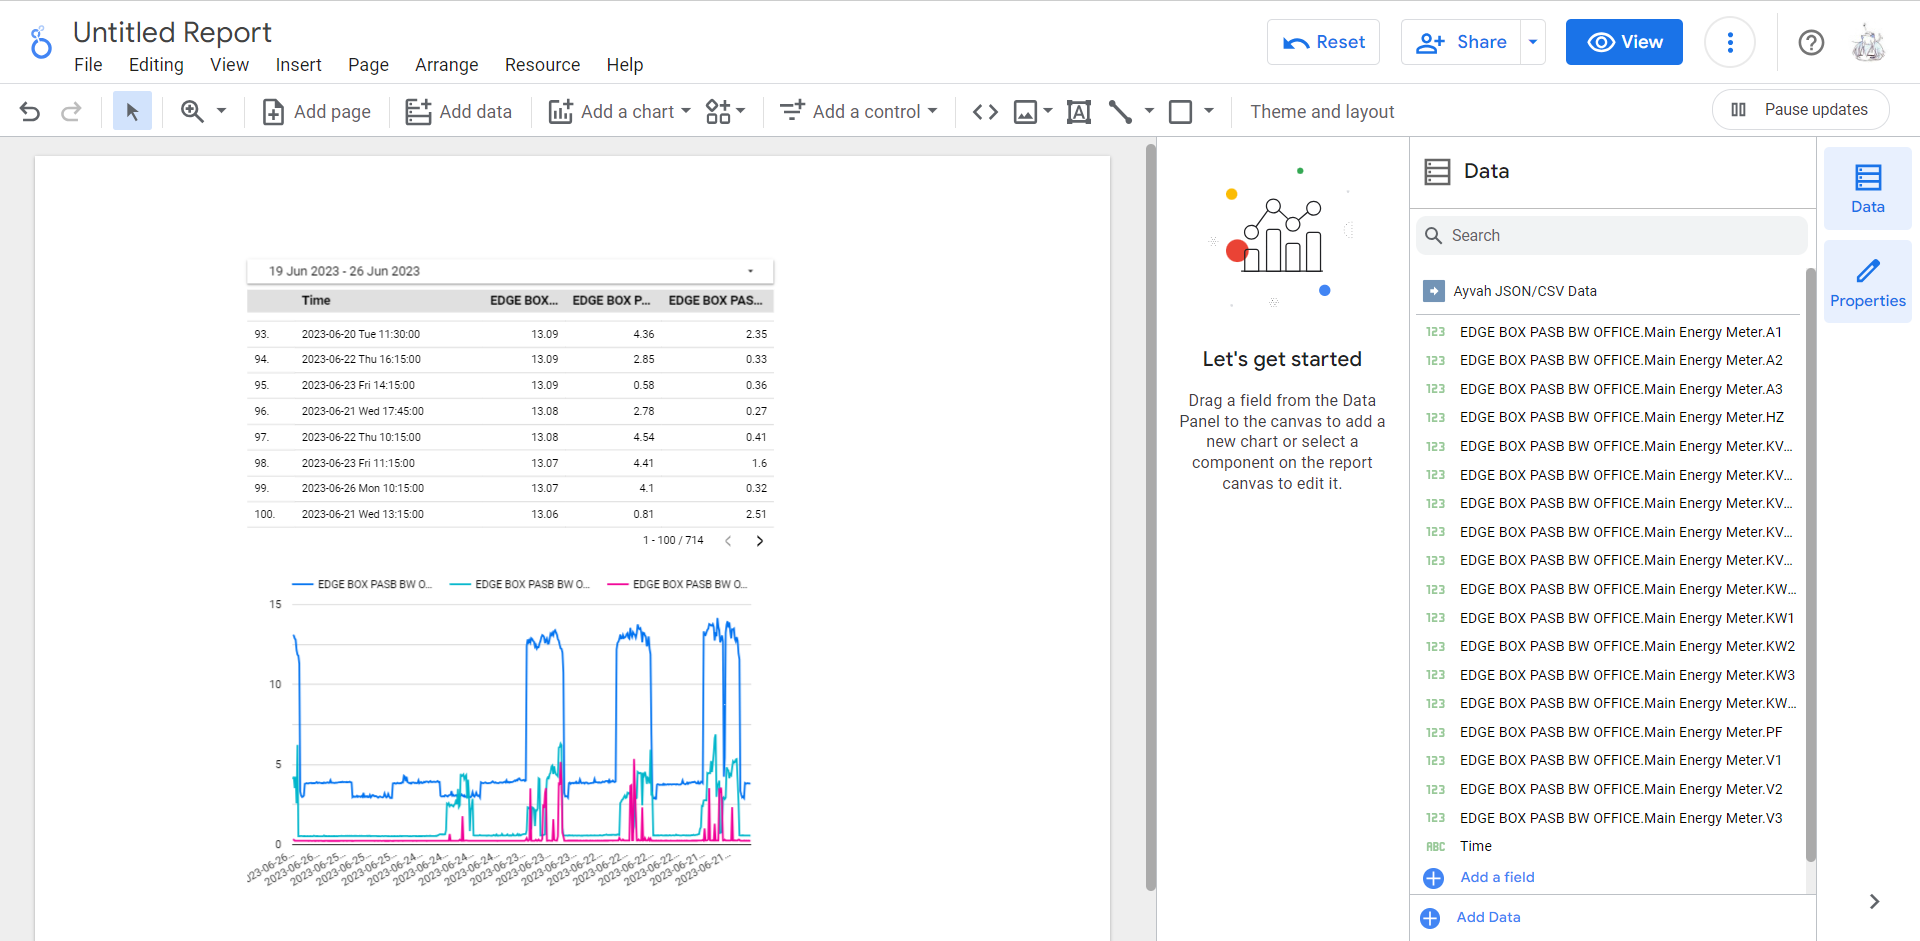
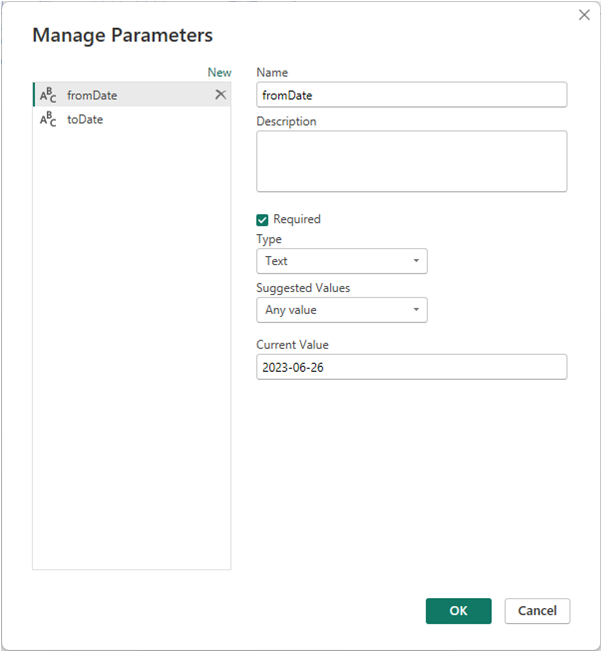
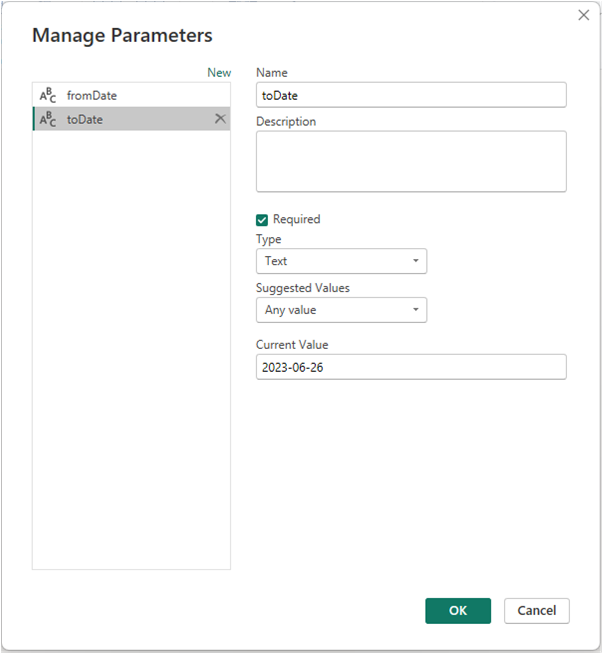
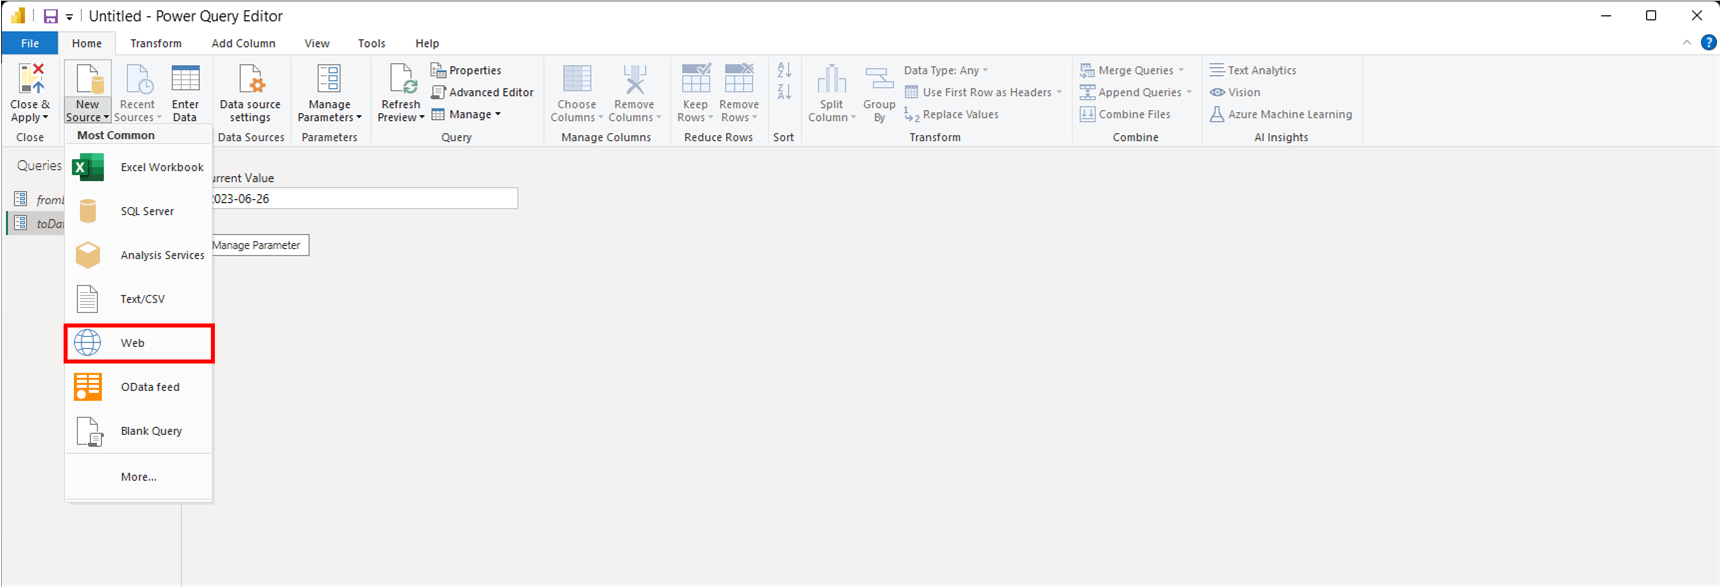
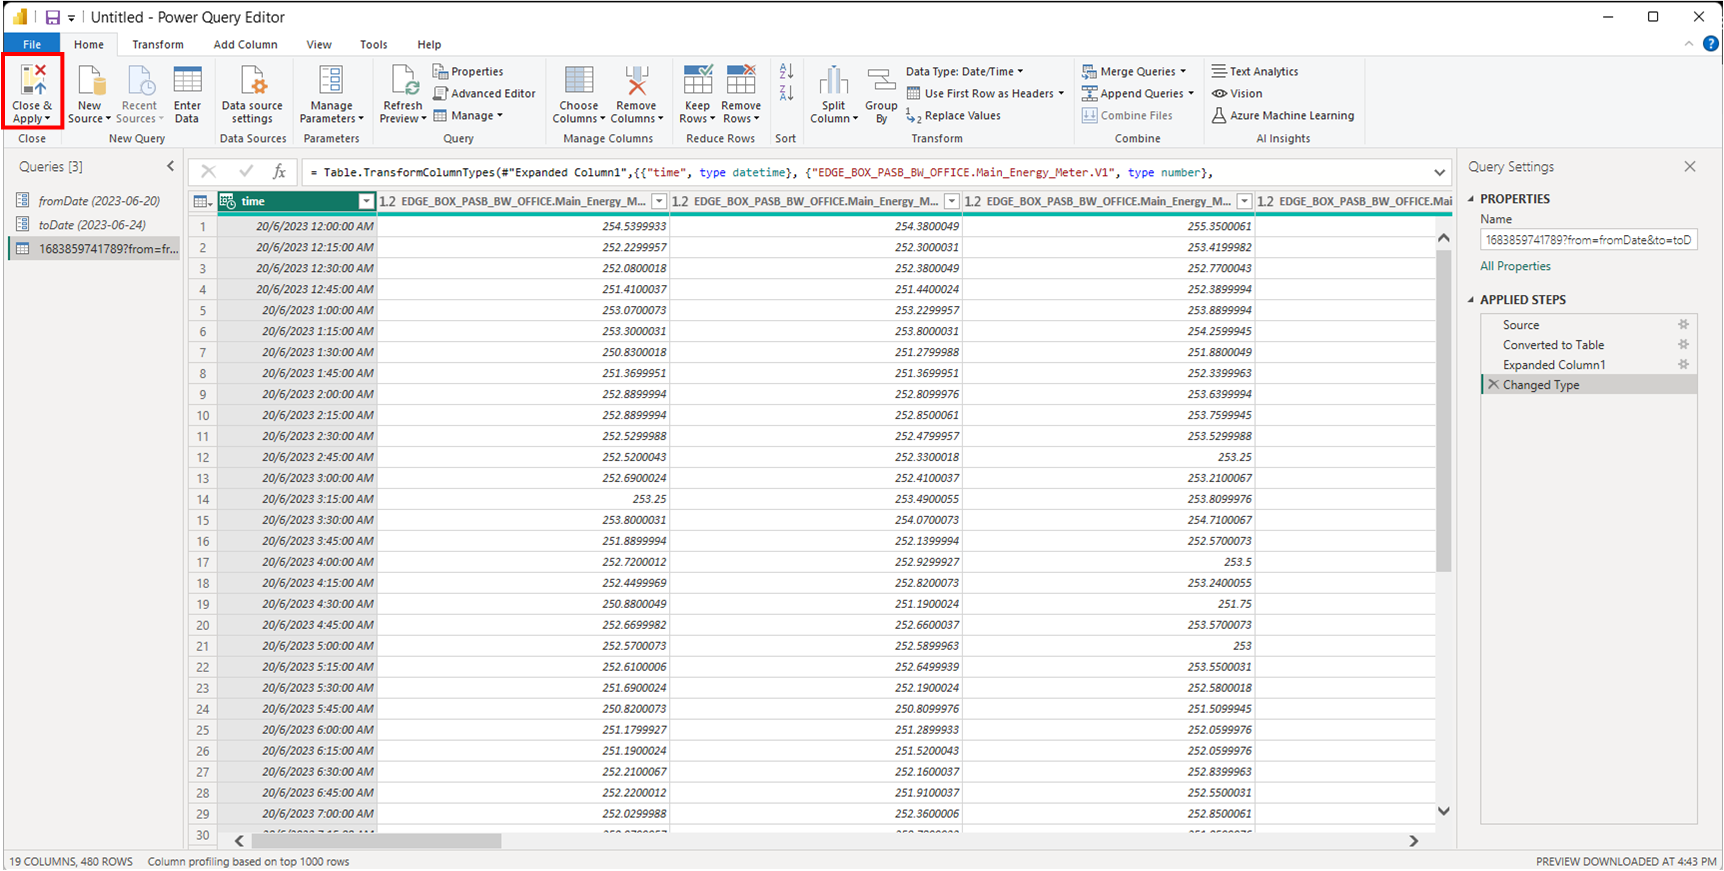
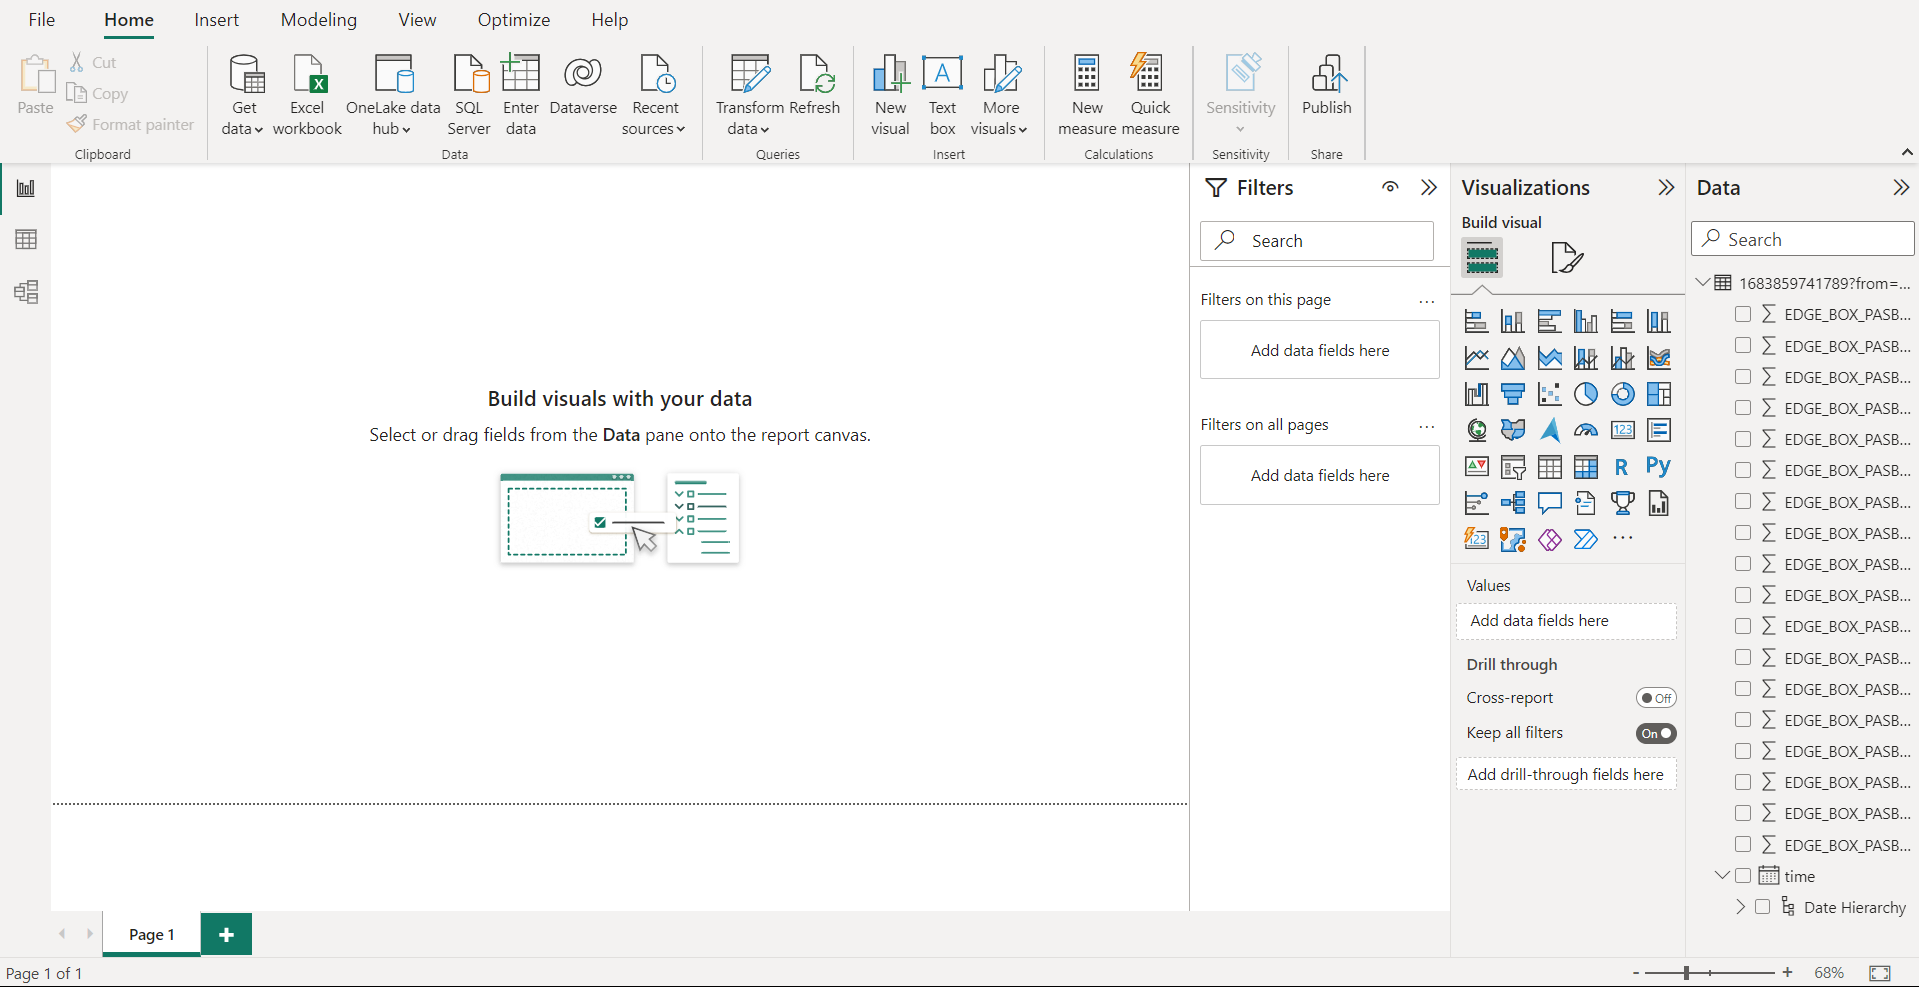
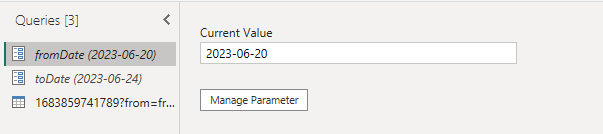
Furthermore, the Visualisation API can be used in conjunction with data visualisation tools like Looker Studio and Power BI. These tools enable users to analyse and present data in a visually appealing and interactive manner. Looker Studio provides a comprehensive suite of data exploration and visualisation features, allowing users to create custom reports, dashboards, and visualisations based on visualisation data. On the other hand, Power BI offers a powerful platform for data visualisation and business intelligence. It allows users to connect to various data sources, including visualisation data, and create insightful visualisations, interactive dashboards, and data-driven reports.
By combining the Visualisation API with Looker Studio and Power BI, organizations can leverage visualisation data to gain valuable insights, identify trends, and make informed decisions. These tools provide a user-friendly interface and robust features for data exploration and visualisation, empowering users to extract meaningful information from visualisation environments and drive business success.
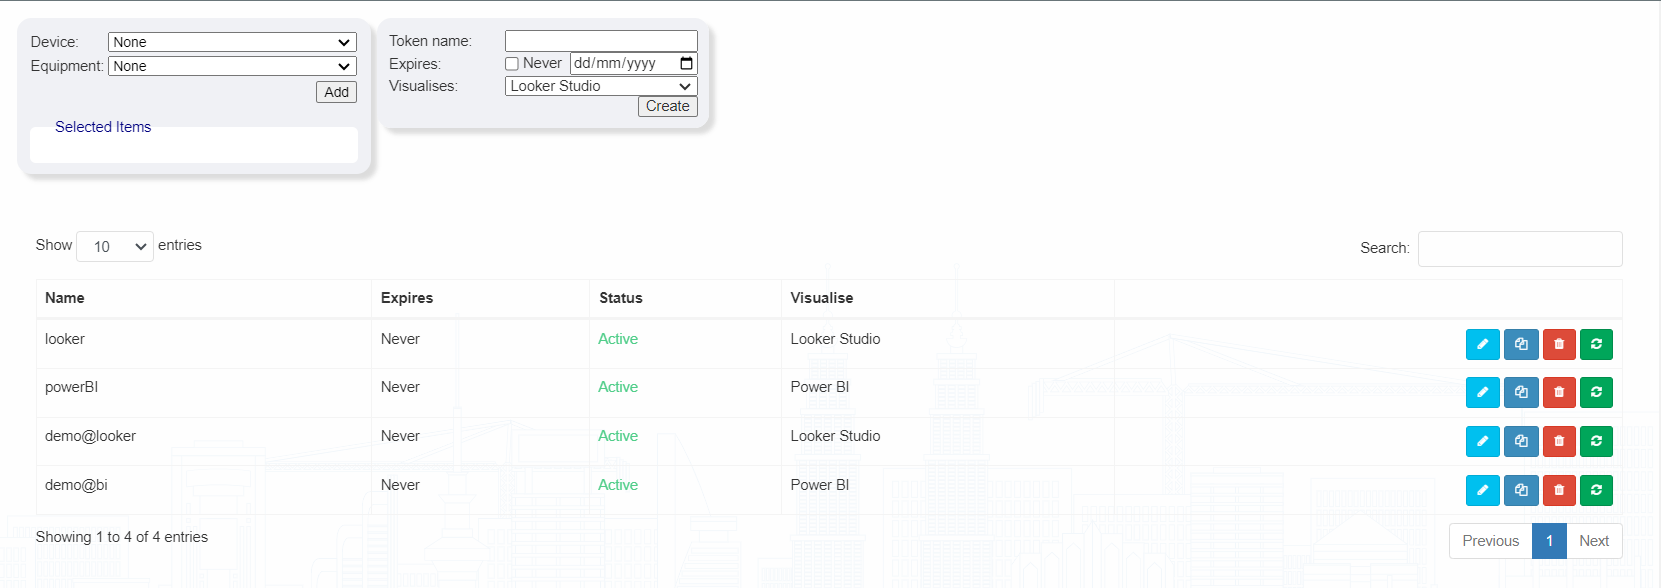
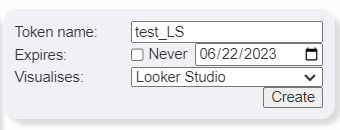
The tokens table displays detailed information about the tokens in the following format:
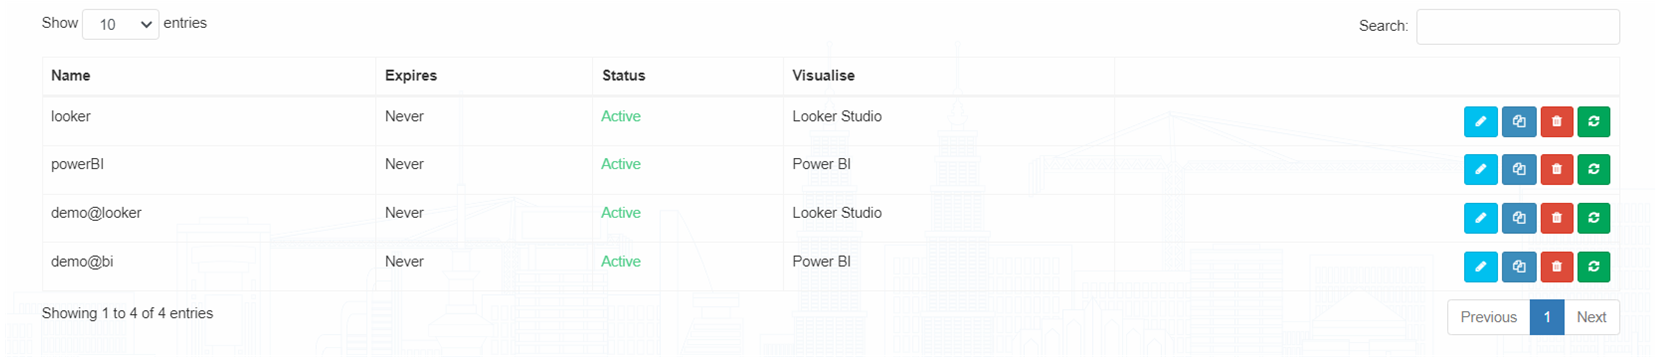
Please note that a token becomes invalid under the following conditions:
It's important to keep track of token expiration dates and ensure that they are active to maintain their validity. Invalid tokens will typically not be accepted by the system or API for authentication or authorization purposes.
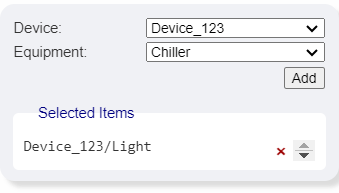
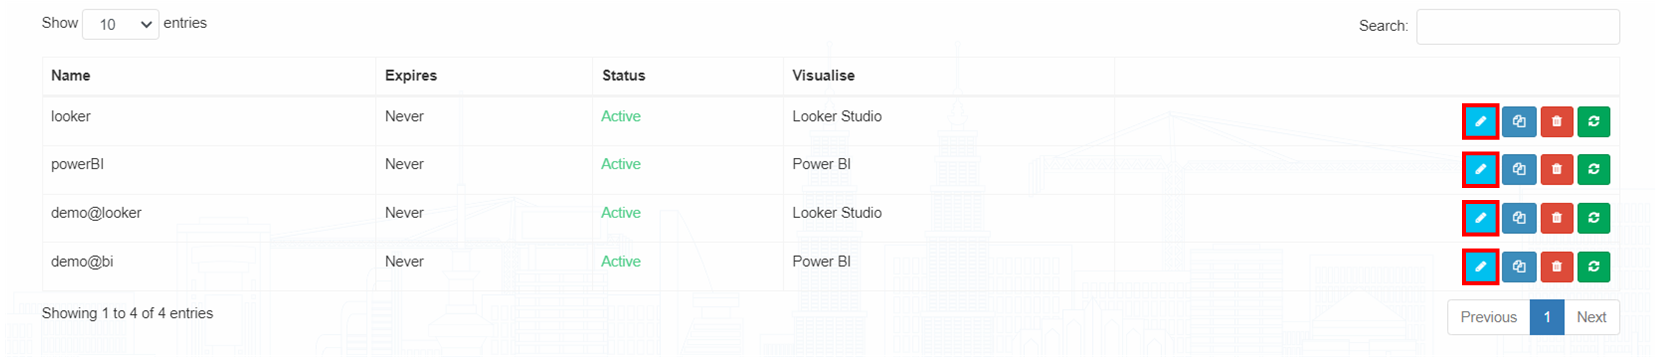
| Aspect | Description |
|---|---|
| Token Name | Users can change the name of the token to provide a more descriptive or meaningful identifier. |
| Expiration Date | Users can adjust the expiration date of the token to control its validity period. This allows for enhanced security and ensures that tokens are only valid for a specified duration. |
| Token Status | Users can update the status of the token, marking it as active or inactive. This can be useful in managing token access and revoking privileges when necessary. |
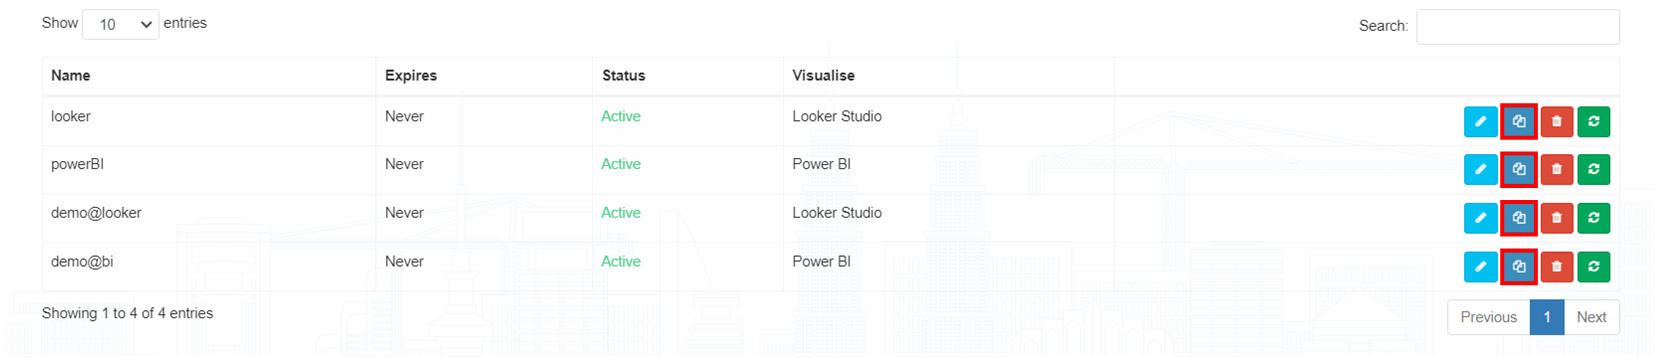
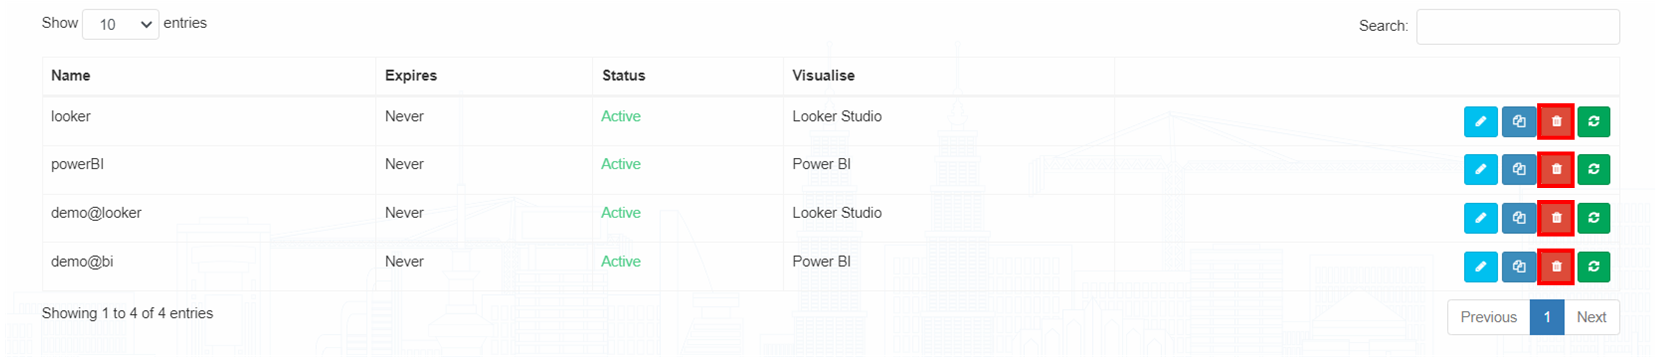
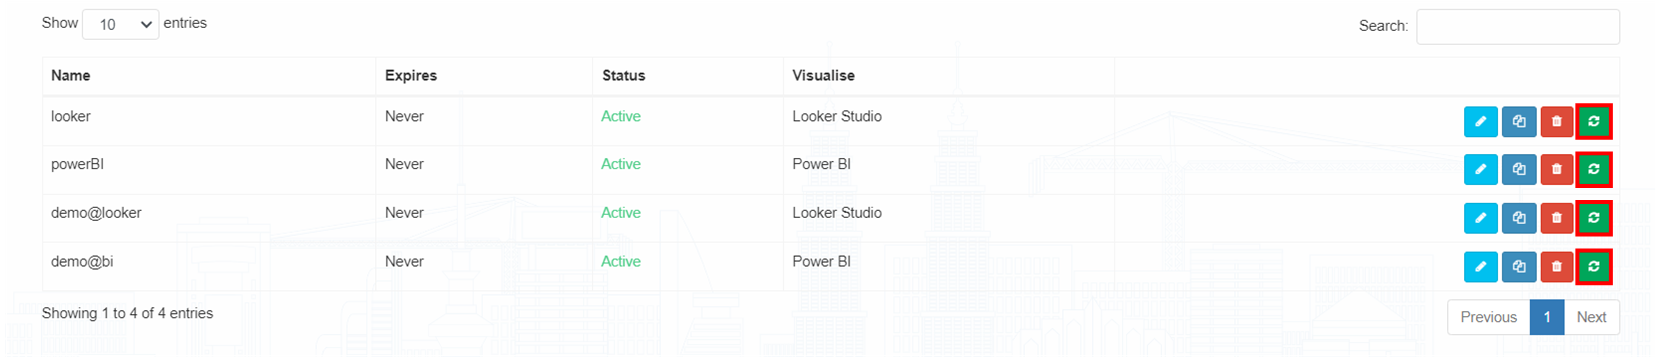
NOTE:When a token is regenerated, its ID will be changed, which means that any previously generated token URLs will become invalid. It is important to update any references or uses of the old token ID with the new one to ensure seamless access and functionality.


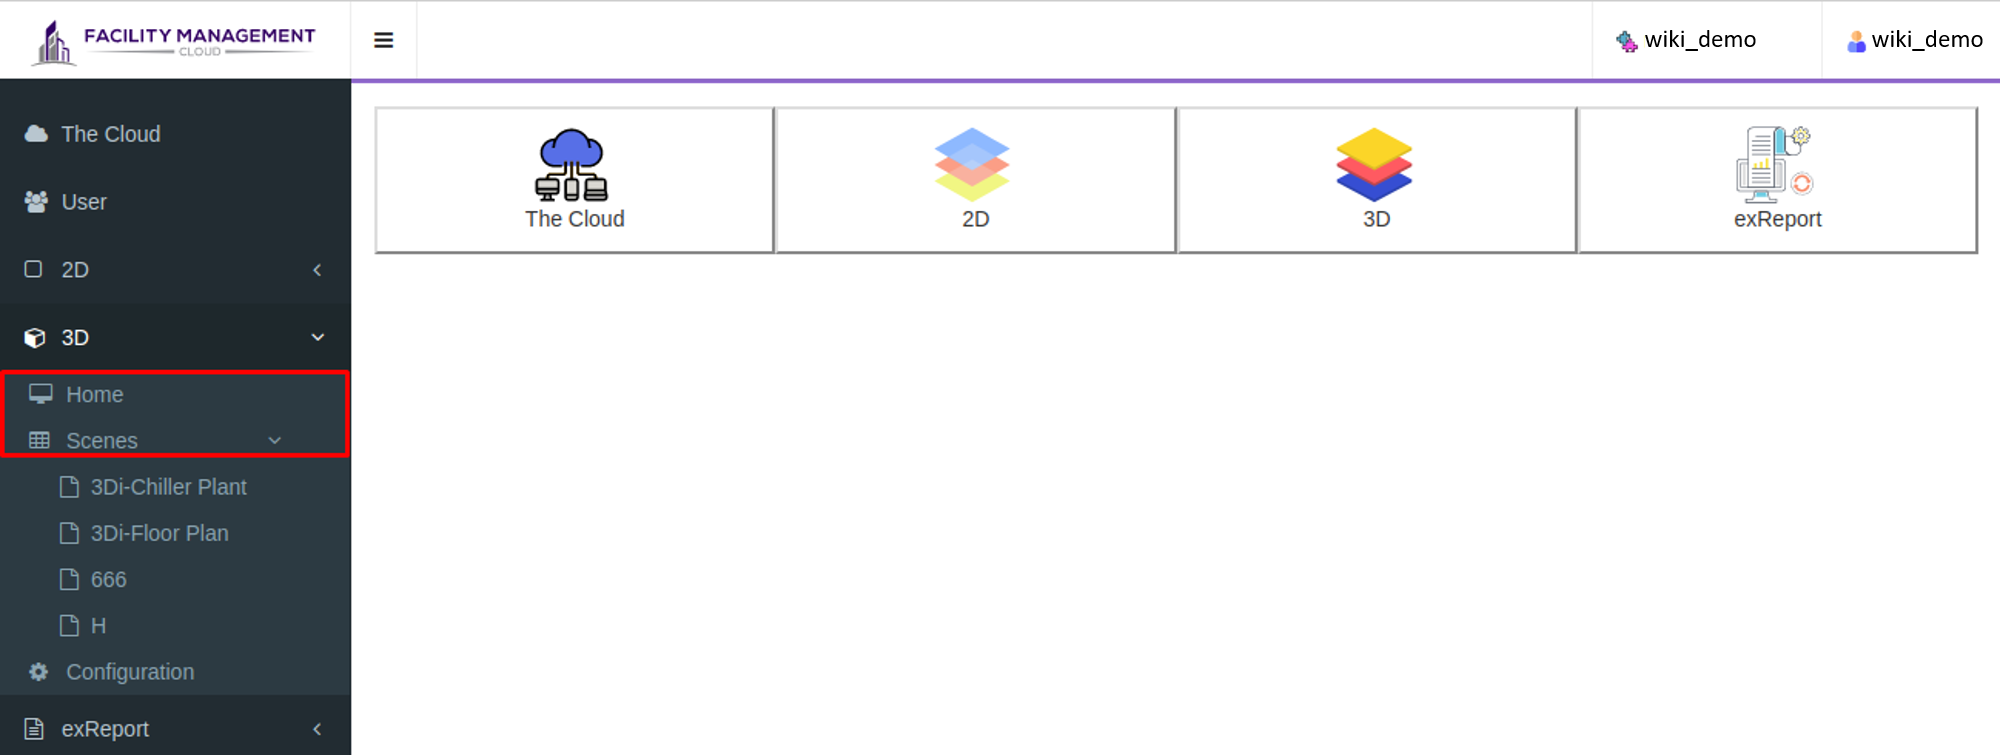
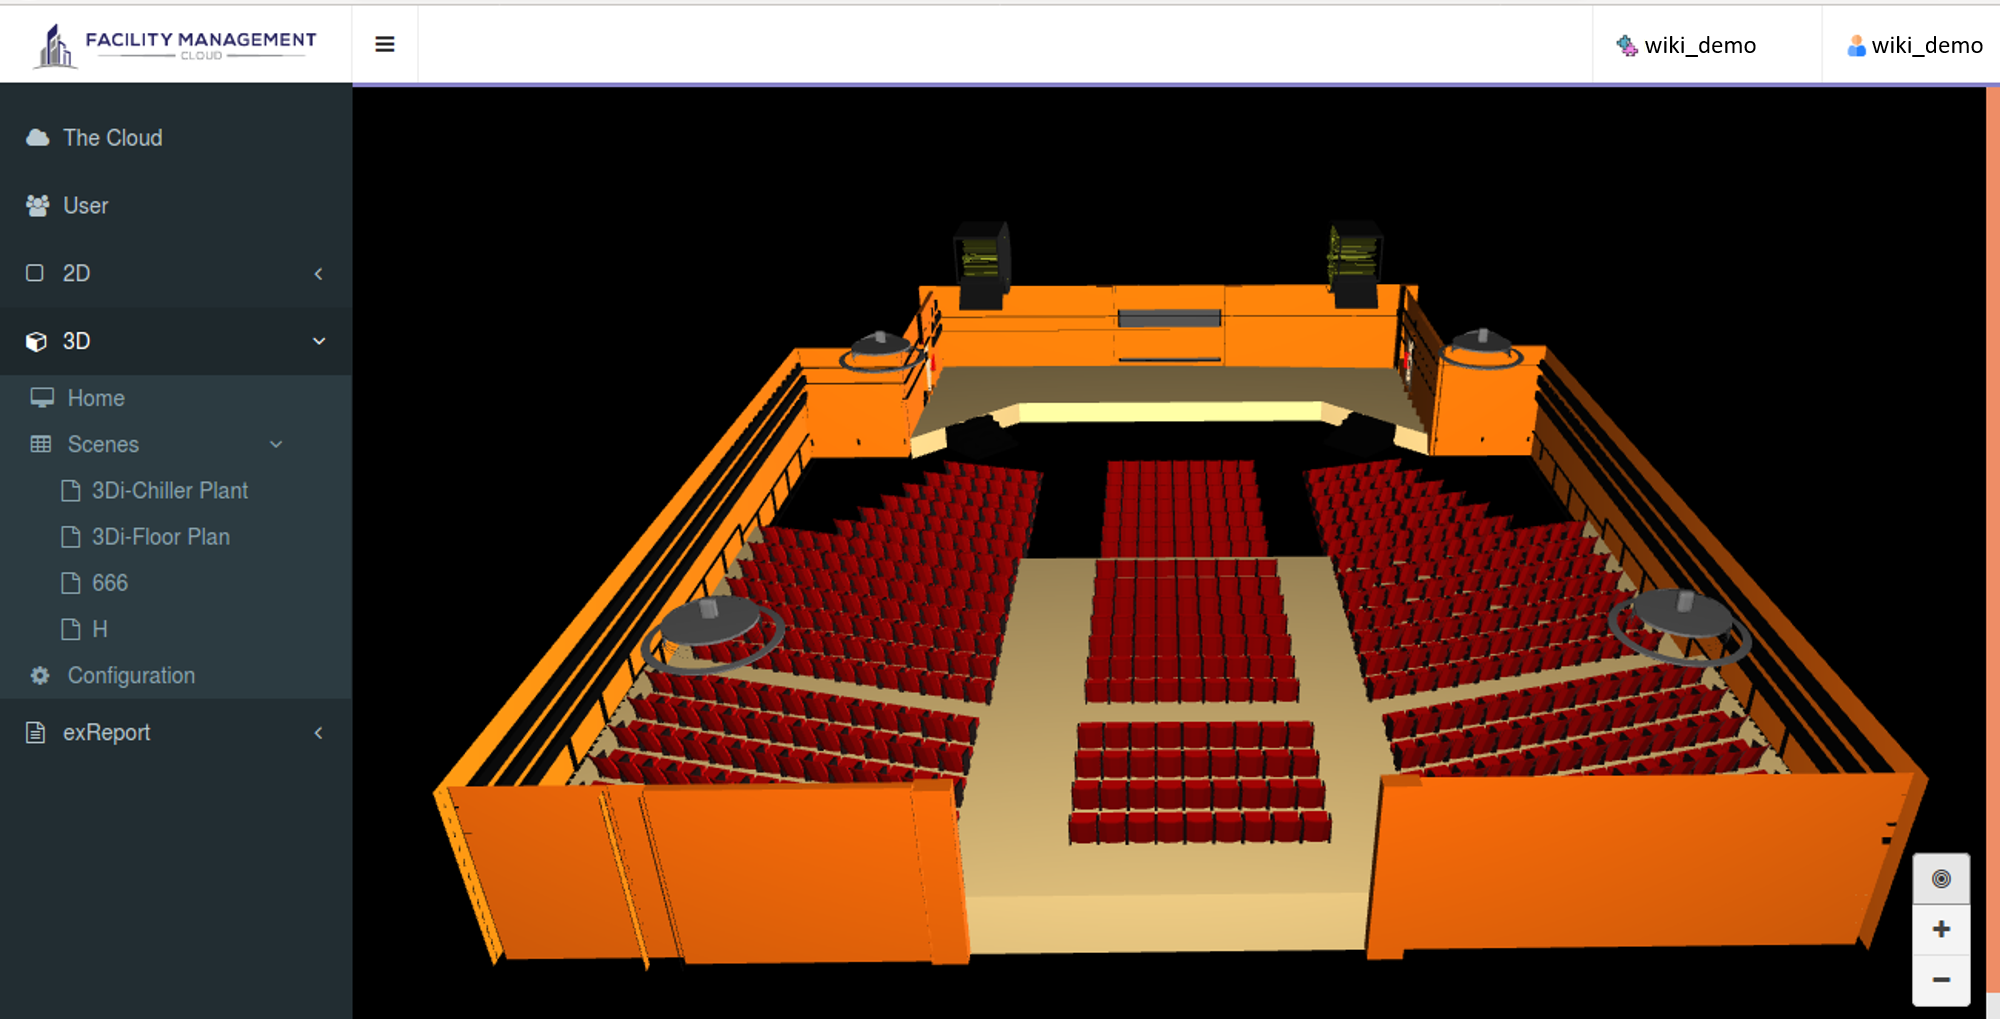
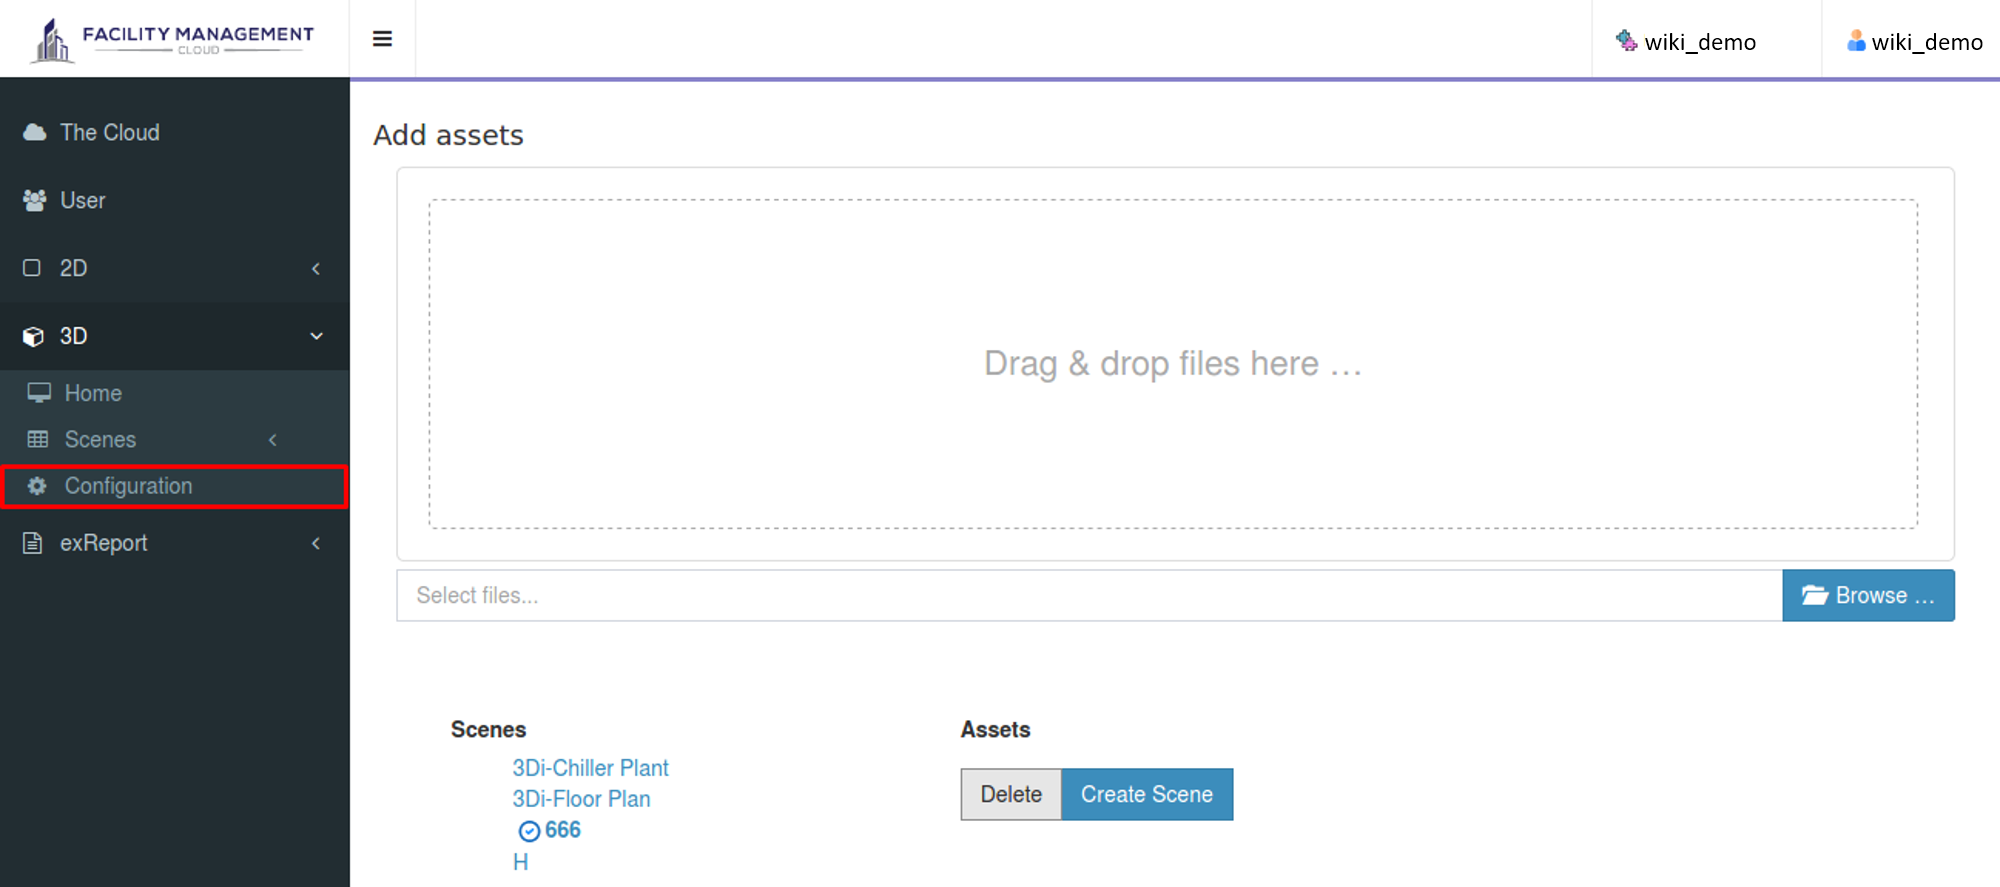
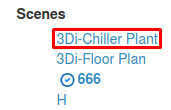
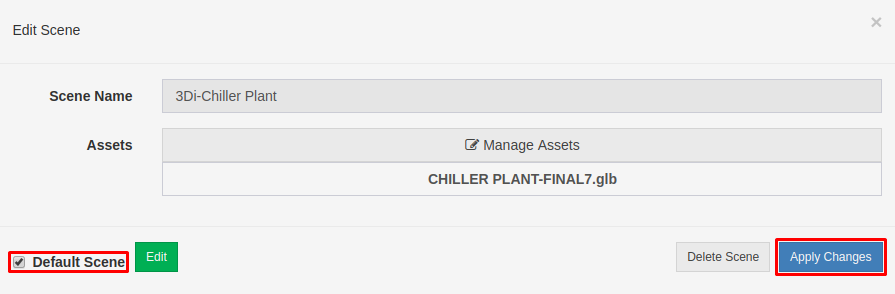
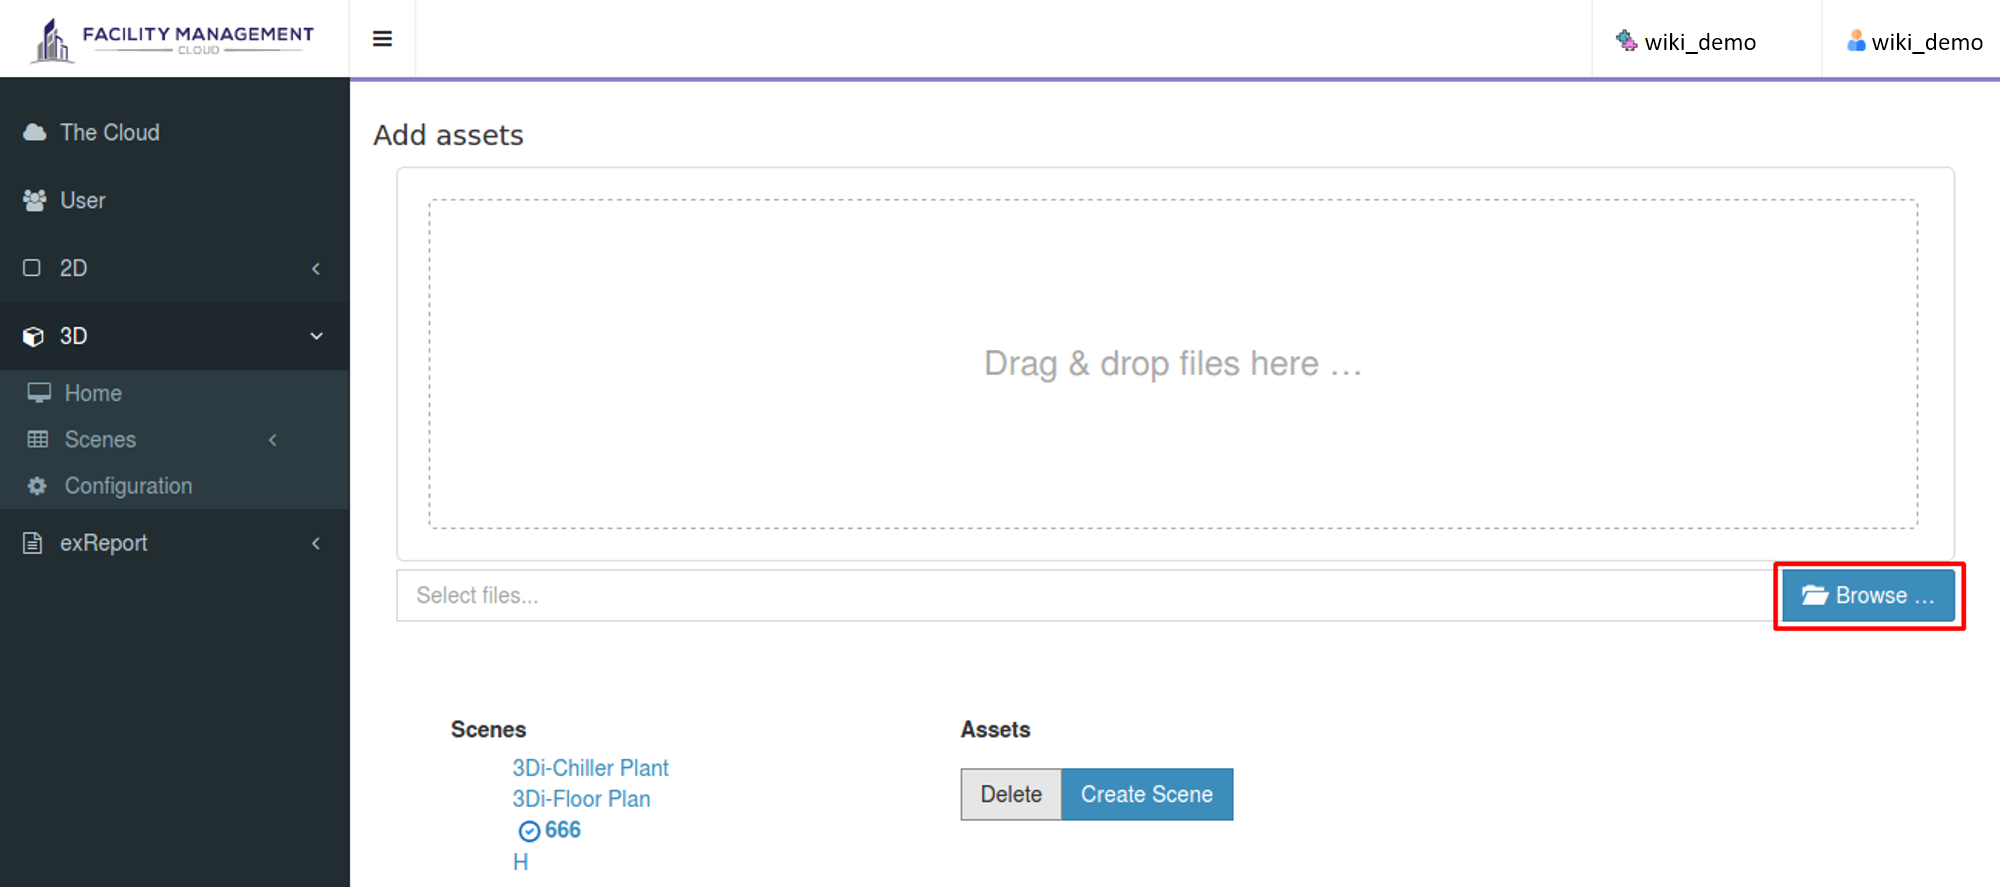
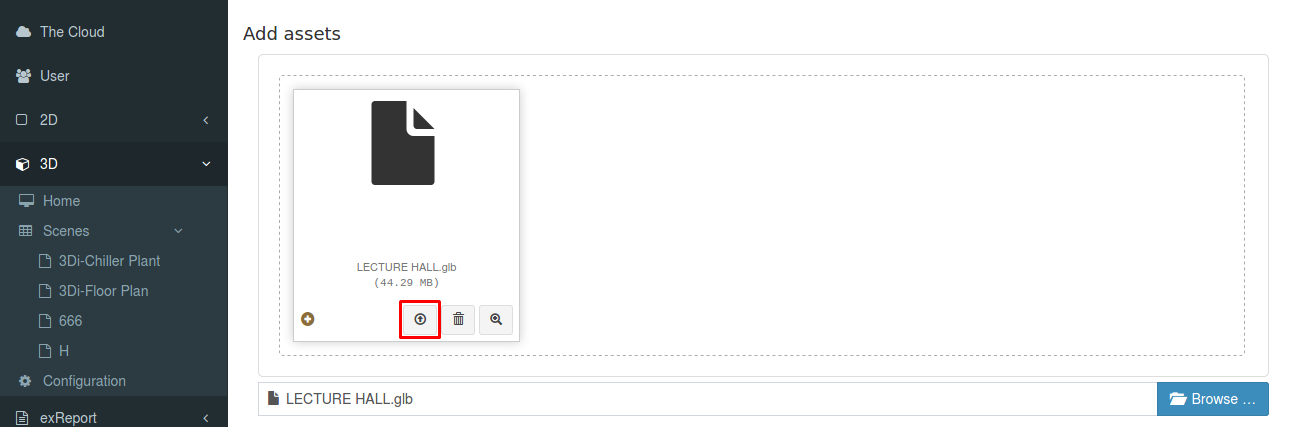
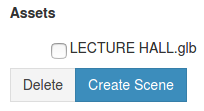
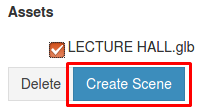
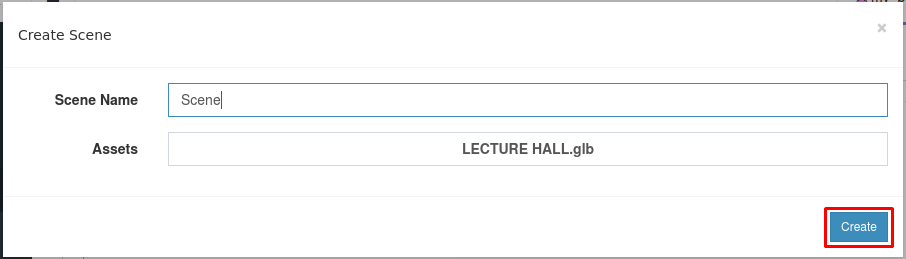
FMCC offers a 3D navigation feature to enhance the IO Points experience. Users can upload a 3D rendering file in .glb format, allowing them to have a visual representation of their IO Points in a three-dimensional space. This feature provides users with greater control and interaction with each IO Point directly from the 3D graphic interface. It offers a more immersive and intuitive way to navigate and manage IO Points within the system.
Depends on the IO Point configuration, each item in the 3D can be programmed to control their IO Points respectively.
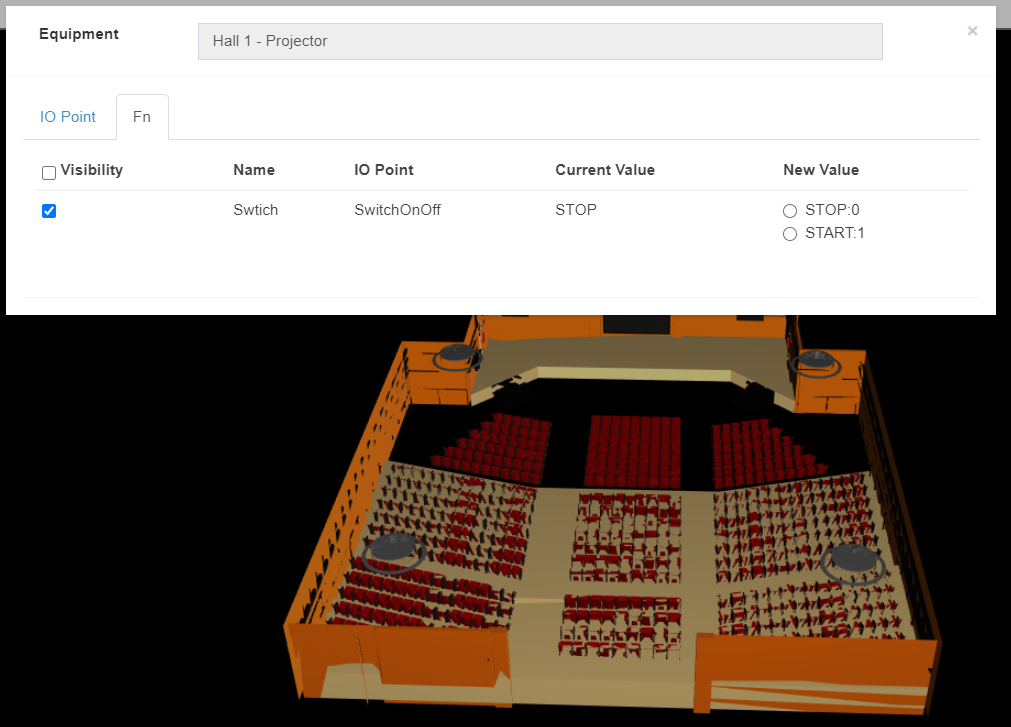
As such, when you click on the pre-programmed 3D object, a dialog box will appear to ask for your action, as shown below when a user clicked on the projector screen.
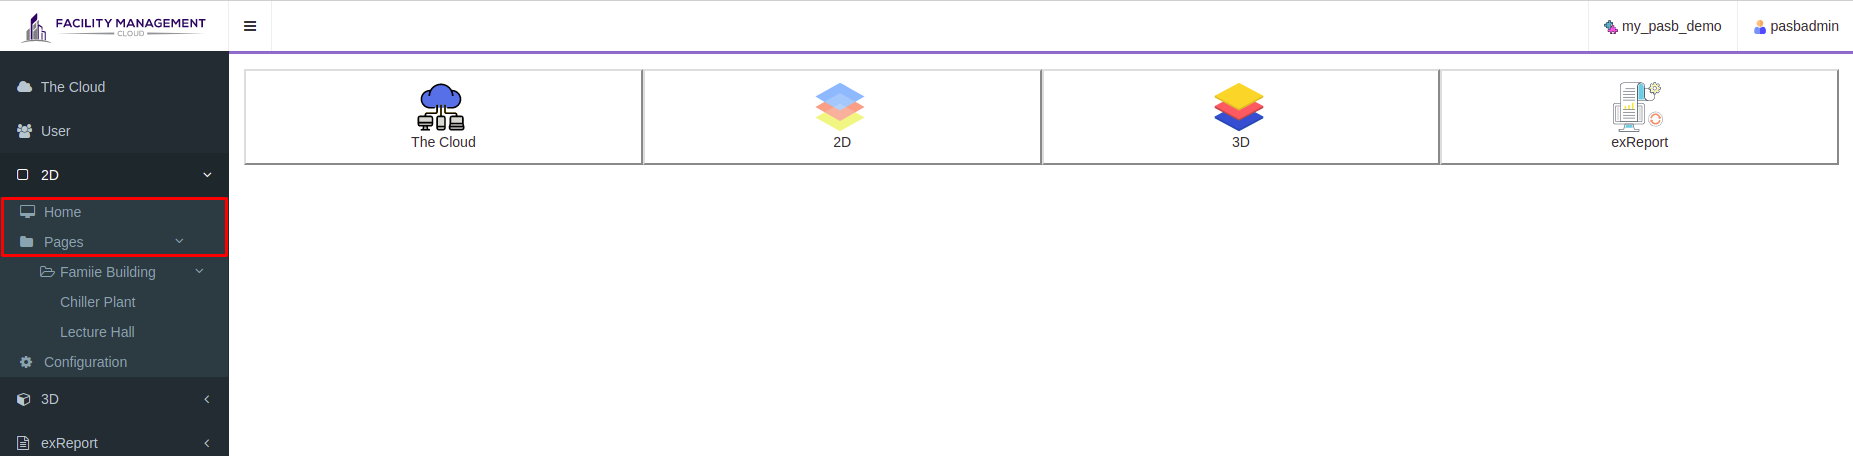
This page is designed to allow users to navigate to a specific location within a workspace and view it in a 2D format. This is particularly useful for facilities or large workspaces, where it can be difficult to navigate or find a specific location. The 2D view also allows users to get a better understanding of the layout and design of the workspace, which can be helpful for planning and decision-making purposes.
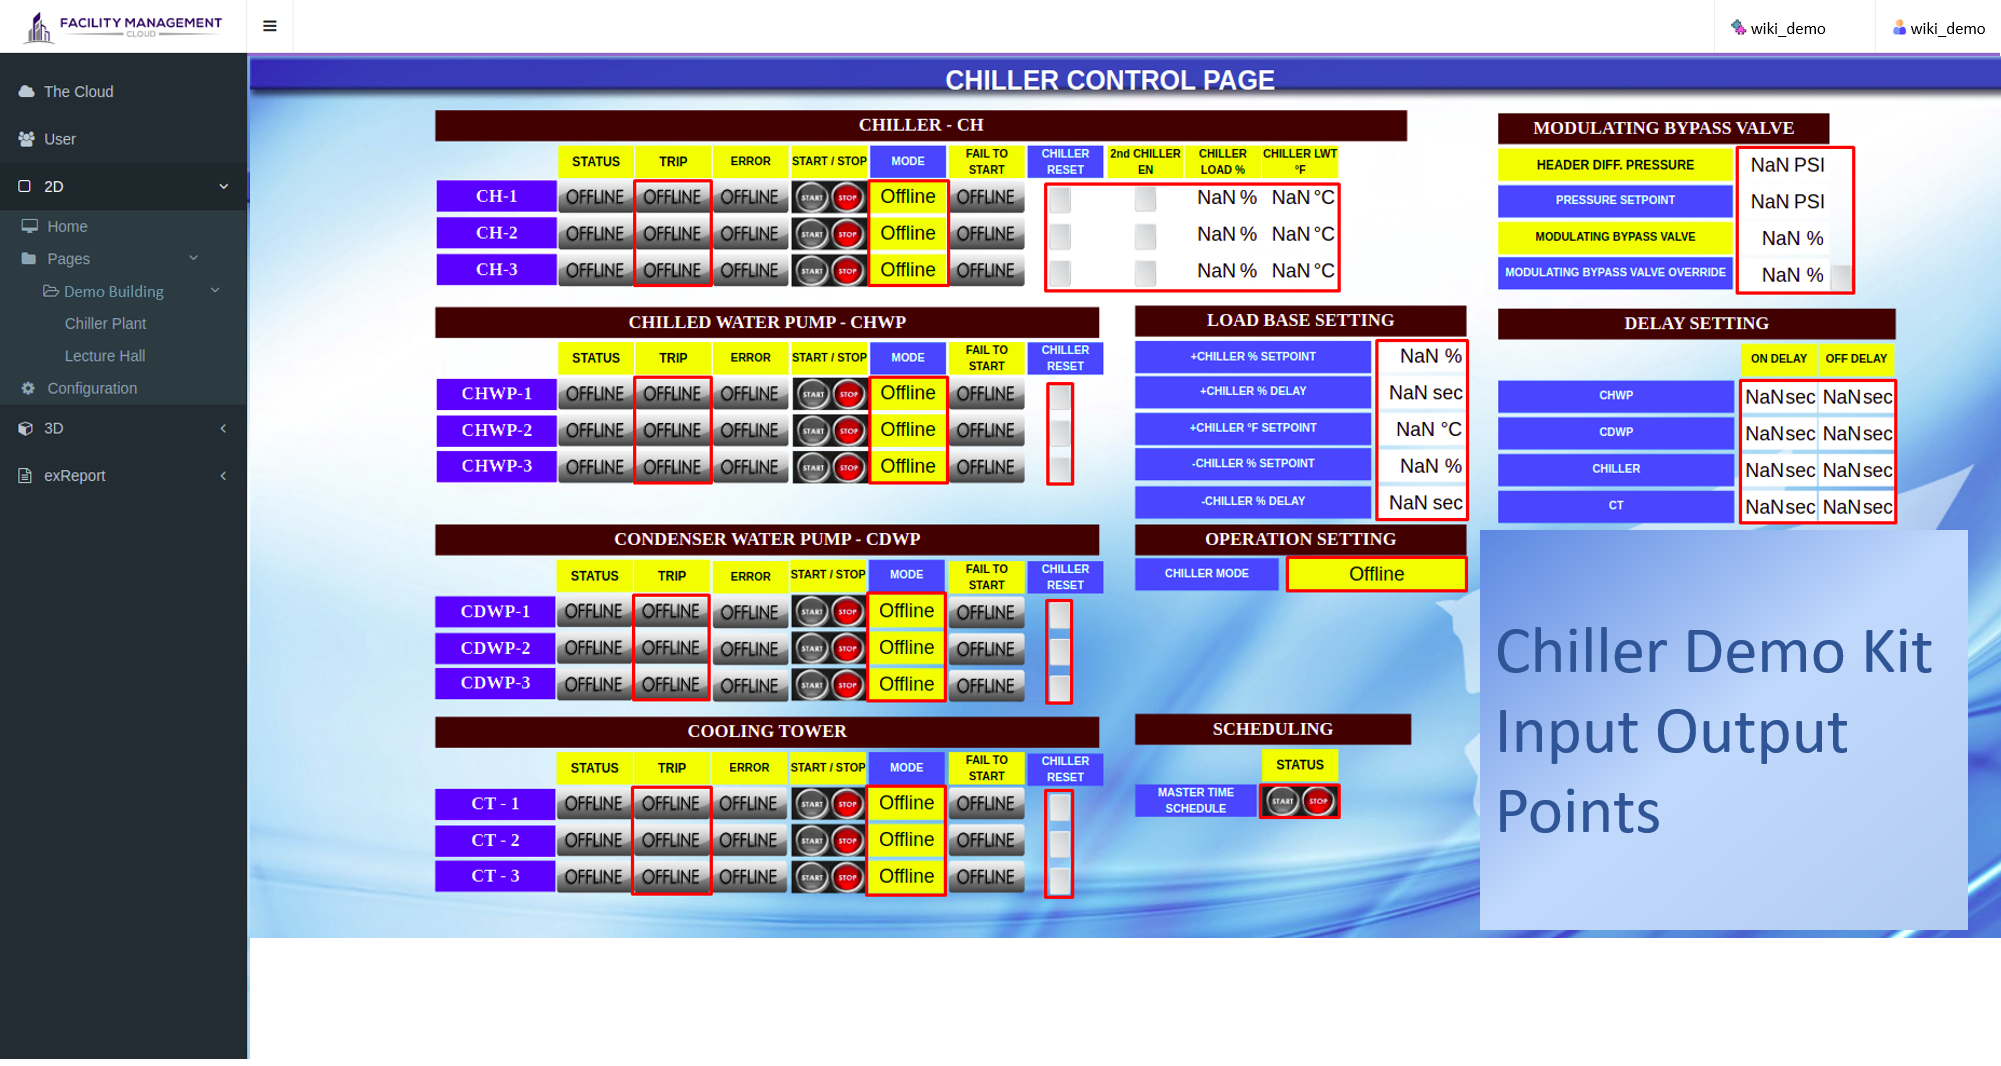
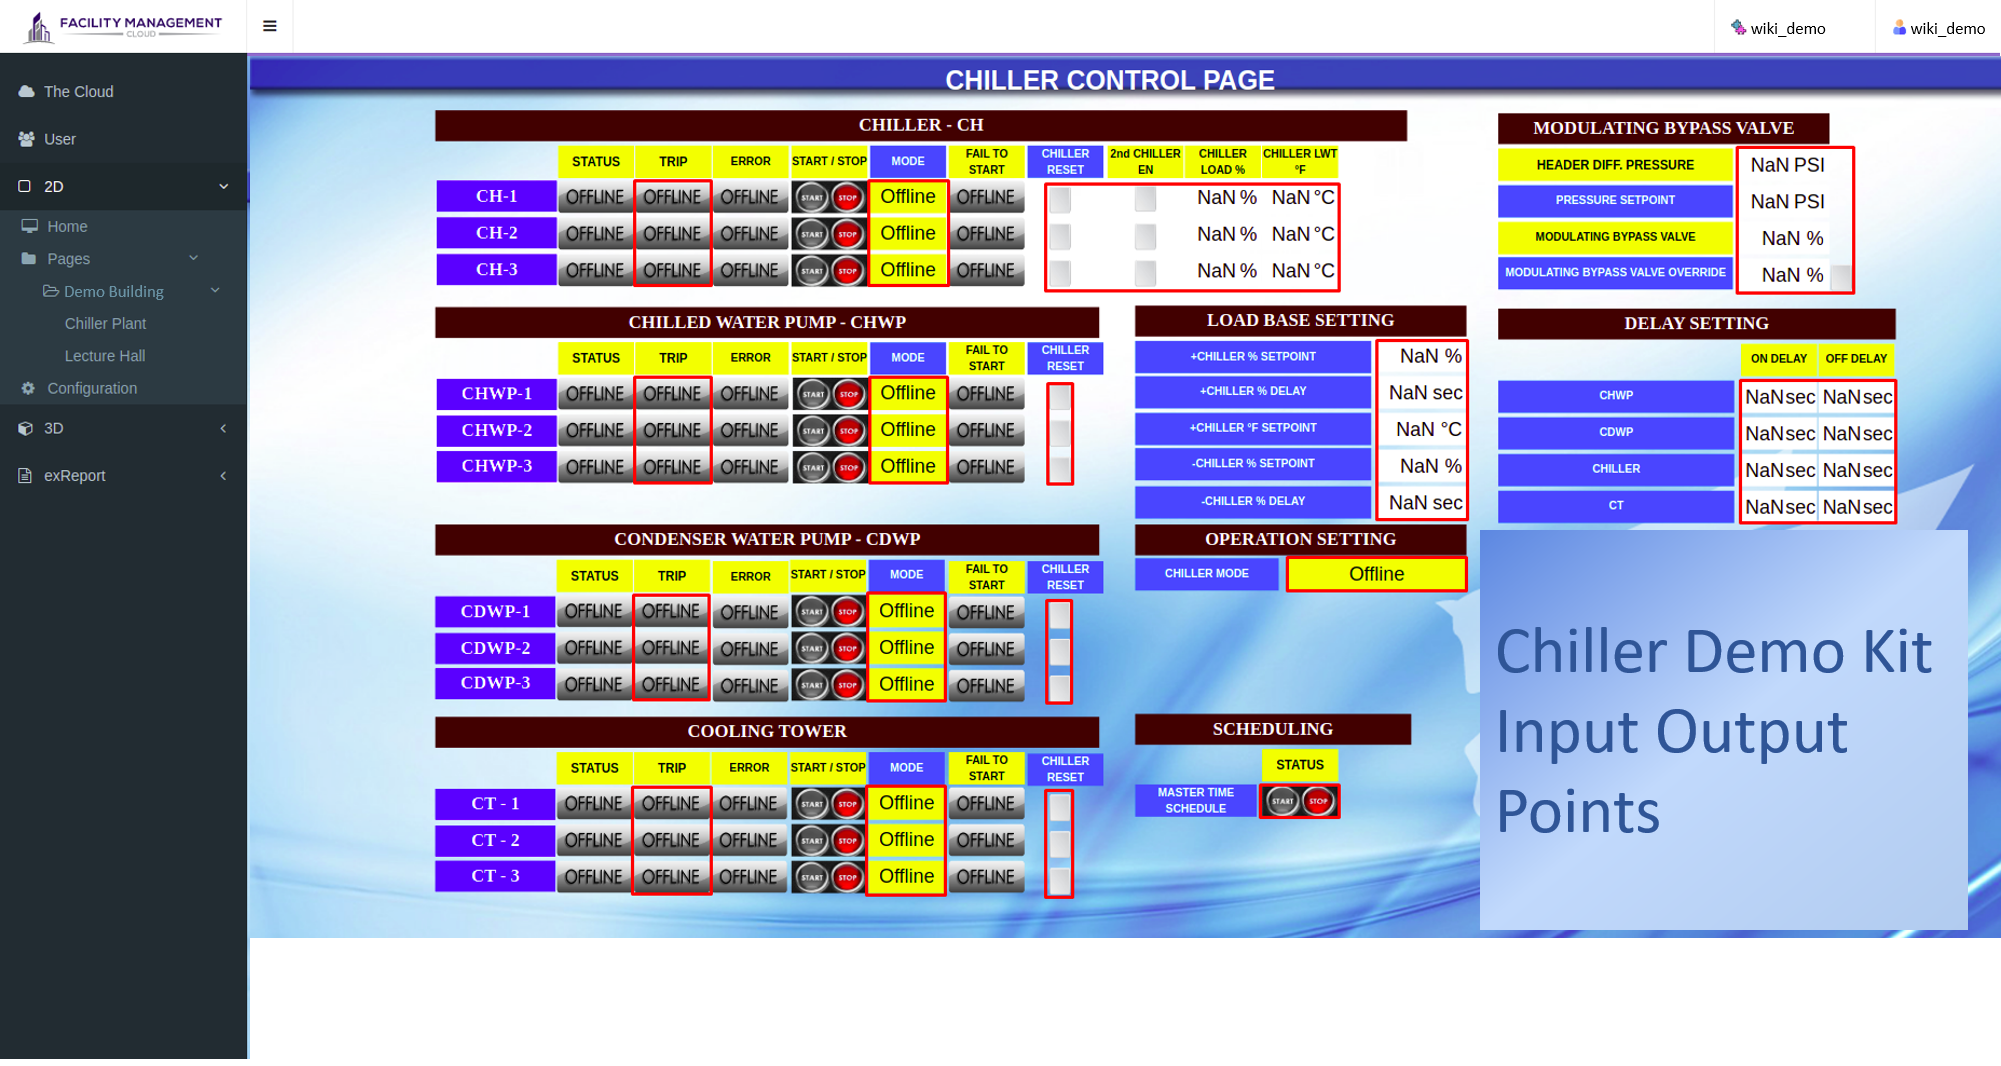
The Control page can be customised in various formats. The displayed page showcases the Chiller Control Page, where users can click to access and control the IO Points associated with the chiller.

Argument is an object that hold values to be used in instructions. Each arguments has one property which is default. The value of the arguments can be passed within each points or fn. The key of the argument object is a case sensitive string which is treated as the argument's name. rawValue is a reserved name for argument which is used to get the raw value of the point or the value passed to set the point value.
Property default is the default value for the arguments. It can be numbers, strings or boolean. The default value will be used by the script when there is no argument value passed to the script. rawValue does not have default value as it will always use the raw value of a point for script in equipment point, while rawValue will always use the value user pass to set point value in fn.
{
    "arguments":
    {
        "rawValue": {},
        "argument1": { "default": 10 }
    }
}
Variable is an object that hold values of constants to be used in instructions. The valid syntax to get variable value is “getVariable”: { “name”: y } where the value for name is the variable name.
{
    "variables":
    {
        "x": 100,
        "y": 10
    }
}
Instruction is an array of tasks in a script. Each instructions should be an object with two properties, which are op and params.
Property op is the task operator which is case sensitive and only valid string. There are a few supported operators which are add, subtract, divide, multiply, getVariable, getIopVal and setIopVal.
Property params is the property used to get the parameters for each operators. Each operators have their own valid params.
| "op" | "params" |
|---|---|
| “add” / “subtract” / “divide” / “multiply” |
|
| “getIopVal” |
|
| "setIopVal" |
|
| "getVariable" |
|
{
    "instructions":
    [
        {
            "op": "divide",
            "params":
            {
                "n1": { "args": "rawValue" },
                "n2":
                {
                    "getVariable": { "name": "y" }
                }
            }
        }
    ]
}
Single Sign-On (SSO) is an authentication process that allows a user to verify their identity once and gain access to multiple workspaces without needing to log in separately to each one. By using a verified email address, users can view a list of accessible workspaces and switch between them easily, making it faster and more convenient to manage access across multiple workspaces.
To use this feature, you should verify your email address in your profile within the workspace. After successful verification, you will be able to enable SSO in that workspace. However, this service only available for the FMC Cloud (Web Based), not FMC Controller does not have this feature.
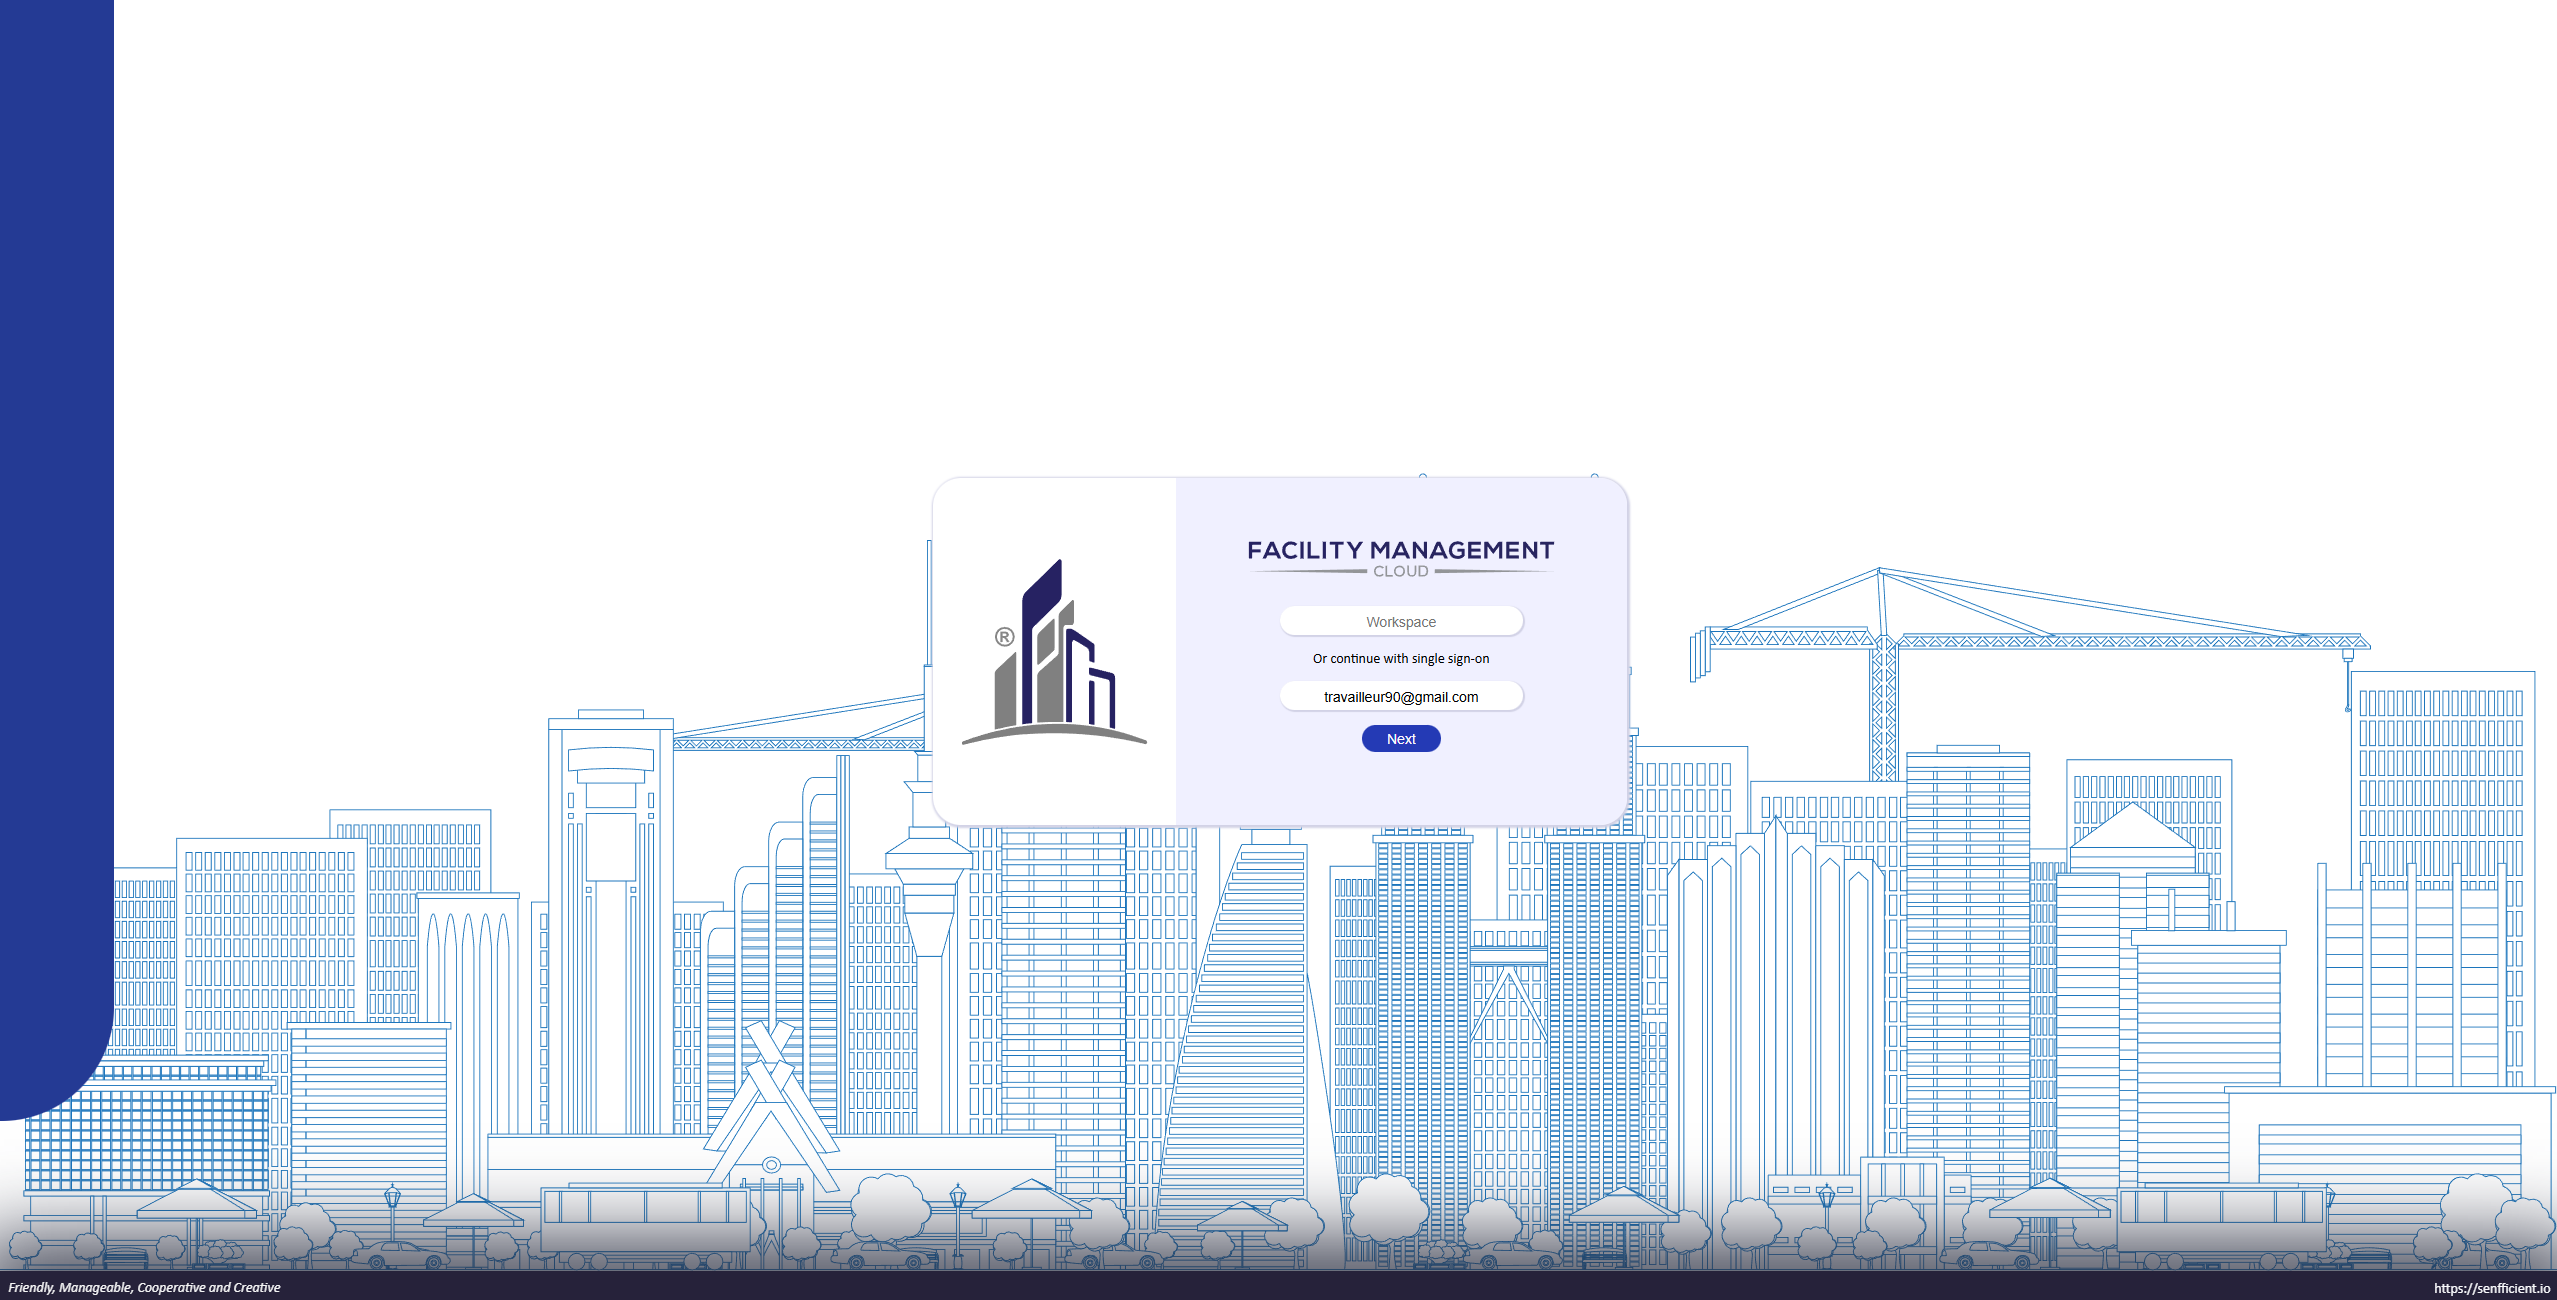
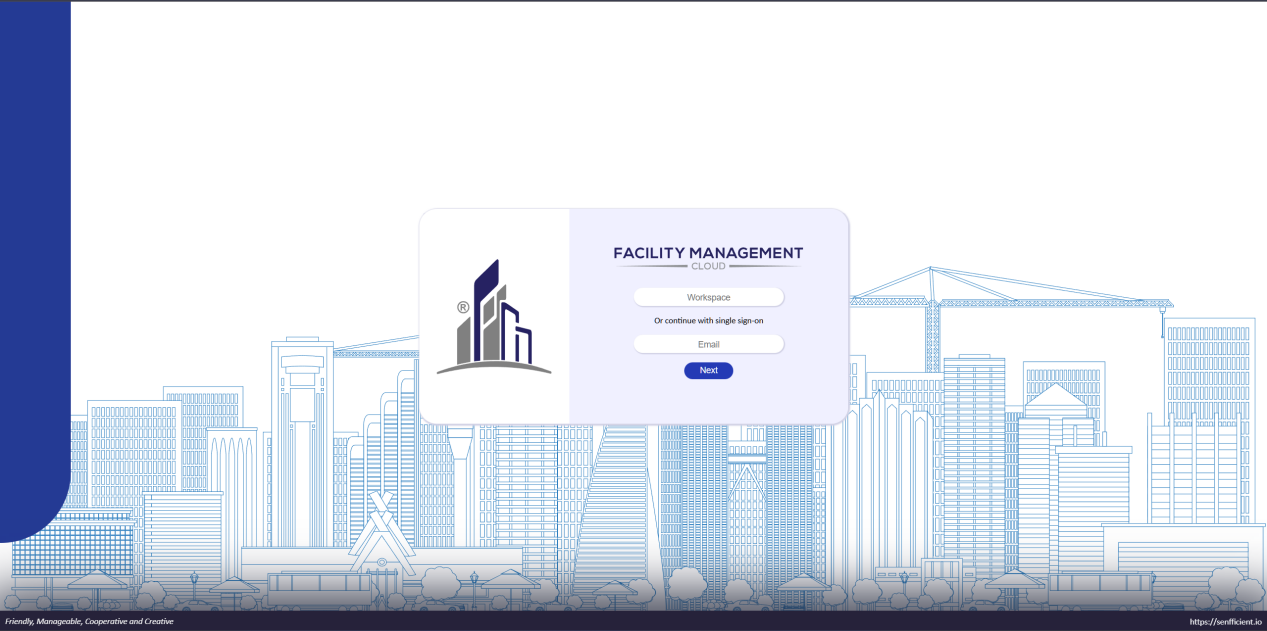
The image above is the entry point for key in info to entry a workspace. The system requires user to enter their email address upon accessing the page. A verification code will be sent to your email — please kindly check your inbox.
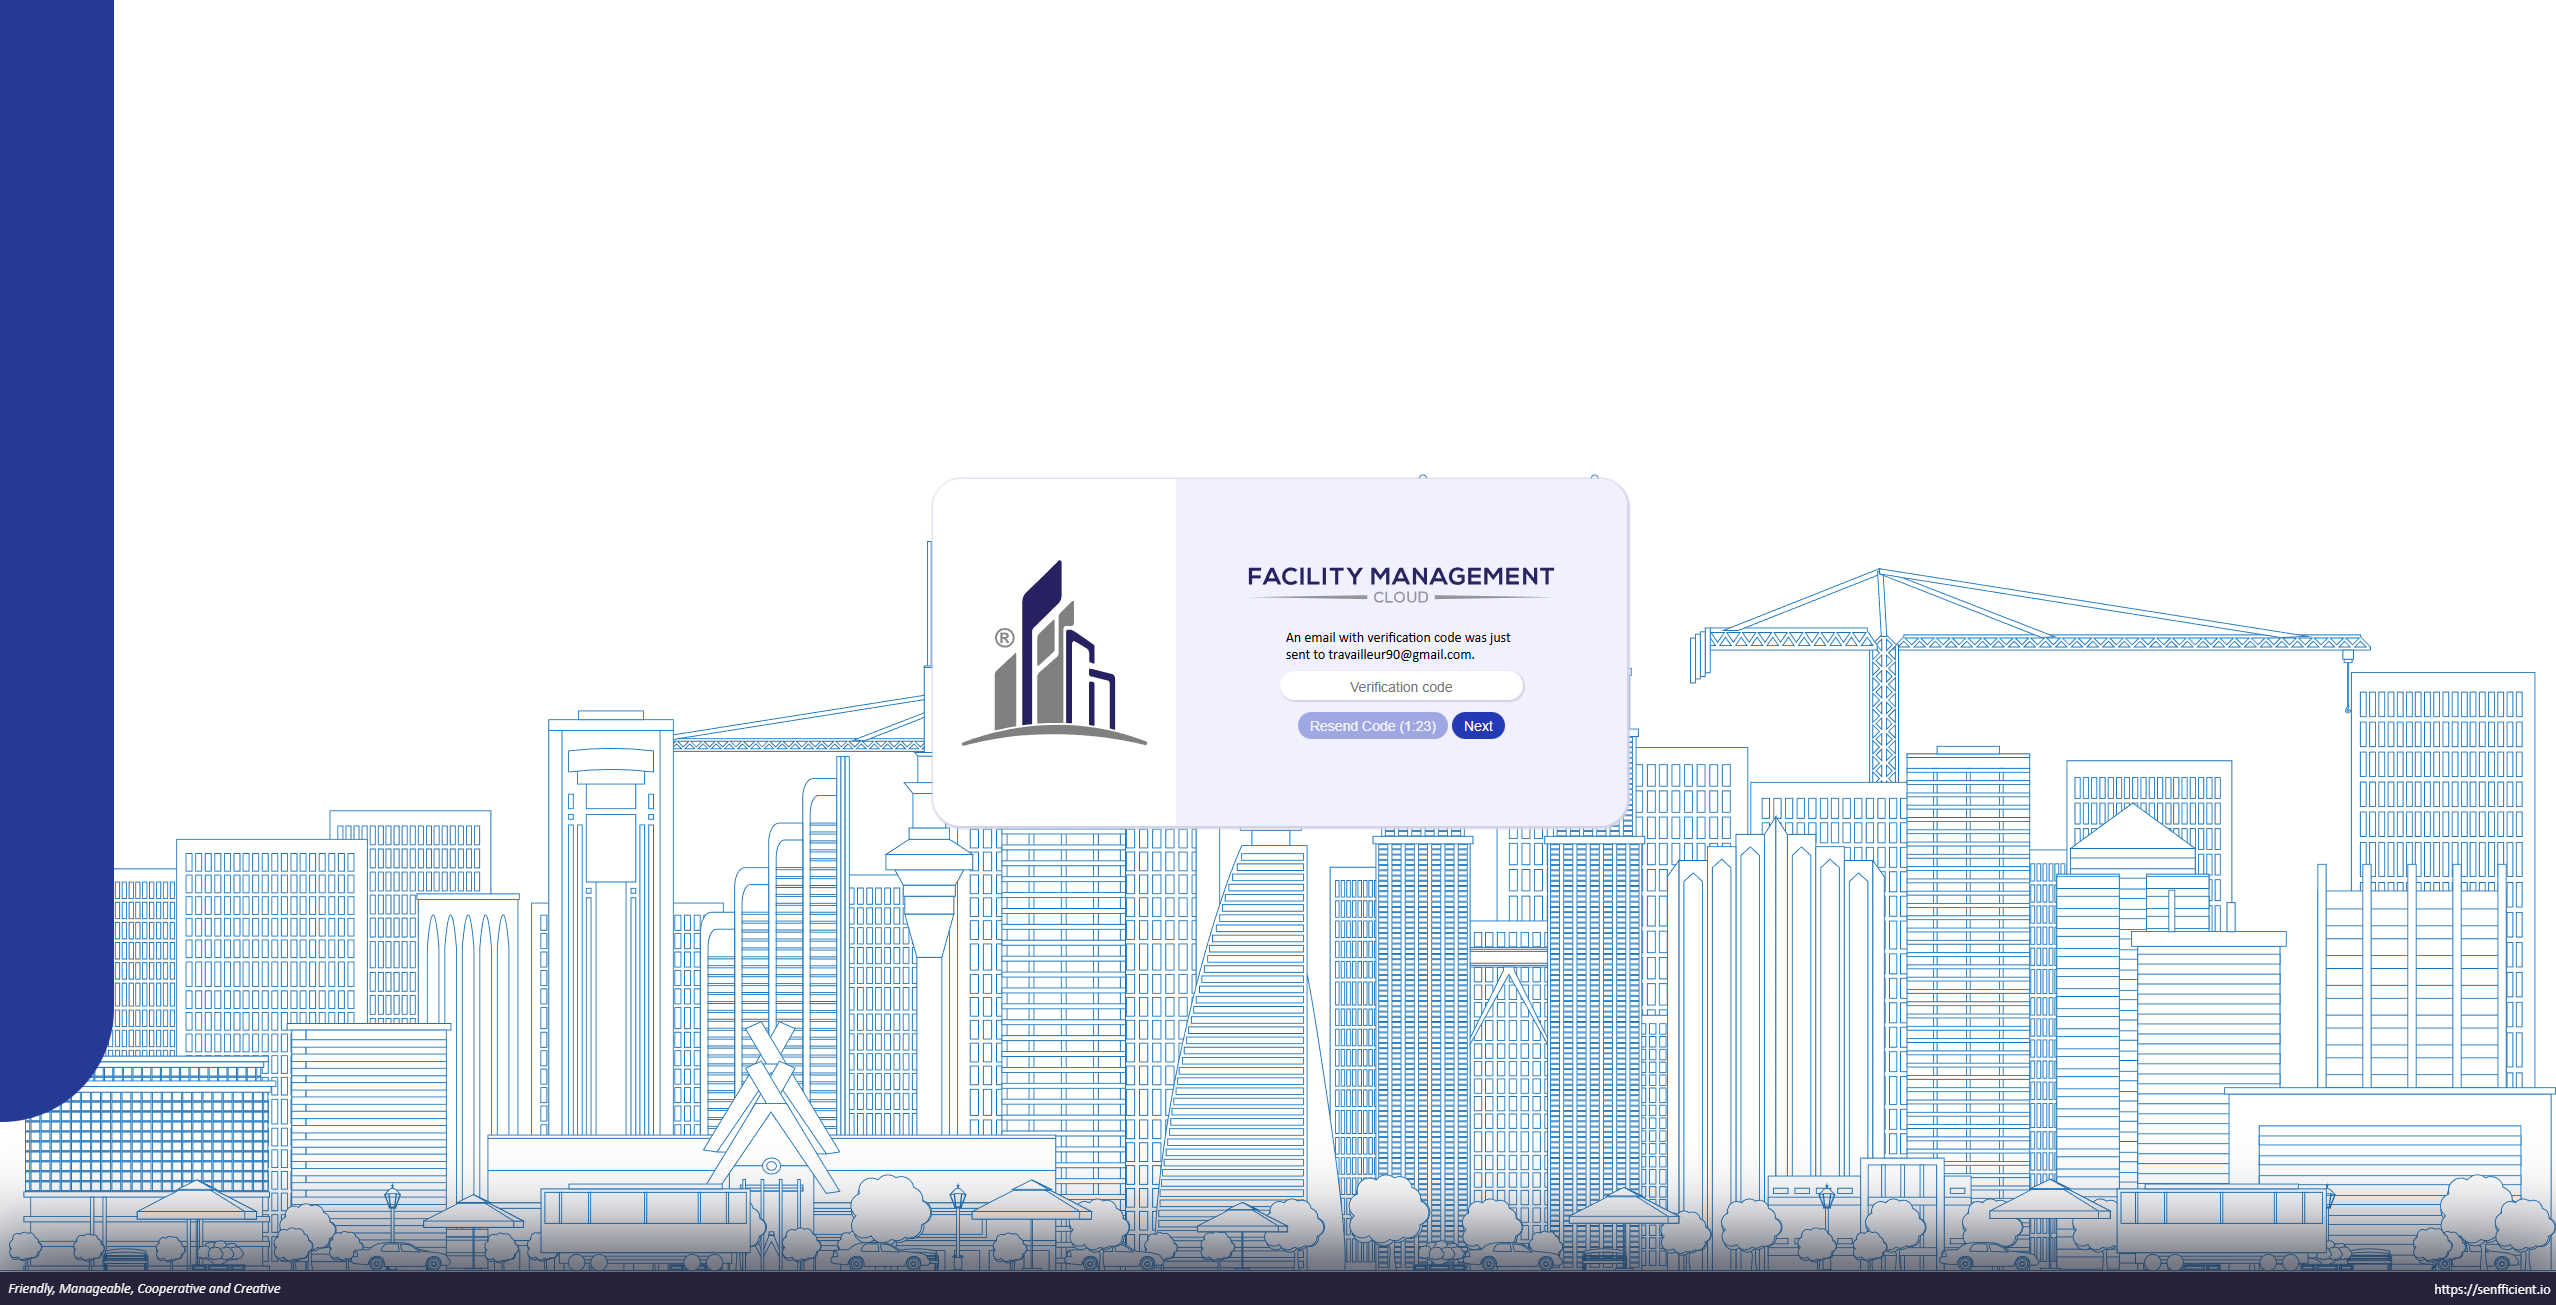
If the email address is registered in any of the workspaces within the system, a second page will be displayed, prompting the user to enter the SSO verification code sent to their email.
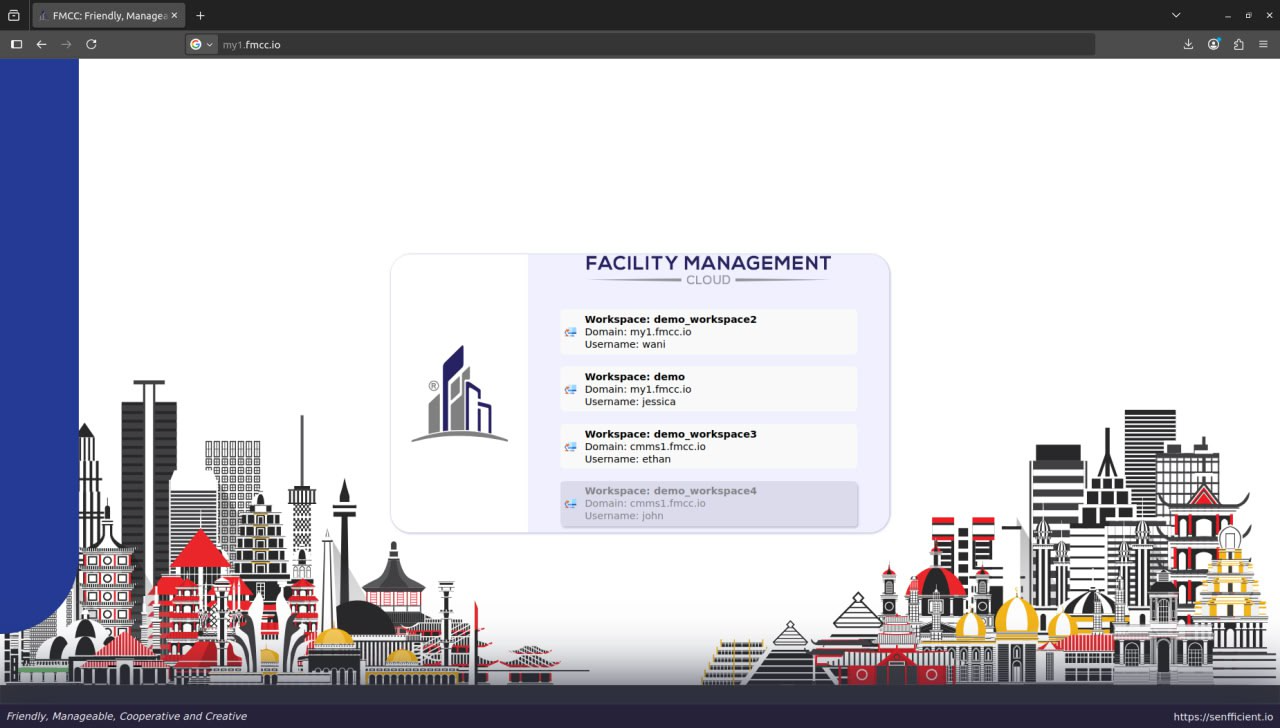
If the user enters the correct code, they will be redirected to a page displaying a list of workspaces where their email is registered.
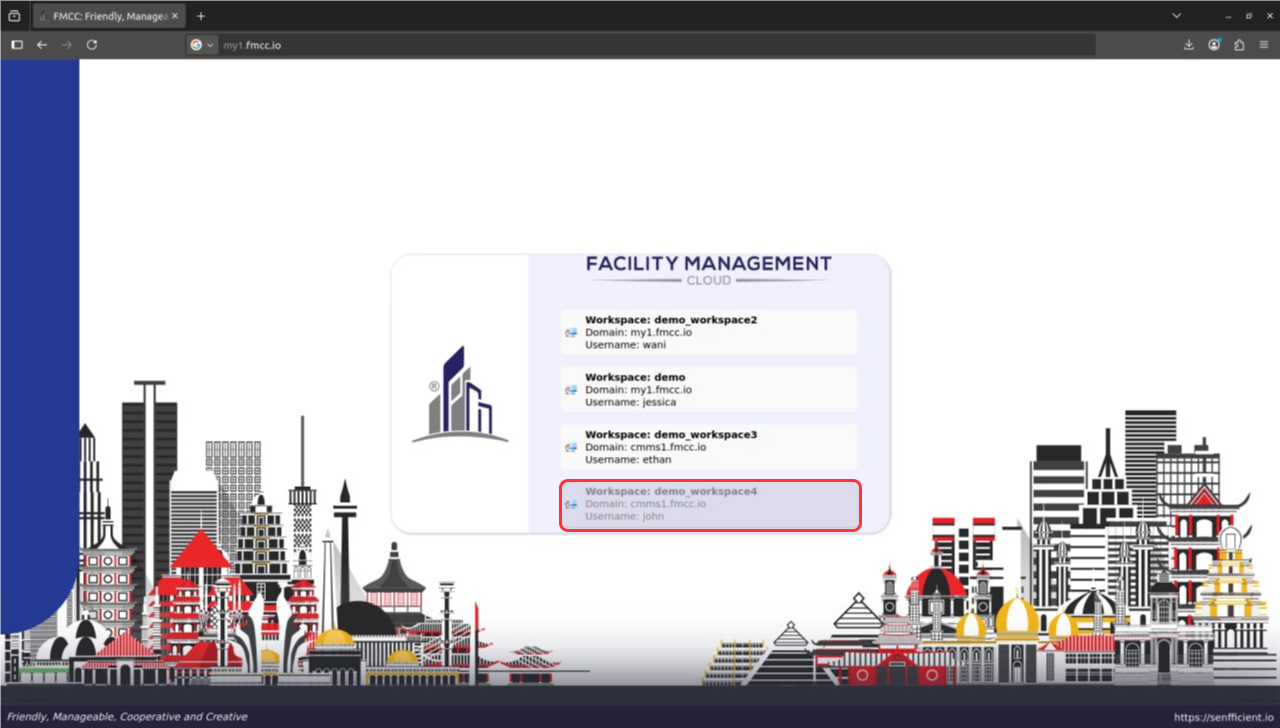
This indicates that the workspace is not active, or the user with the registered email demo@senfficient.io is unactive in that workspace. As a result, the user cannot access the workspace, but it will still be shown on this page.
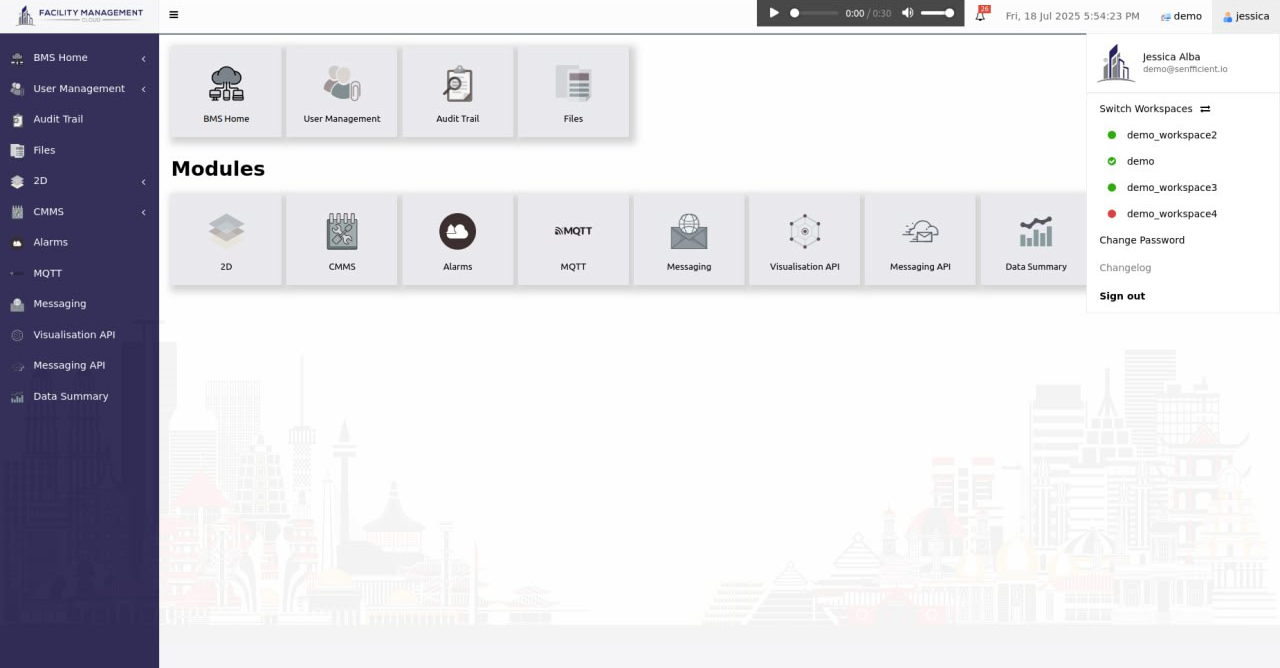
After successfully entering one of the verified workspaces, users can switch between their workspaces from the profile by clicking on the verified workspace list.
For example, when a user selects the Demo workspace, the system will navigate them to the homepage of the Demo workspace.
Within the workspace, users can switch to other workspaces using the workspace dropdown menu.
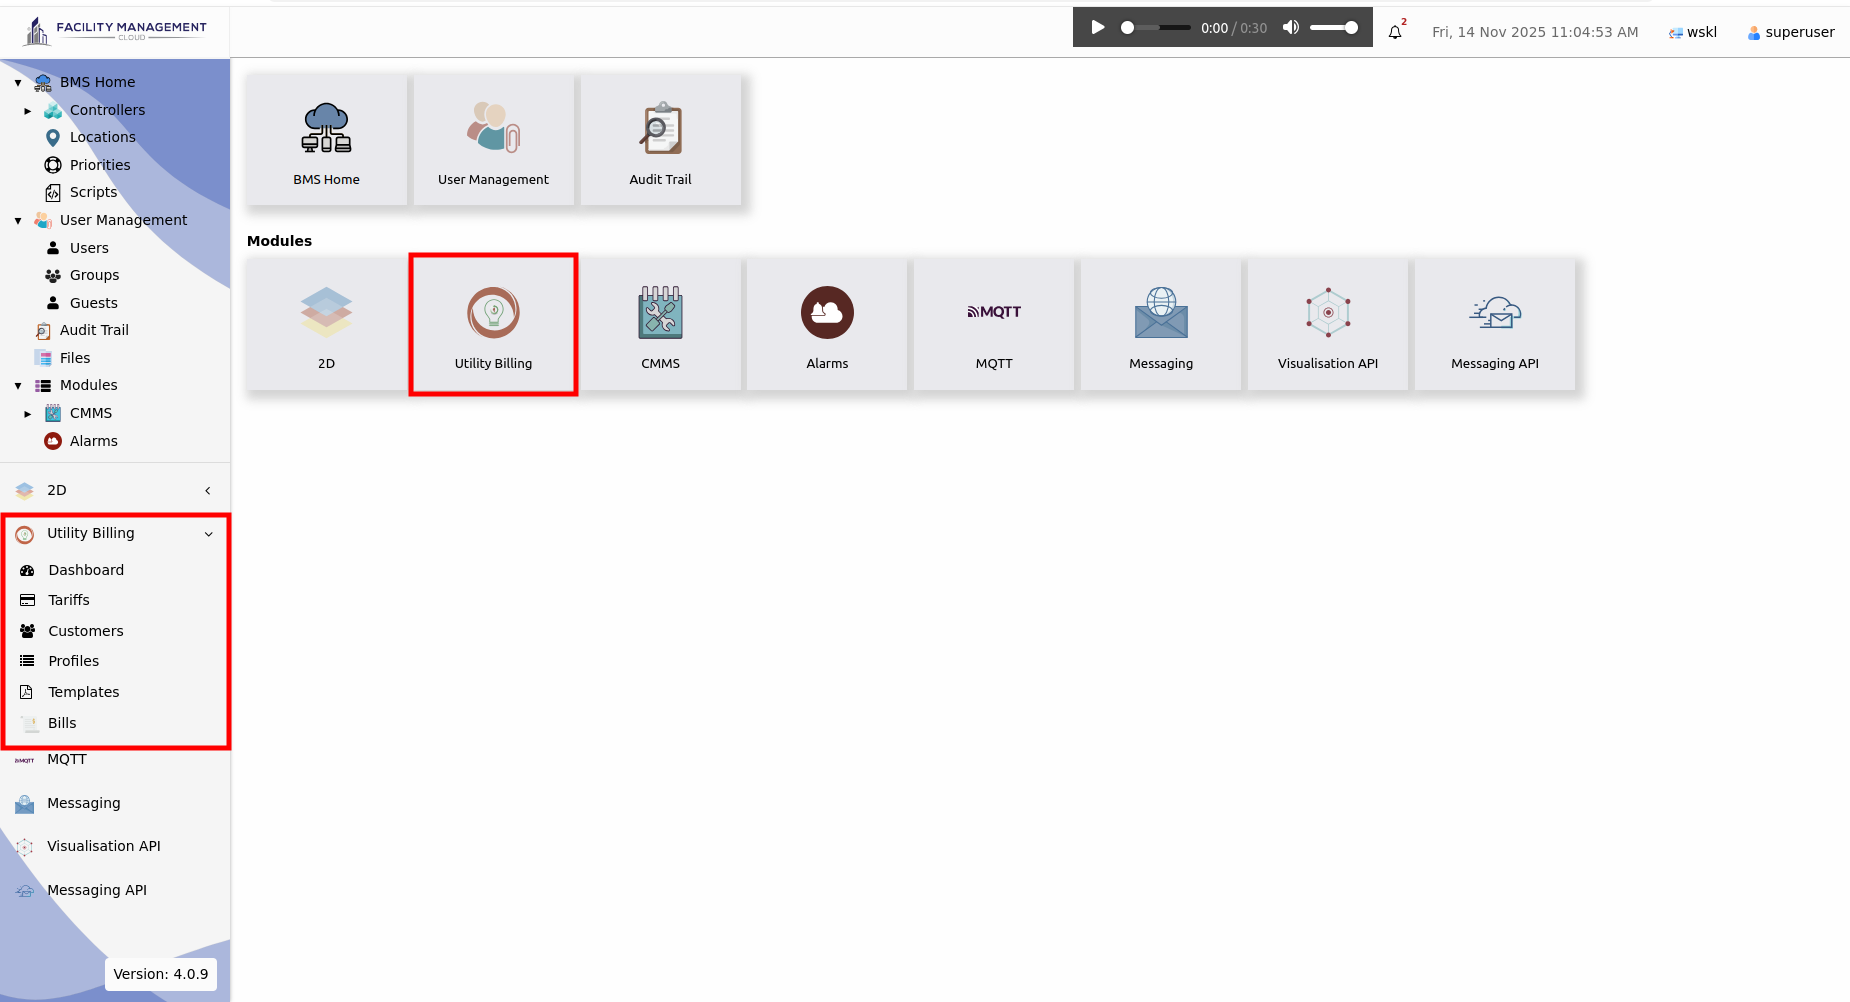
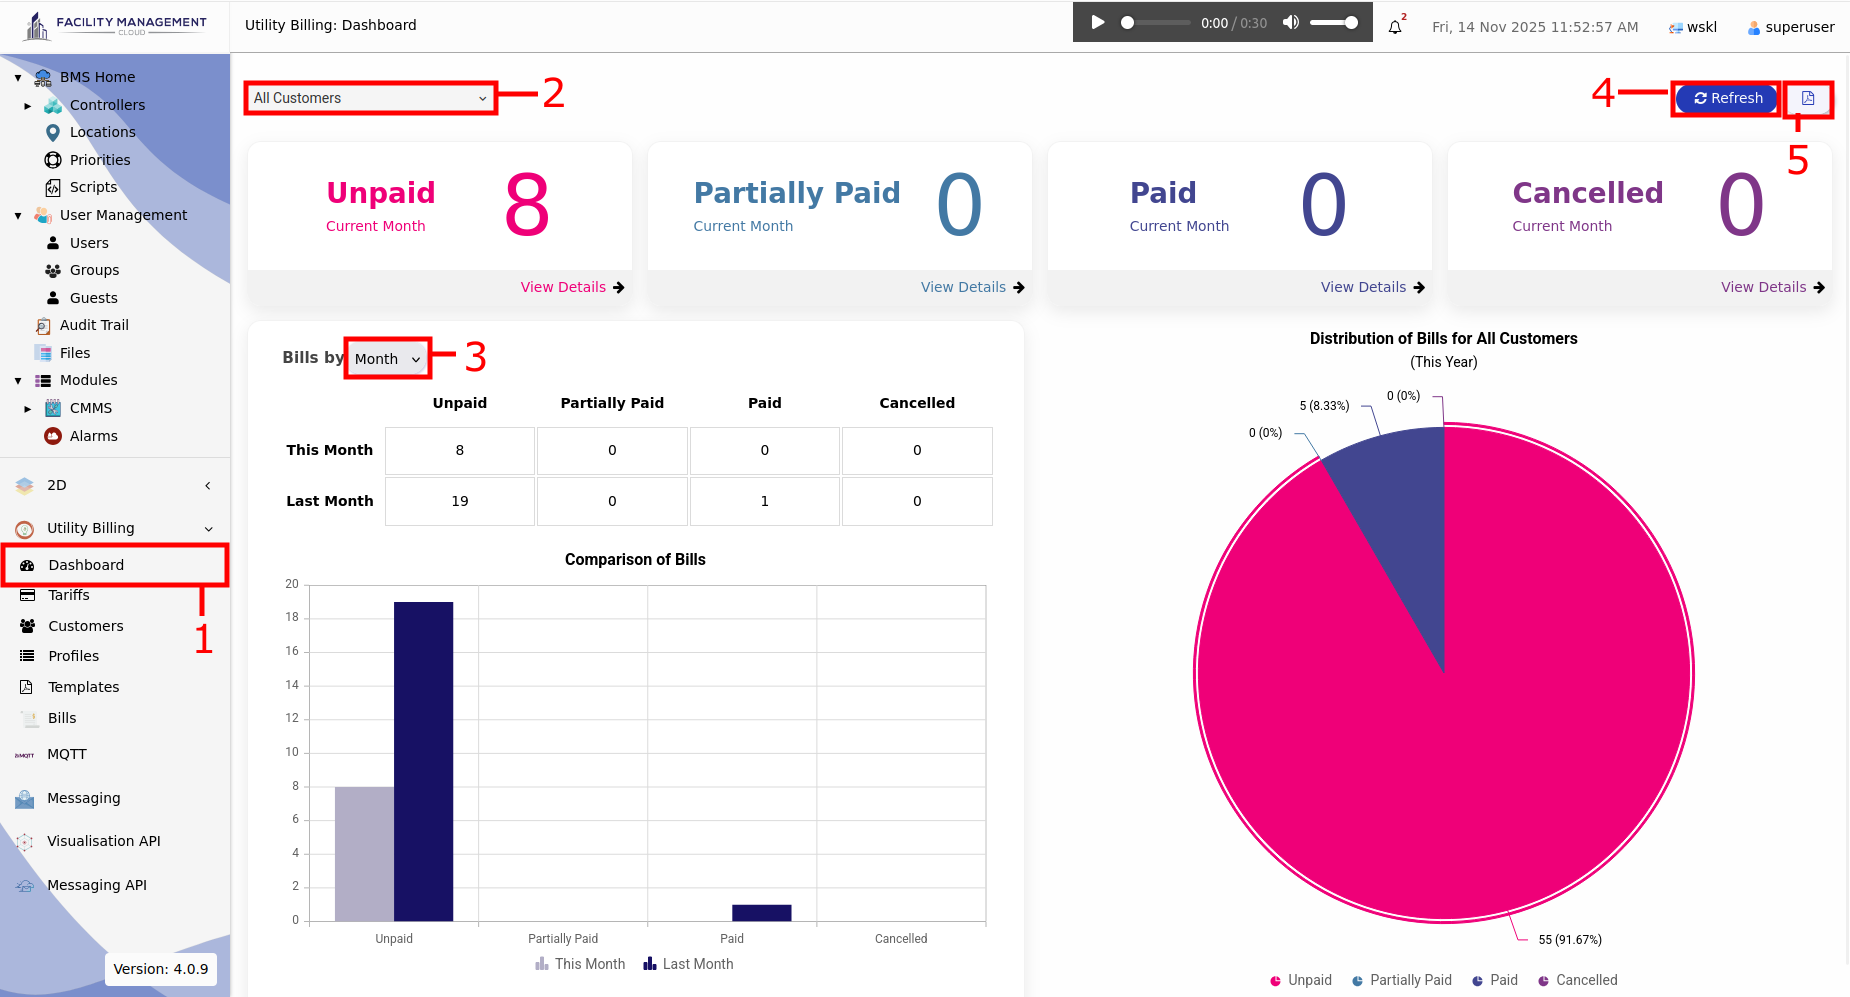
Utility Billing System (UBS) is a module in FMCC that automates the entire billing process. It records usage readings, such as water and electricity, within a specified weekly or monthly period, applies the appropriate tariffs, calculates the amount payable by a customer and finally sends the bill to the customer through the messaging module by e-mail, WhatsApp or Telegram.
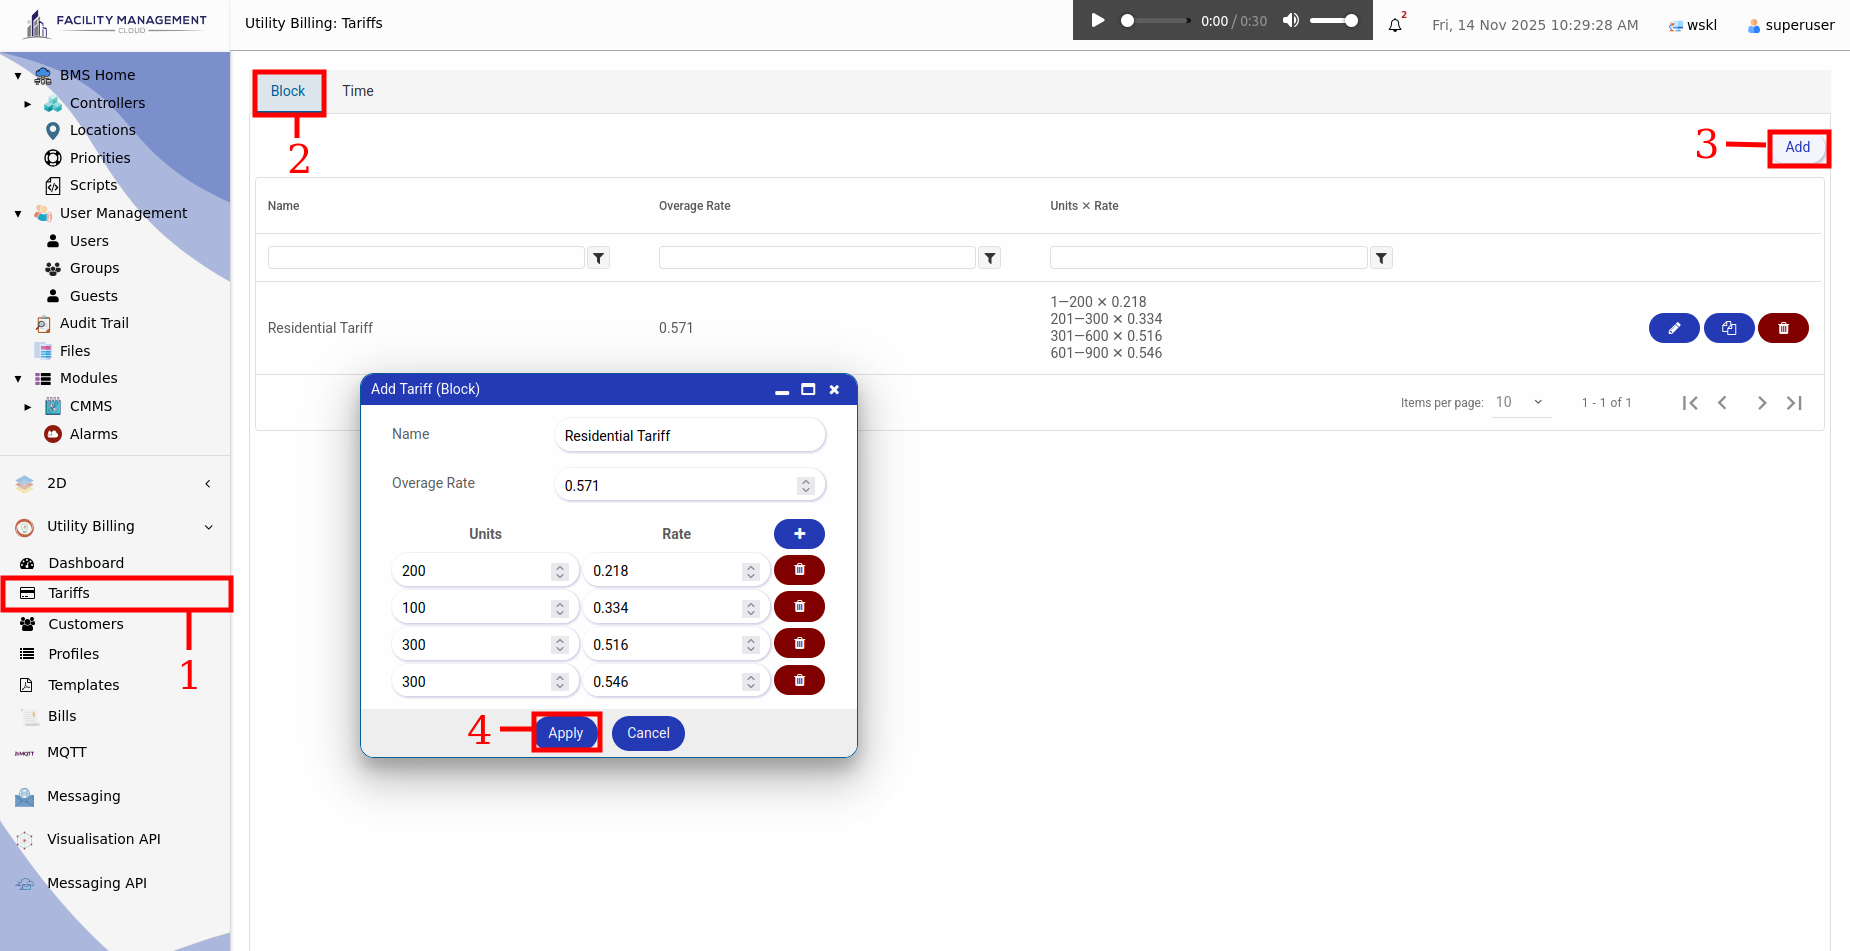
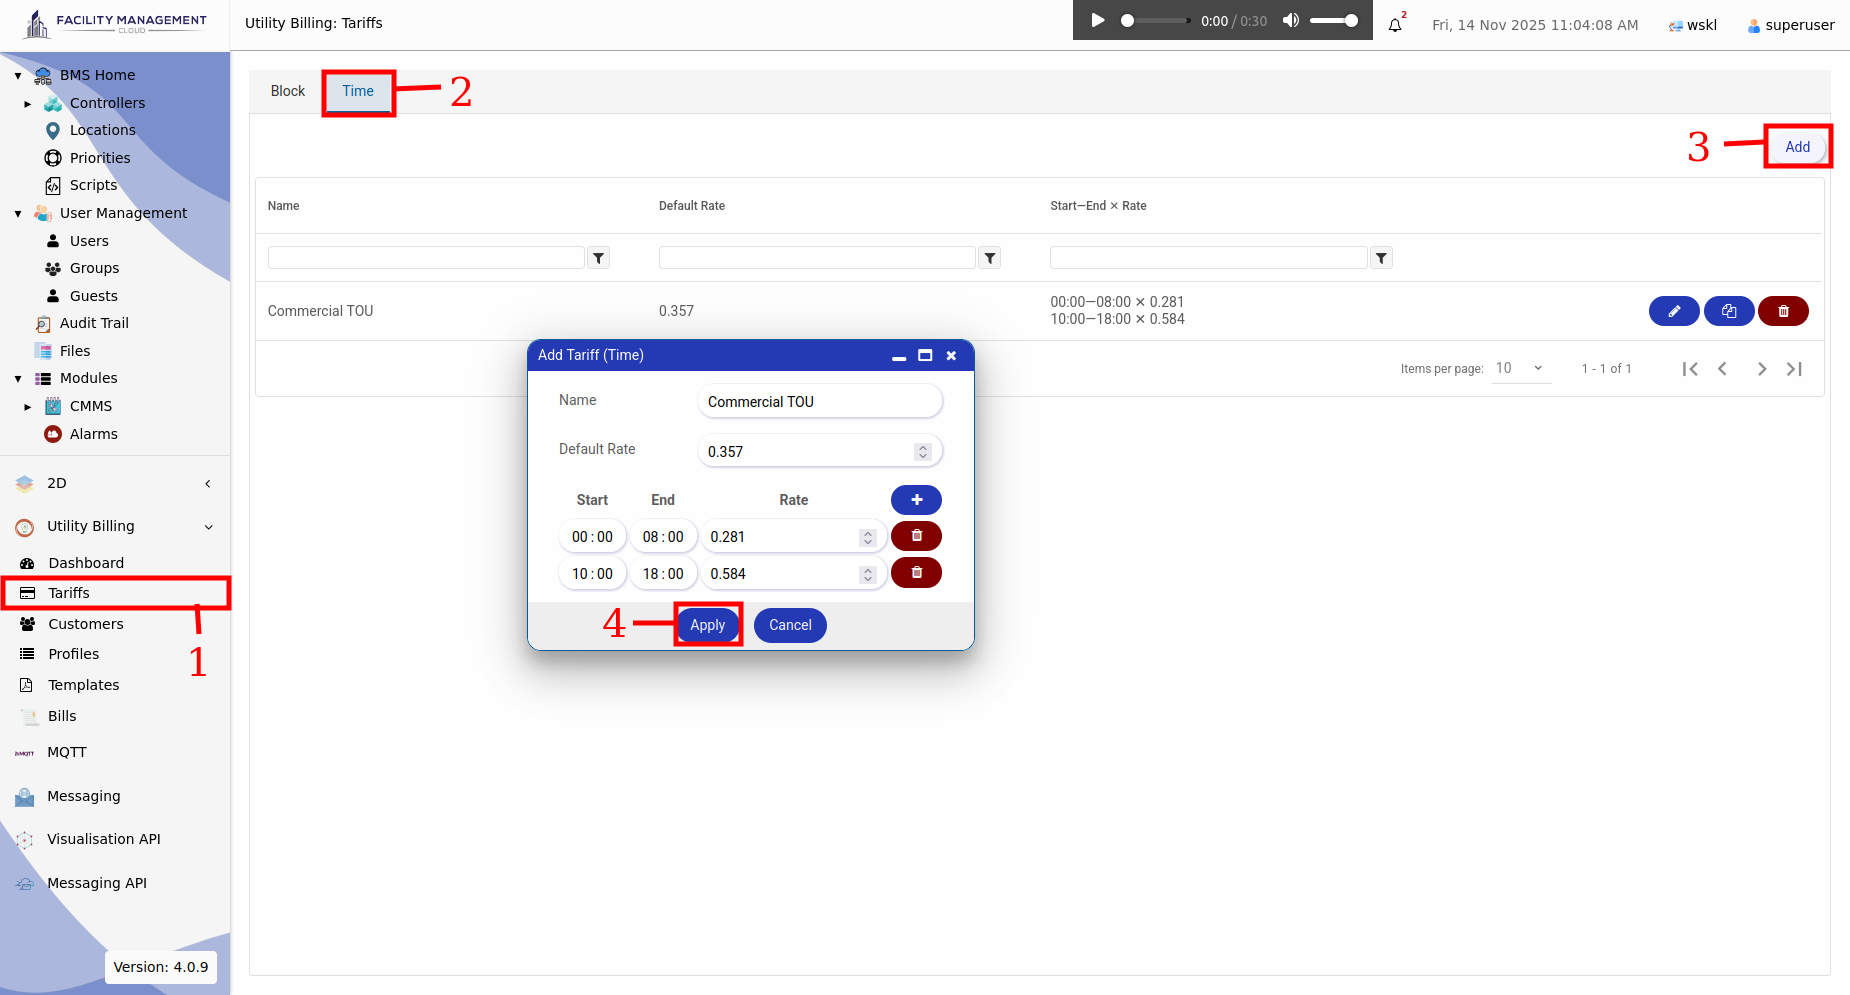
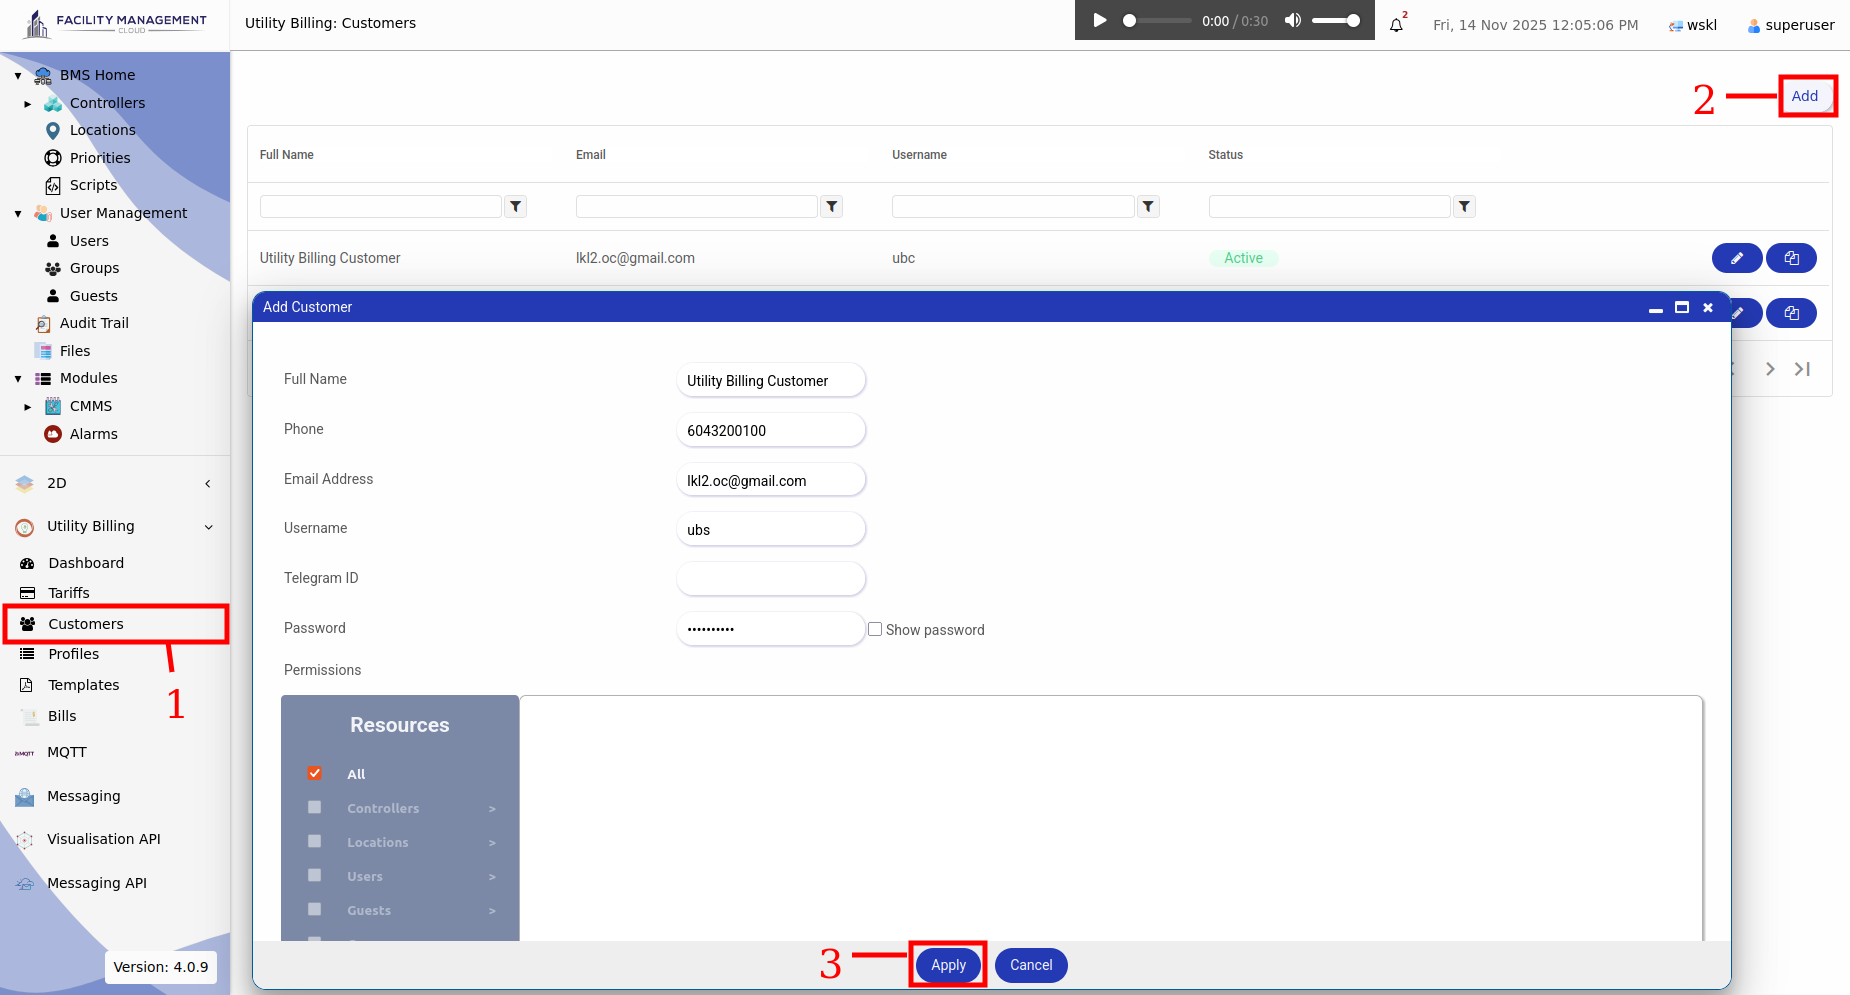
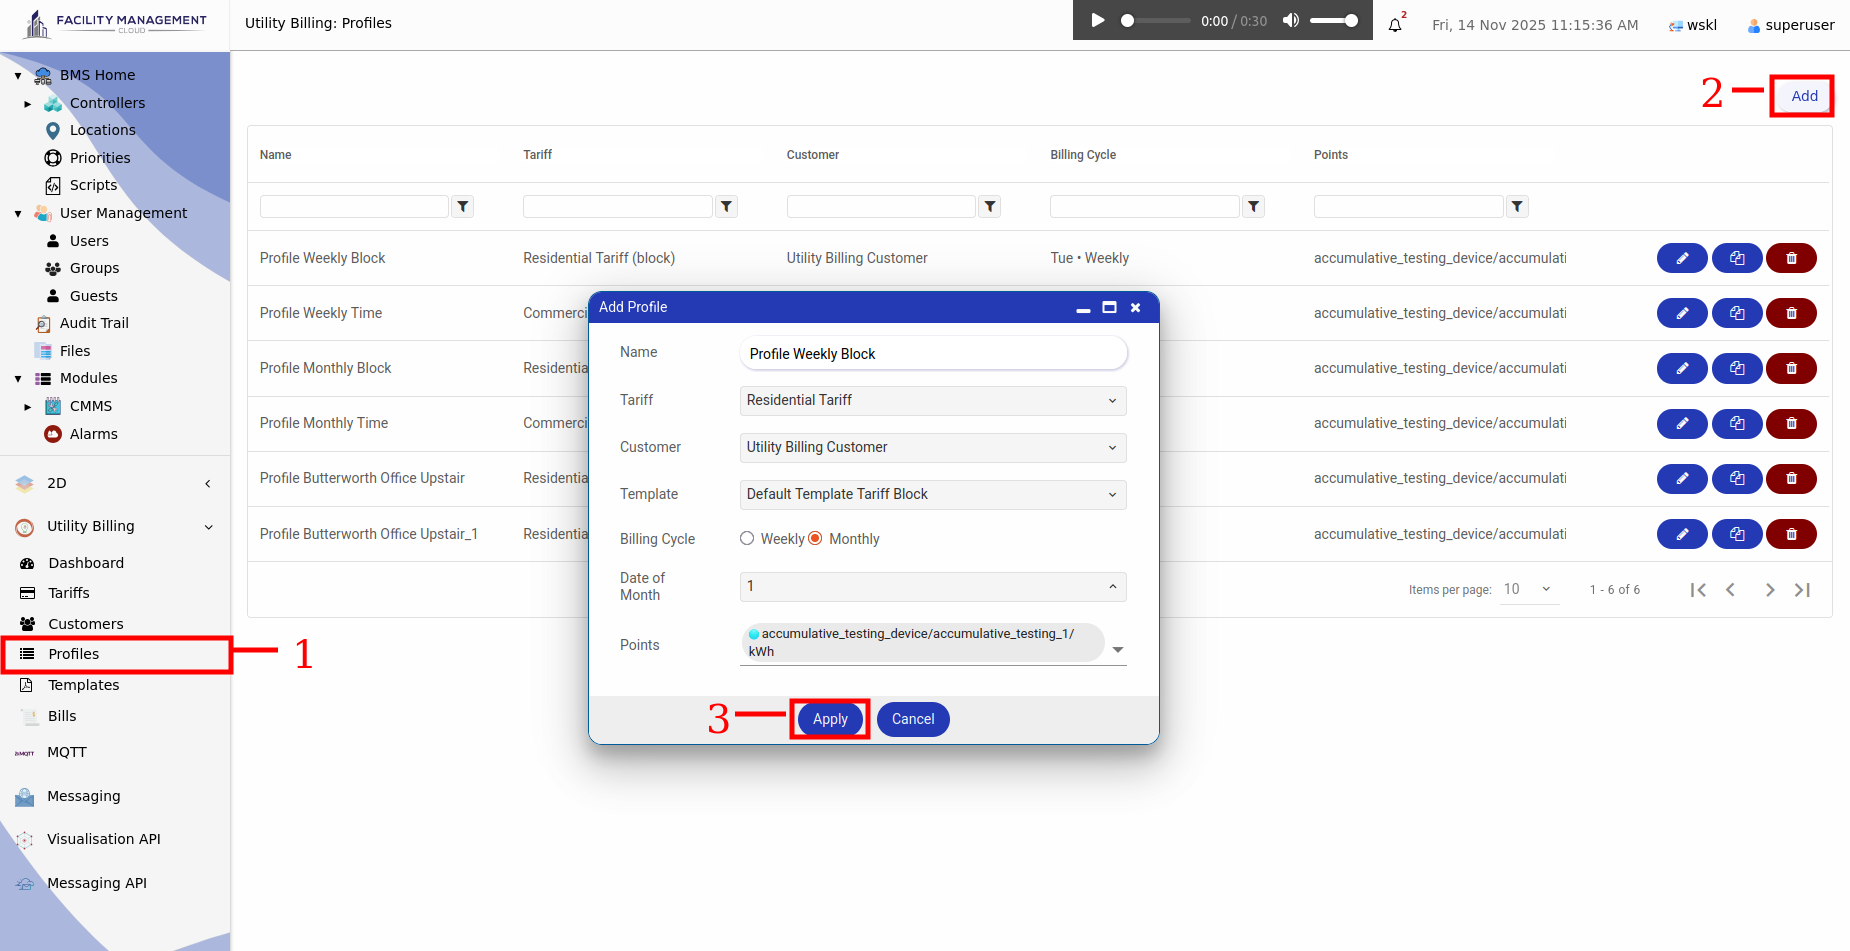
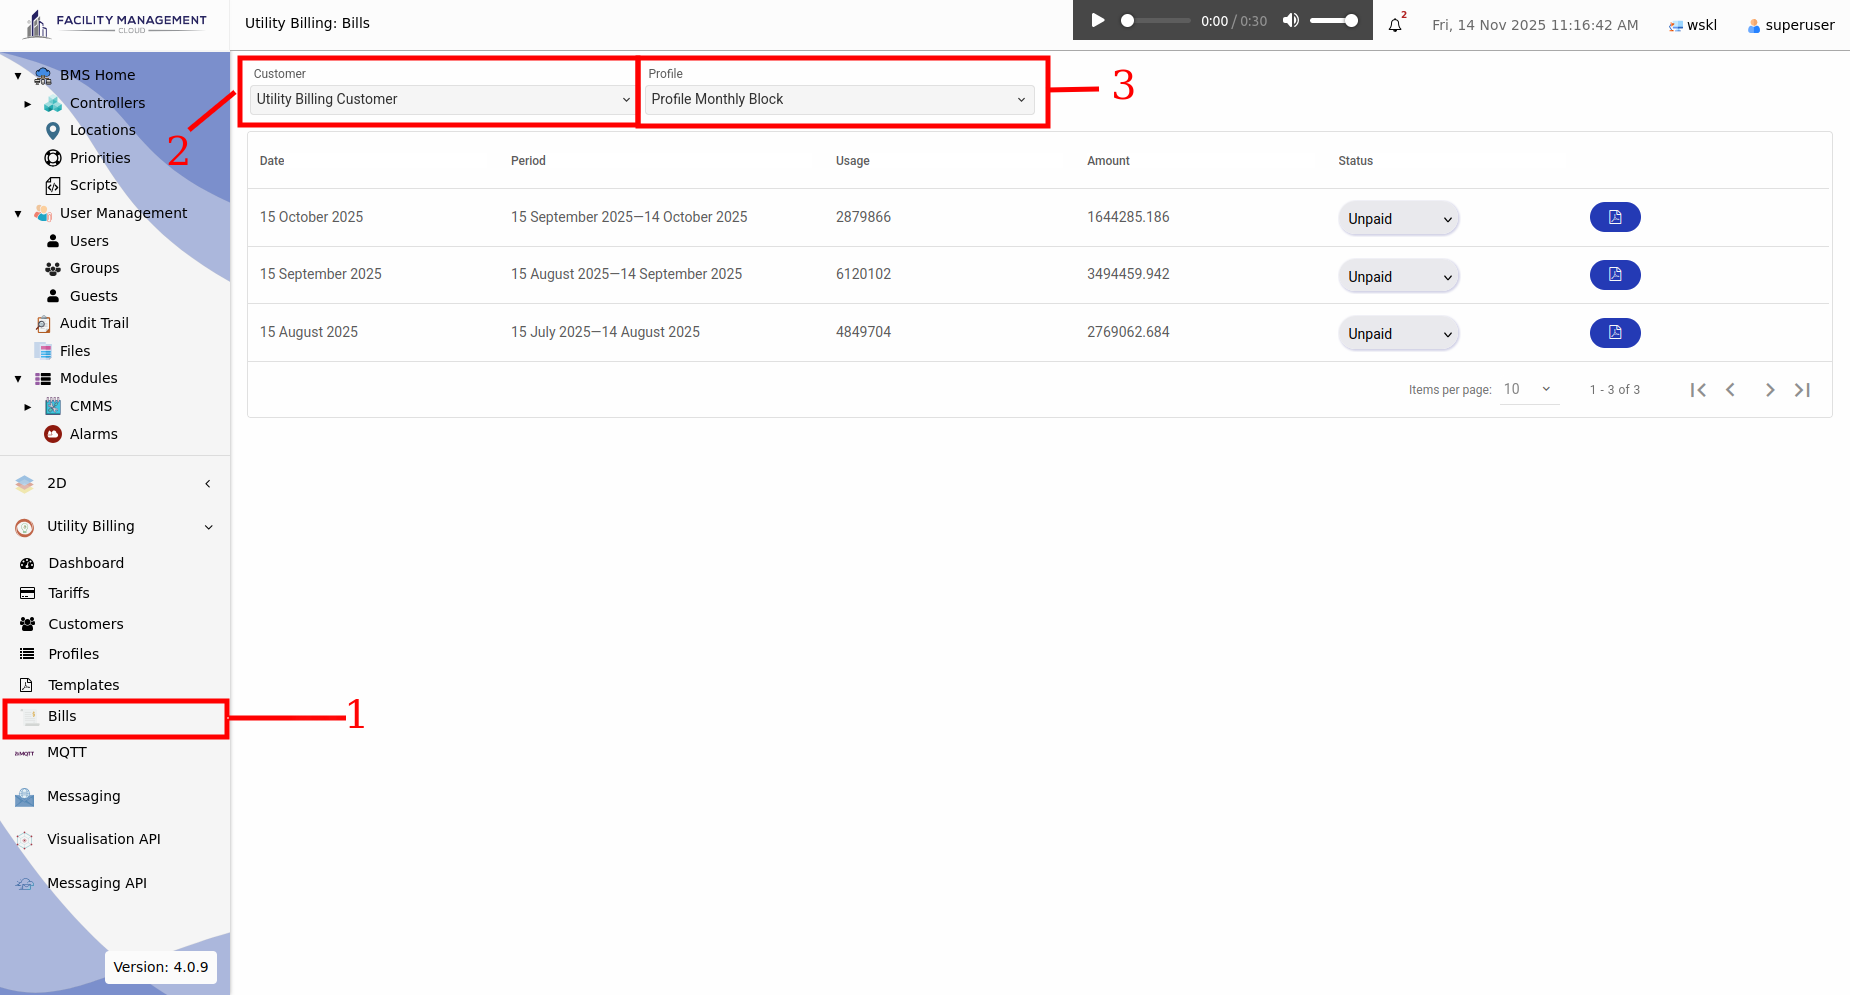
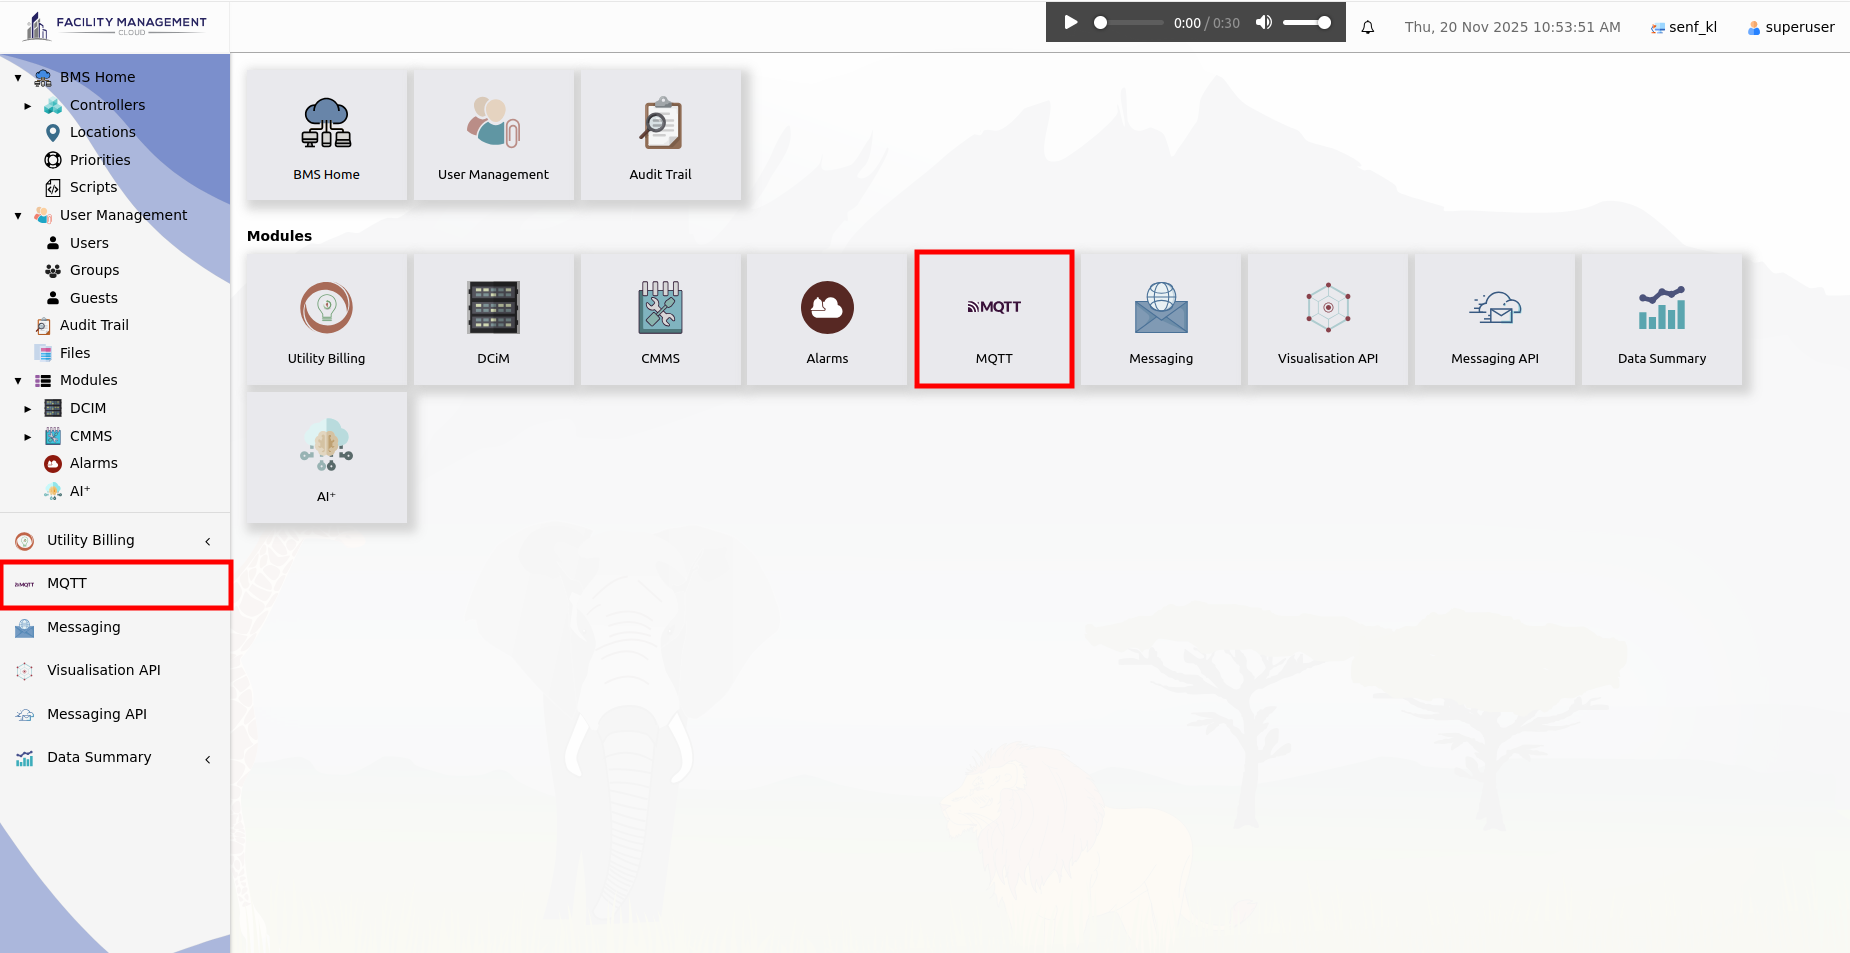
There are three categories found in the MQTT Module, i.e. topics, rogue topics and clients. Topics hold a list of whitelisted MQTT topics. Rogue topics hold a list of MQTT topics published by MQTT clients but not whitelisted. Whereas clients hold a list of client IDs which are used for authentication.
The MQTT Module uses a combination of Username / Password and client ID for authentication, in which the client ID is used to identify the uniqueness of each MQTT client. Users may navigate to the clients tab to add a client ID. A CONNECT request from an MQTT client with no client ID will be rejected. Furthermore, MQTT clients are also required to authenticate as users of the system, the user used for authentication MUST be granted with permission for publishing or subscribing. The status of the client ID will be updated based on what has been done by the MQTT client. There are 4 available actions: 1. Connect, 2. Publish, 3. Subscribe, 4. Disconnect.
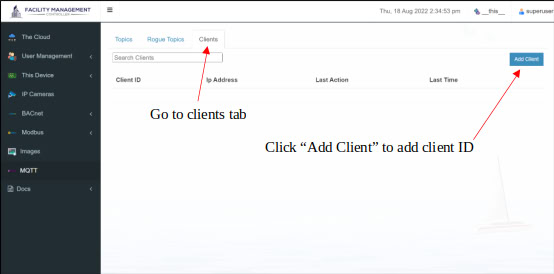
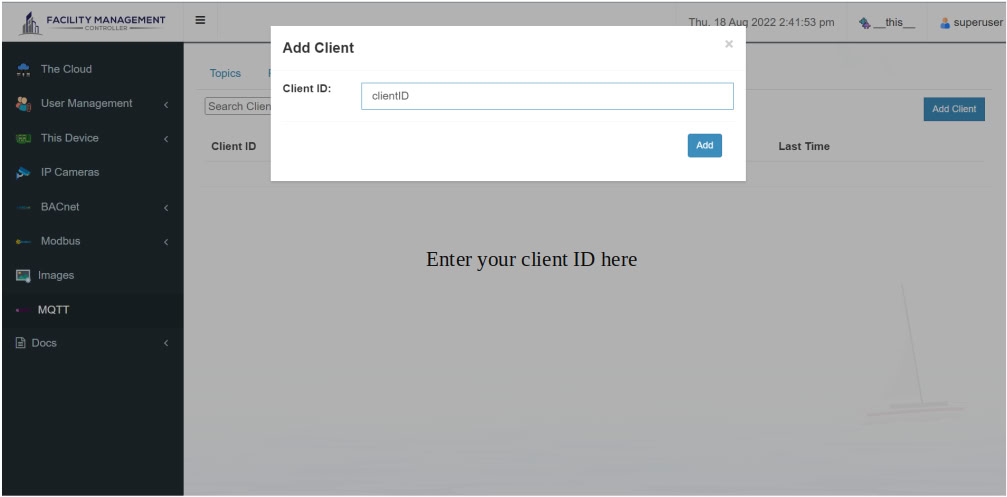
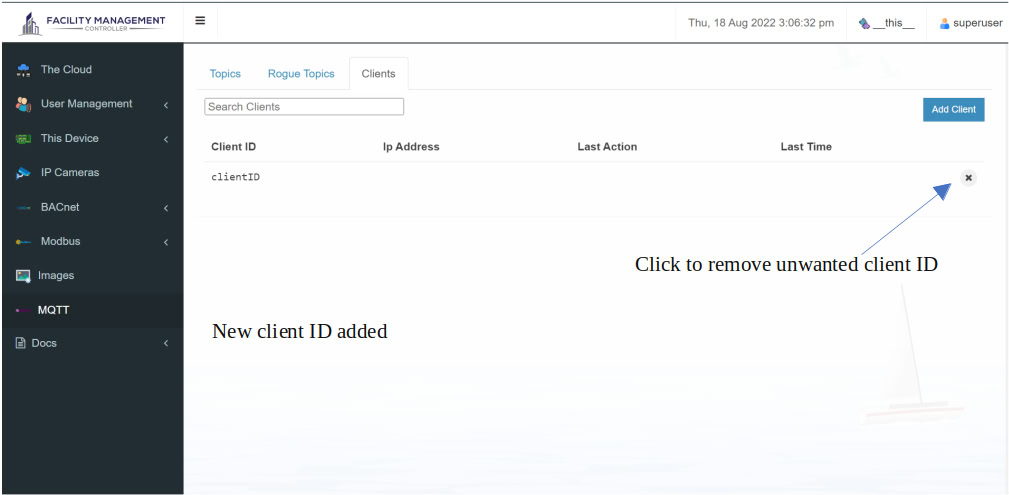
Users of the system are owned by a workspace, An MQTT client is required to provide the workspace of the user. The format of the username will be <workspace>/<username>, e.g. __this__/superuser.
The format of a topic is the same as the format of a username i.e. <workspace>/<topic>. It is worth taking note that it is not necessary for users to add topics into whitelists for publishing. Topics that are not whitelisted when an MQTT client publishes will be kept under rogue topics, MQTT topics that are found in rogue topics are NOT subscribable. For an MQTT topic to be subscribable, users need to add them into the topics tab. MQTT topics under rogue topics will be removed after 5 minutes of inactivity.
Sidenote: the workspace that prefixes a username and topic when publishing or subscribing MUST match.
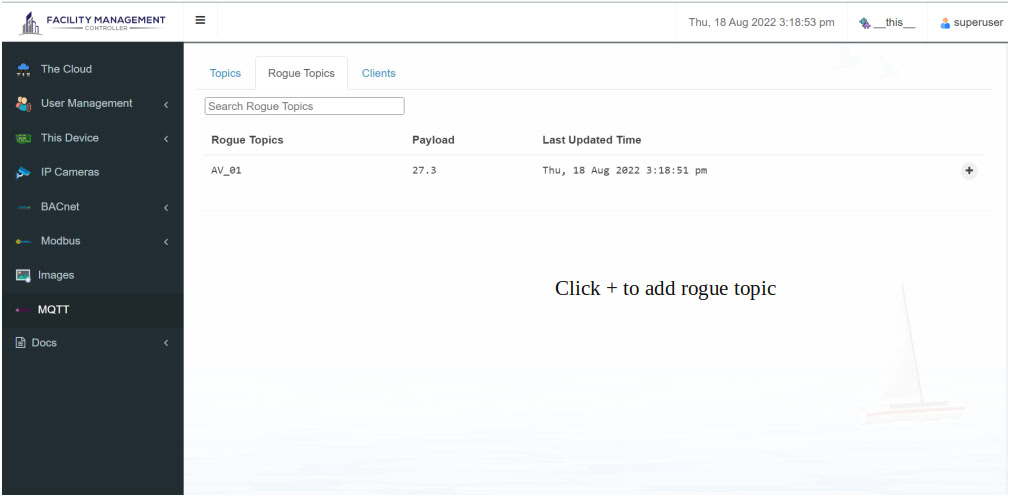
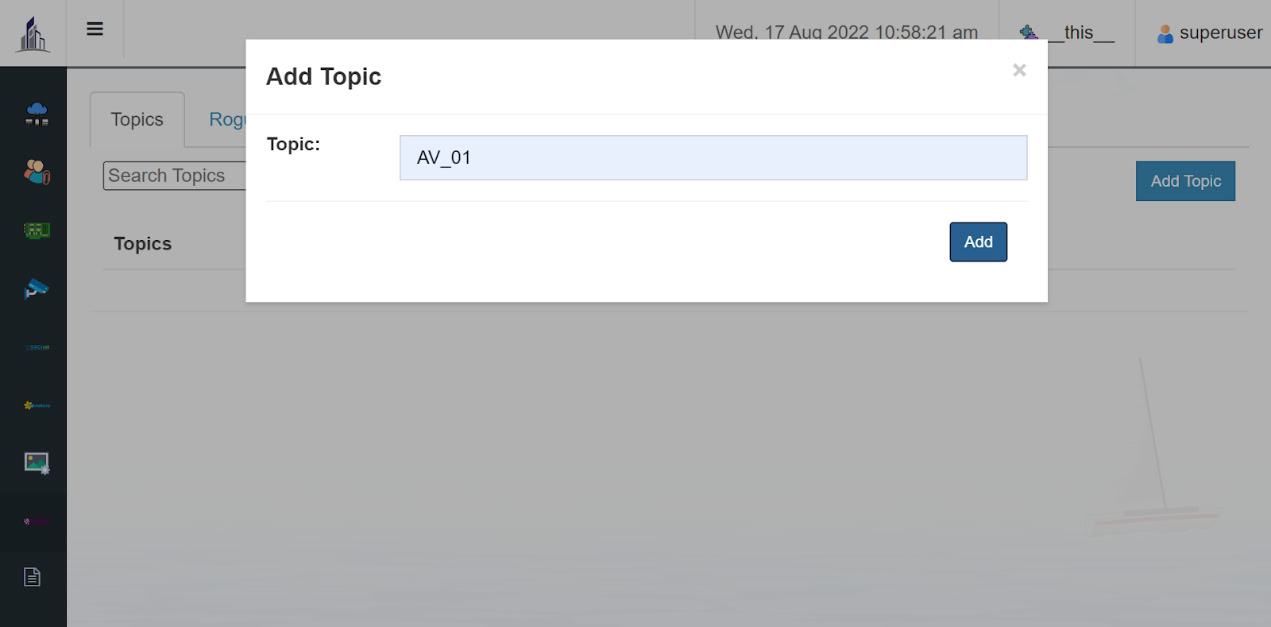
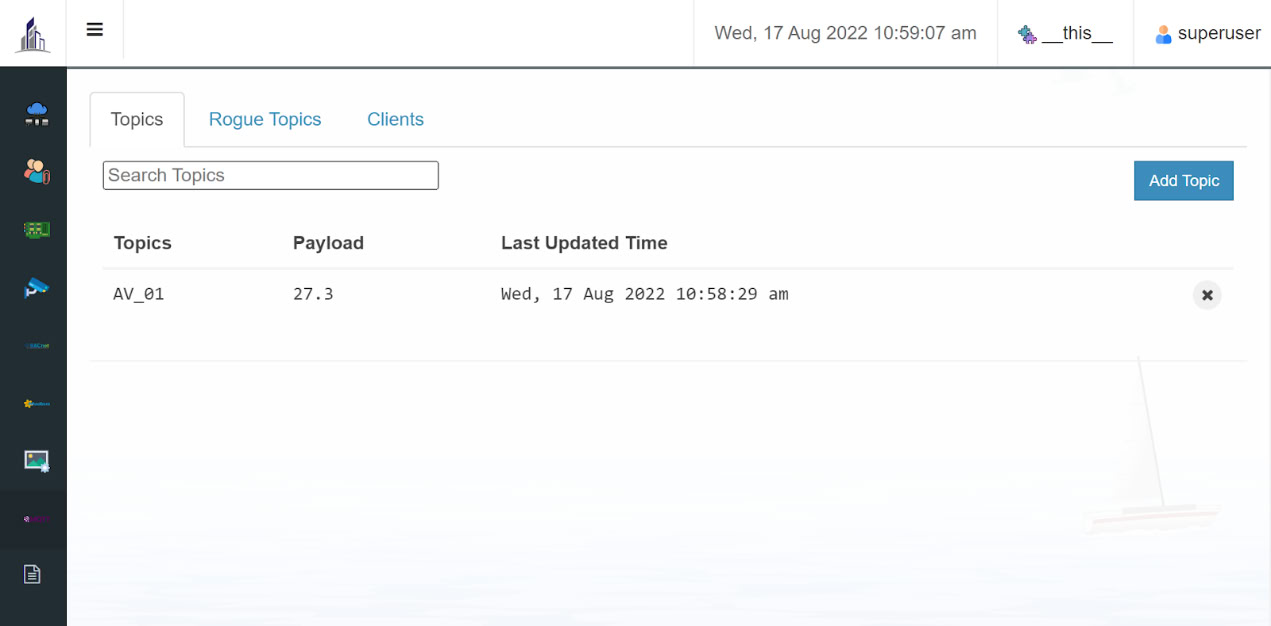

The MQTT Module on its own, can be treated as an MQTT broker with additional authentication and authorisation added. MQTT clients can perform publishing and subscribing with the MQTT Module. MQTT topics published by an MQTT client will be kept internally within the module. The payload of a whitelisted MQTT topic will be retained by the system throughout its runtime, whereas MQTT topics that are not in the whitelist will be discarded after 5 minutes of not being published by an MQTT client.
Besides publishing and subscribing, the value/payload of an MQTT topic is sourced from that of a point. A point is tied to an MQTT topic through a point URL. A point can retrieve the value of the MQTT topic by resolving the point URL to get to its source. Other than that, setting the value of a point tied to that of an MQTT topics also alters the value/payload of the corresponding MQTT topic.
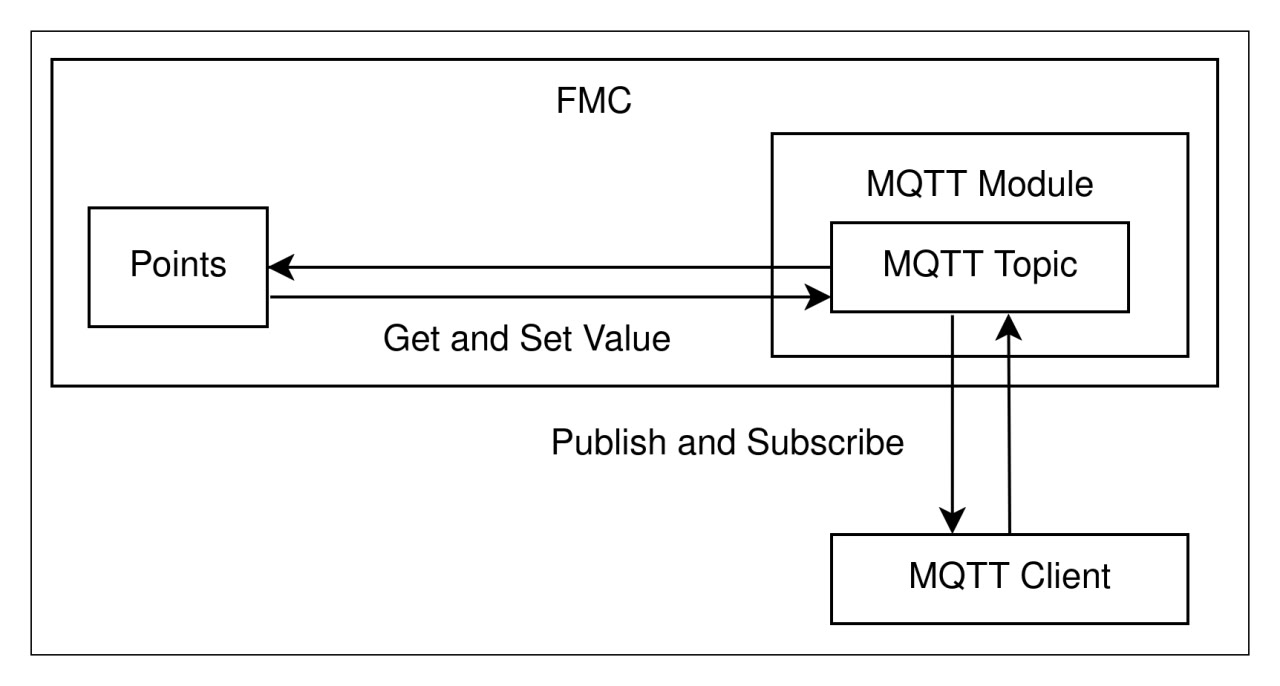
The format of a point URL has the form mqtt://<workspace>/<topic> which is prefixed with the scheme mqtt://. <workspace> is the placeholder of the name of the workspace where the topic is whitelisted and <topic> is the topic as defined in the MQTT module’s whitelist of topics.
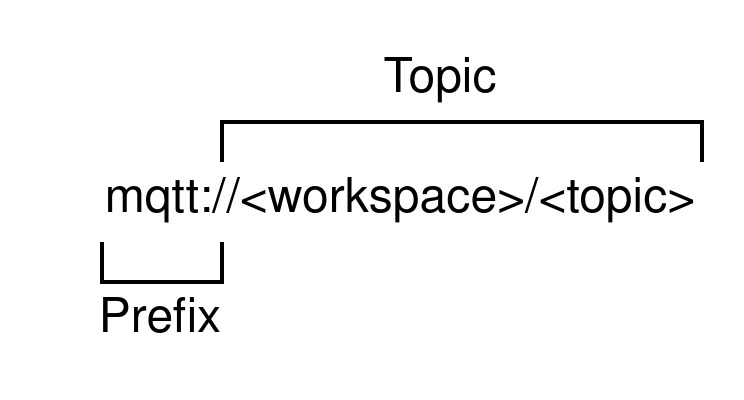
E.g. mqtt://__this__/AV_01.
The workspace specified in <workspace> must be the workspace of the point that is referencing the MQTT topic.
Enter your workspace name, or scan your workspace QR.
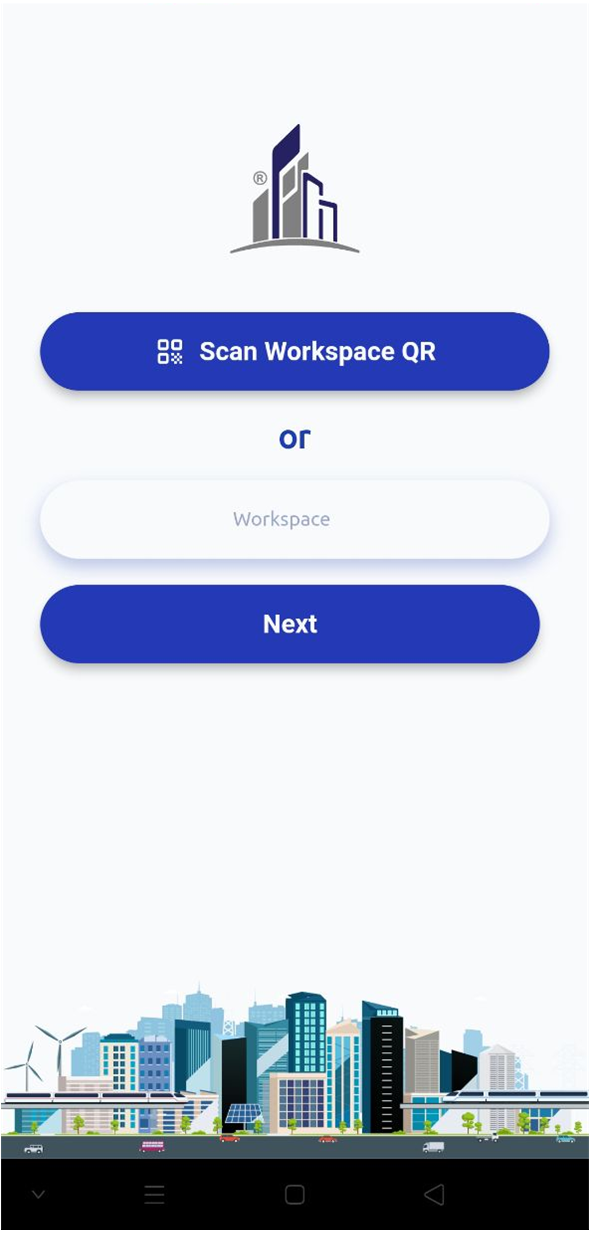
Enter your username and password.
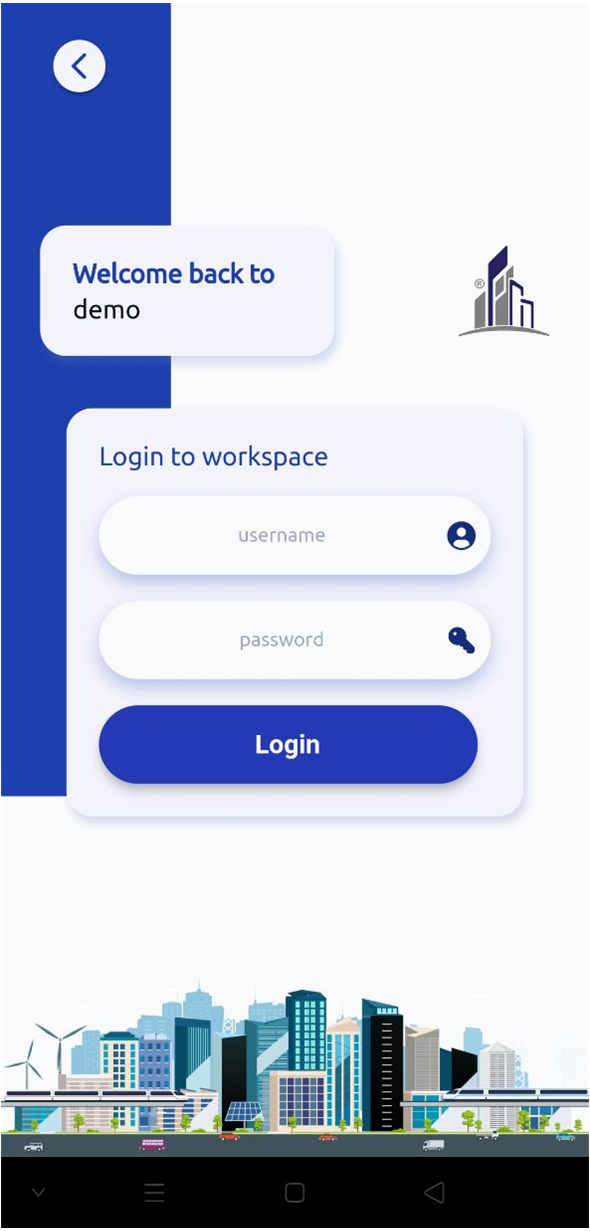
Assets in a CMMS are tangible resources requiring regular maintenance. They include equipment, machinery, vehicles, infrastructure, and facilities. CMMS feature helps track and manage assets by recording details, maintenance history, and work orders. It enables preventive maintenance scheduling and monitoring asset performance. Effective asset management in a CMMS improves maintenance efficiency and maximises the value of physical resources.
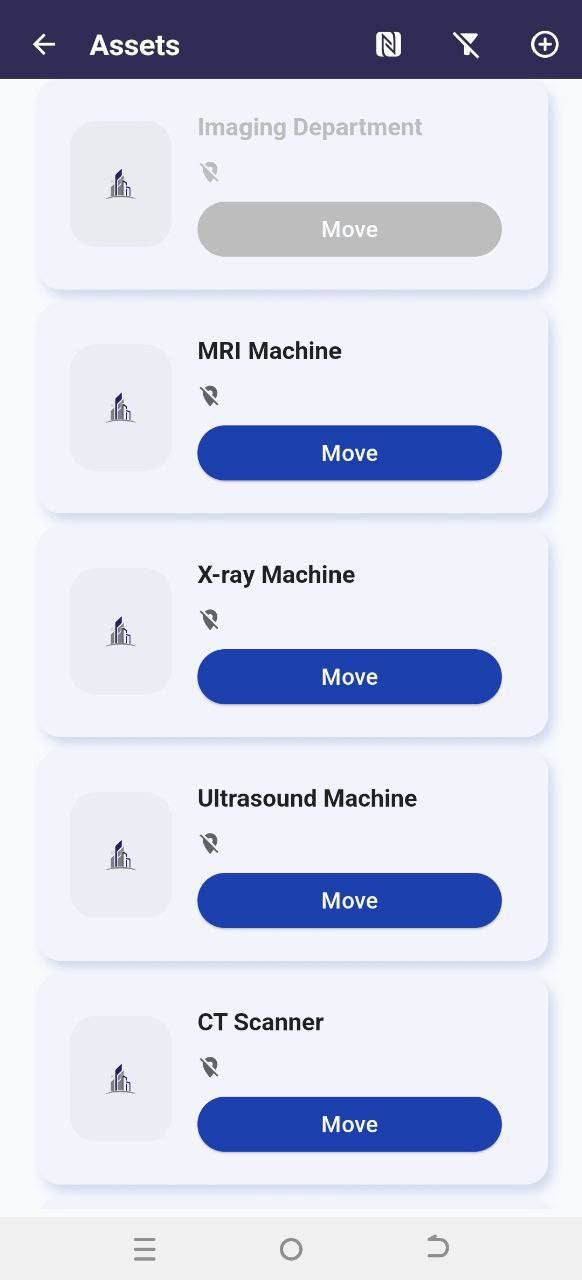
Click on the  on the right top page.
Fill in the asset details, and click Apply to proceed.
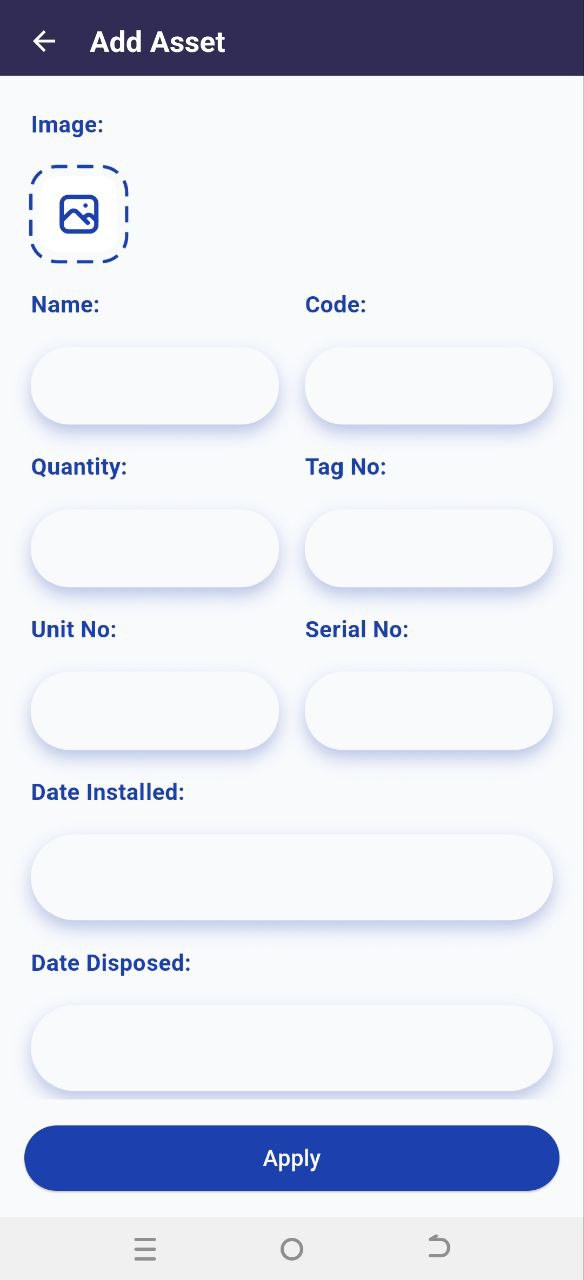
You will have the input fields as shown as below:
Auto-create work orders when complaints are received: Auto-create work orders when complaints are received: When enabled, whenever this asset receives a complaint, it will automatically generate a corresponding work order for the staff.
To edit assets, just click on the asset you want to modify.
When the current date is past the disposal date of an asset, it becomes a disposed asset. Disposed assets are not allowed to be modified — they can only be viewed.
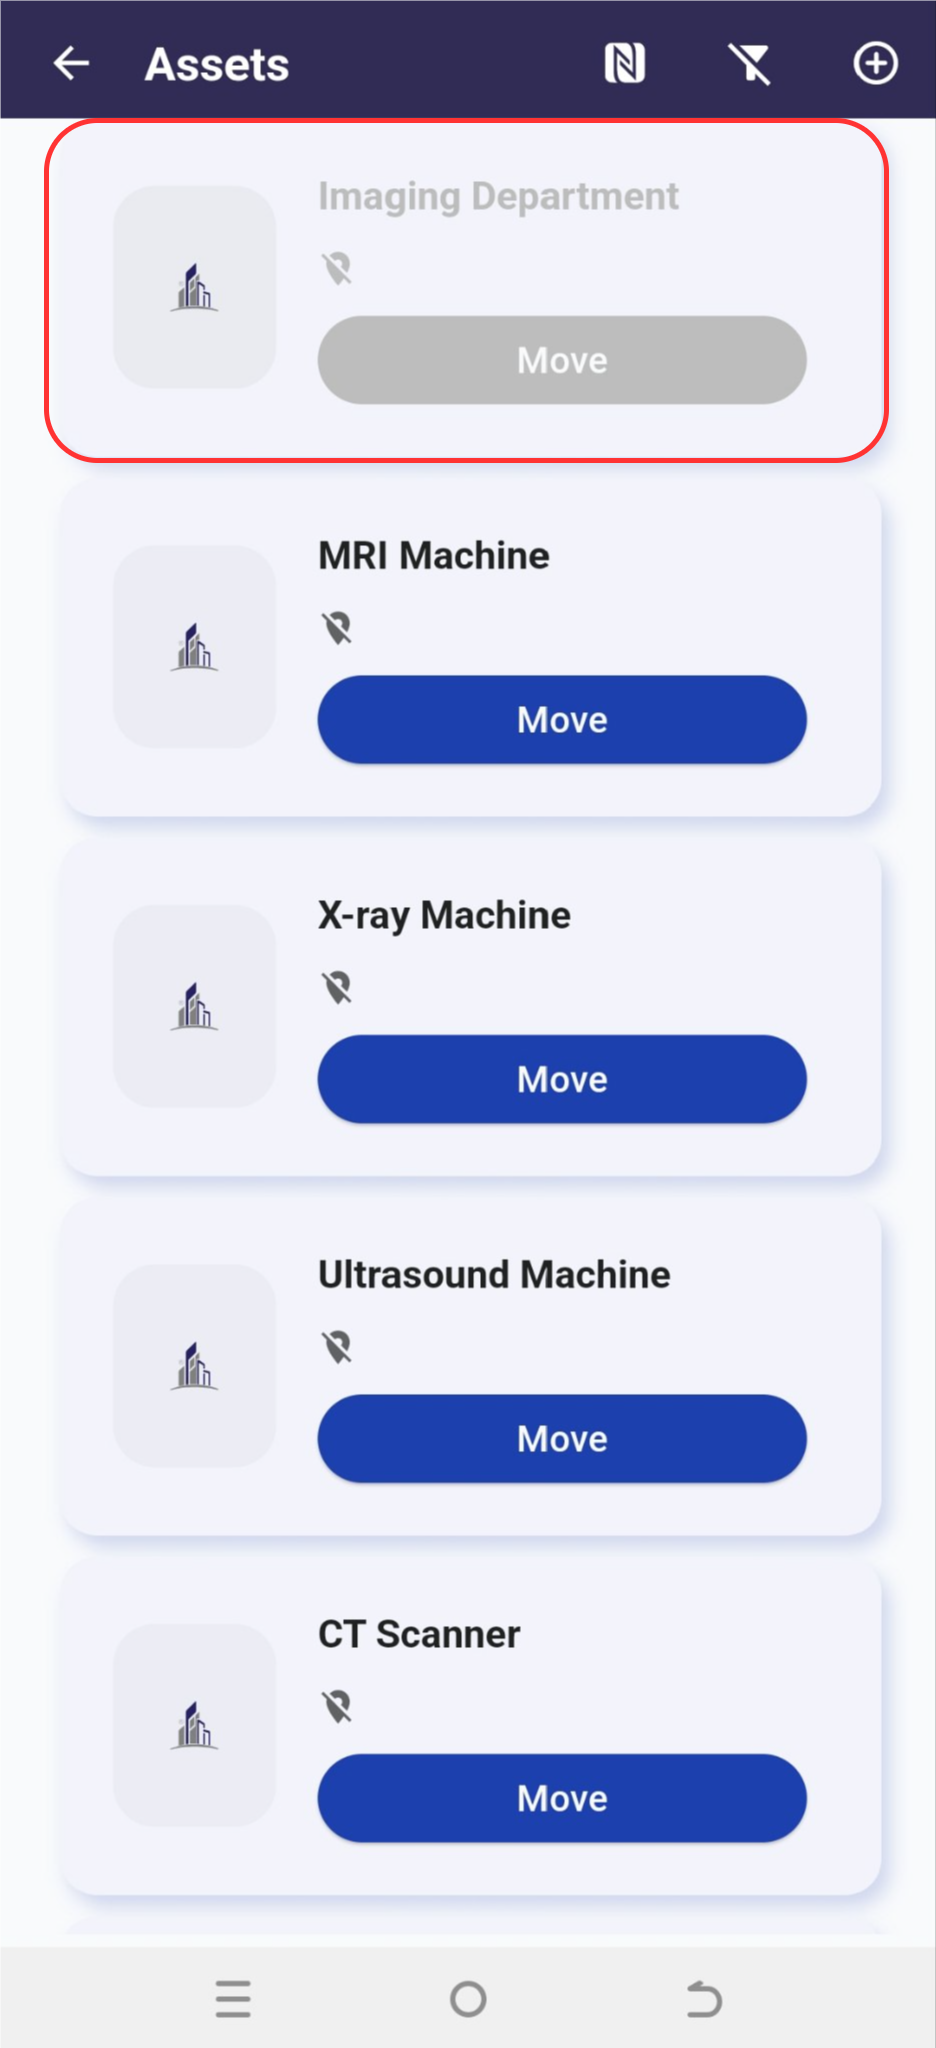
NFC is a short-range wireless technology that allows devices to communicate with each other when they are close together. In our system, NFC acts as a tool to read asset details and make complaints with a simple tap of an NFC card. To view asset details, the user needs to log in to the workspace. If the user is active and has the privilege to view the asset, using the NFC scanning tool in our application will directly navigate them to the asset details page. Otherwise, if the user is using the phone’s default scanner or is not a member of the workspace, they will be redirected to a complaint page to submit a complaint.
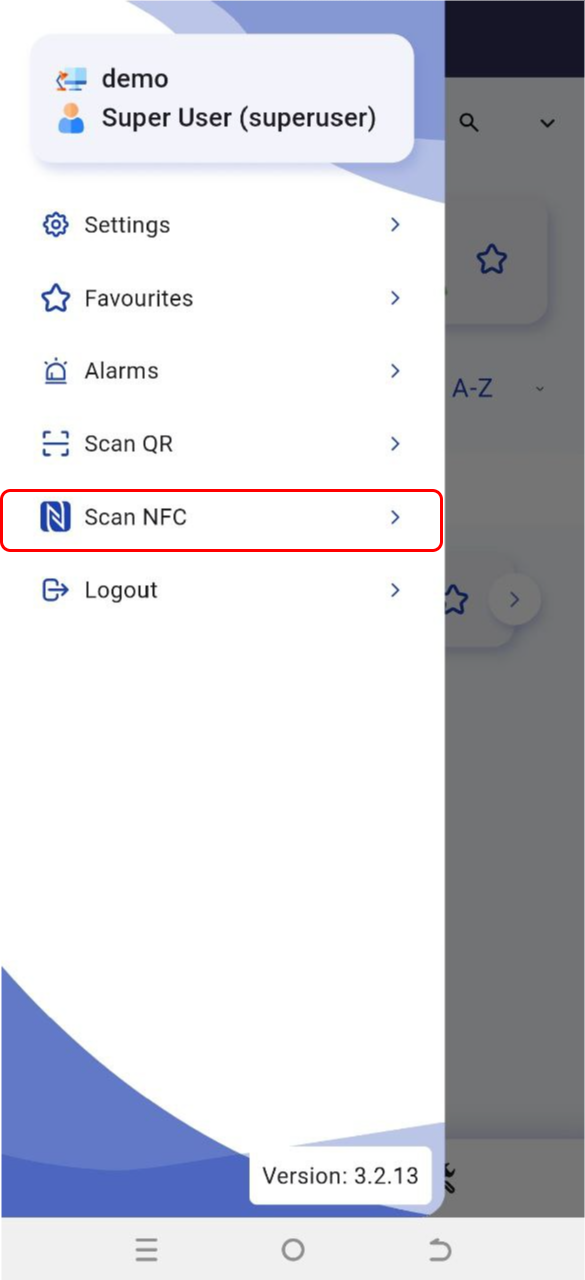
By using the NFC, make the process getting easier compare to using the QR code.
To use the NFC, you should write the assets data in your NFC card, to manage the NFC tag select the asset and click  .
.
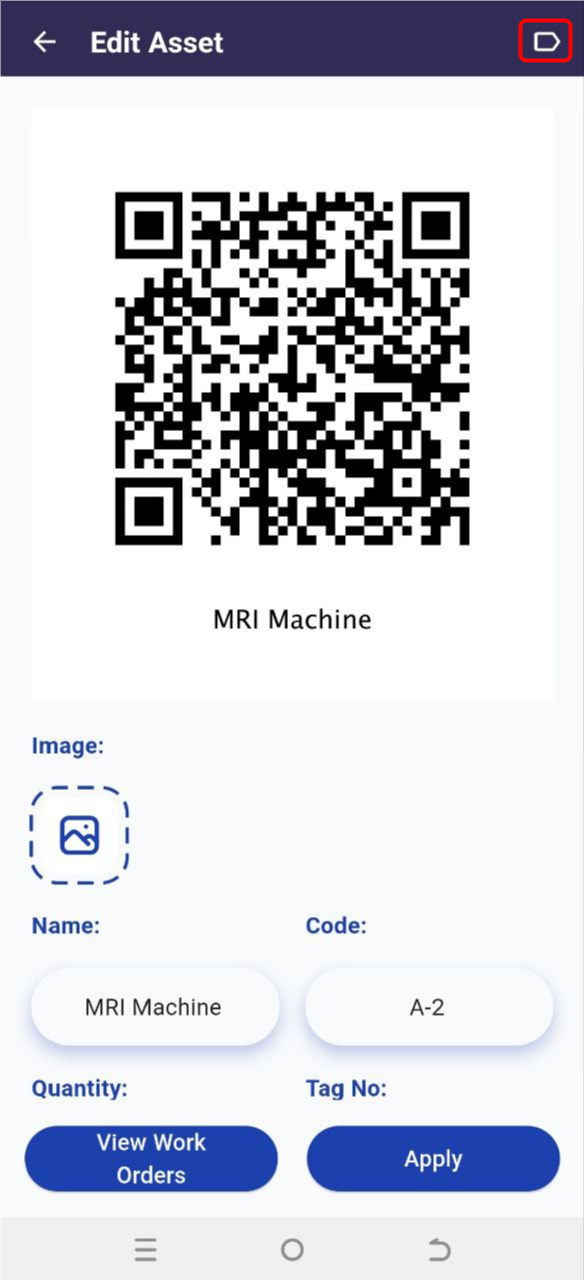
After that, you will enter a page. Which it will show the current tag for the asset.
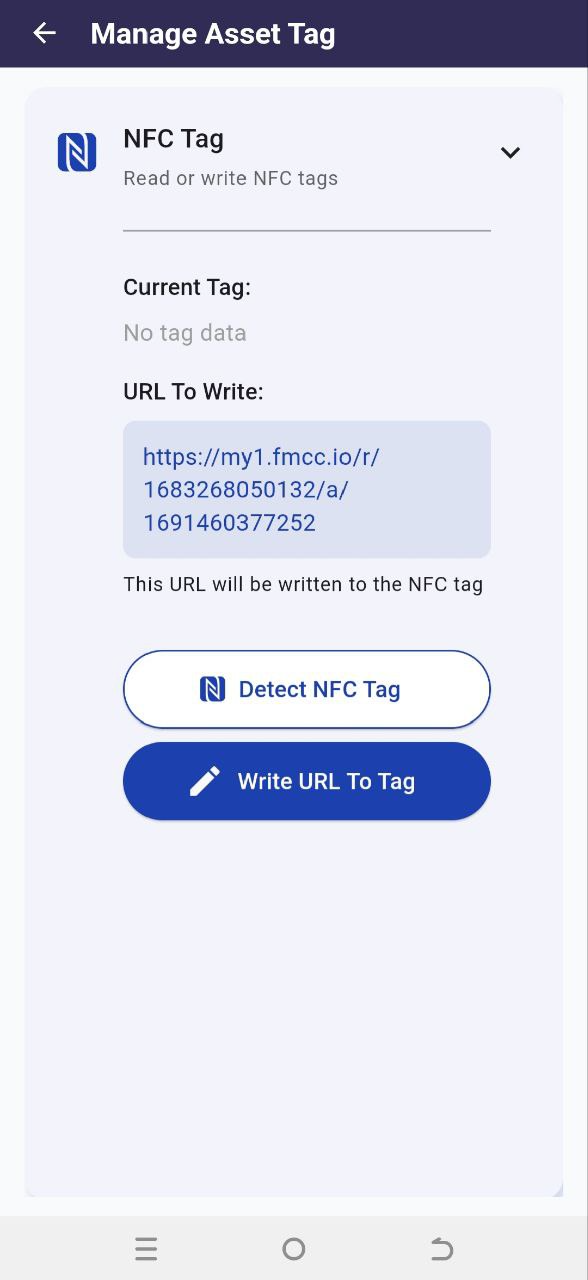
Detect NFC Tag is used to read the URL from your tag and check whether it has been used before you overwrite it with a new URL. Click the "Detect NFC Tag" button and scan the NFC tag, the tag data will be displayed in the "Current Tag" section.
Write URL to Tag is used to overwrite the current asset's URL onto your tag.
A service task refers to a specific type of task that is performed within a business or operational context to provide a service or carry out a particular action. It often involves delivering a service to customers, clients, or internal stakeholders. Service tasks can encompass a wide range of activities and may vary depending on the industry or sector.
In the context of maintenance management or Computerised Maintenance Management Systems (CMMS), service tasks typically relate to activities performed to ensure the proper functioning, repair, or maintenance of equipment, machinery, facilities, or assets. These tasks are designed to keep assets in optimal condition, prevent breakdowns, and ensure the longevity of the equipment.
Service tasks in CMMS may include activities such as routine inspections, preventive maintenance, repairs, calibration, cleaning, and other actions aimed at ensuring the efficient operation of assets. These tasks are often scheduled, assigned to specific personnel, and tracked to ensure that maintenance activities are completed in a timely and effective manner.
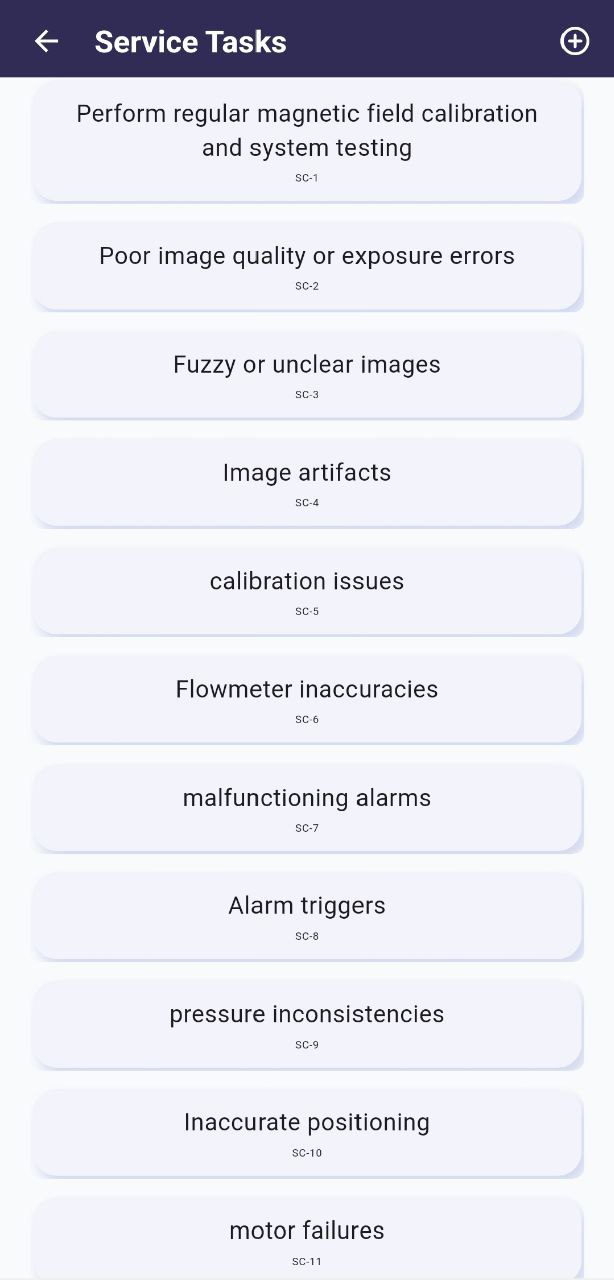
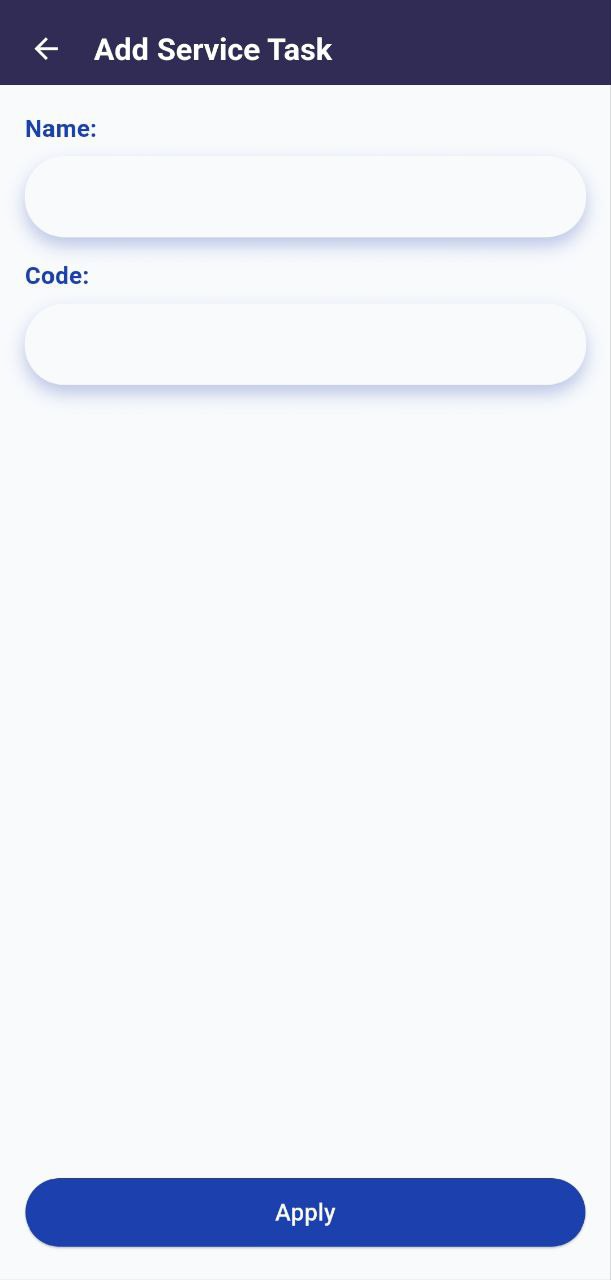 at the right corner.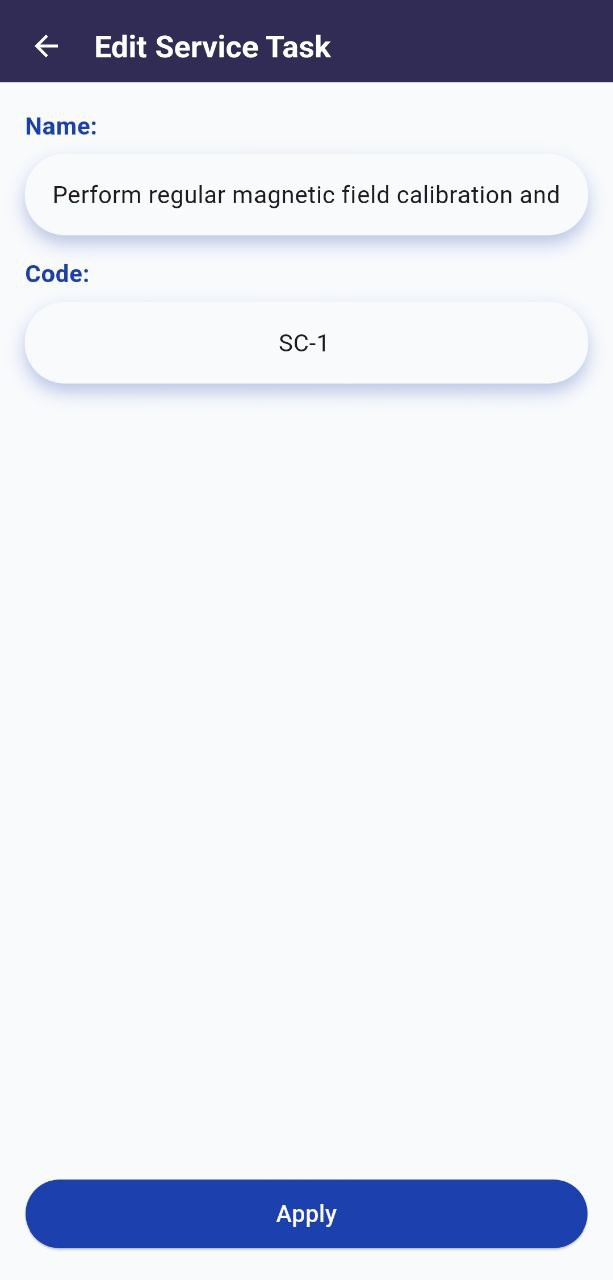
In CMMS, complaints refers to the issues, problems and concerns that are reported by the users, maintenance managers or stakeholders regarding the condition and situation of an asset. Complaints can arise from various sources, including employees, customers, residents, or anyone interacting with the assets in question. CMMS systems often include a feature to manage and address these complaints effectively.
Maintenance managers can predetermine the complaints that would happen in the future, and associate the possible complaints to the respectively assets.
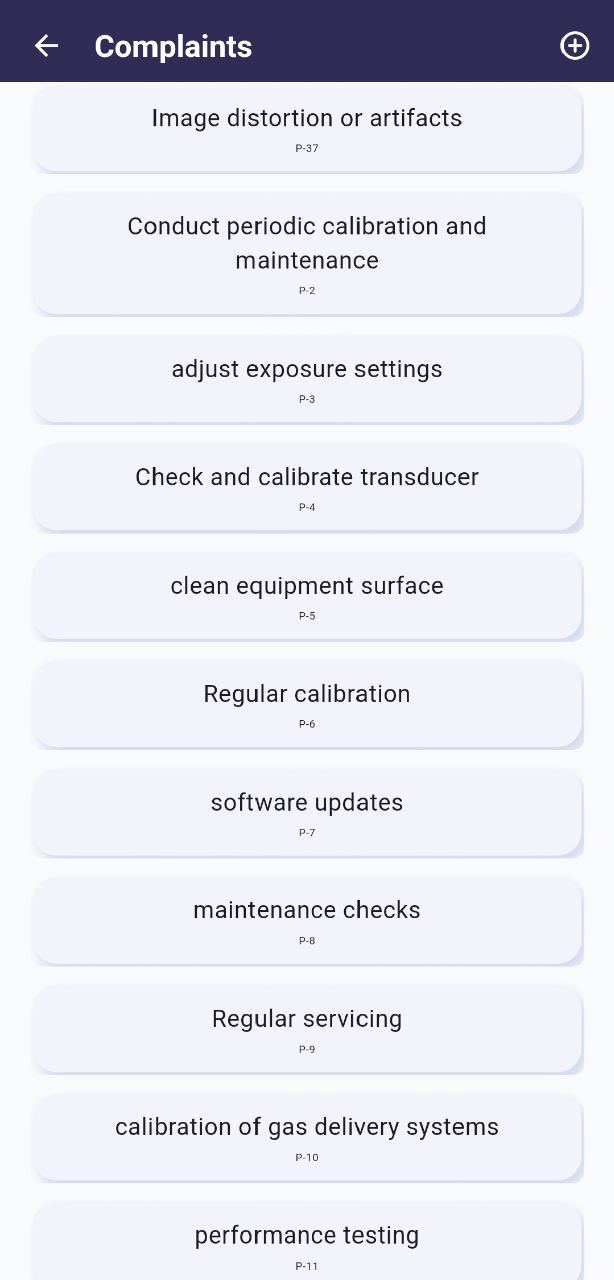
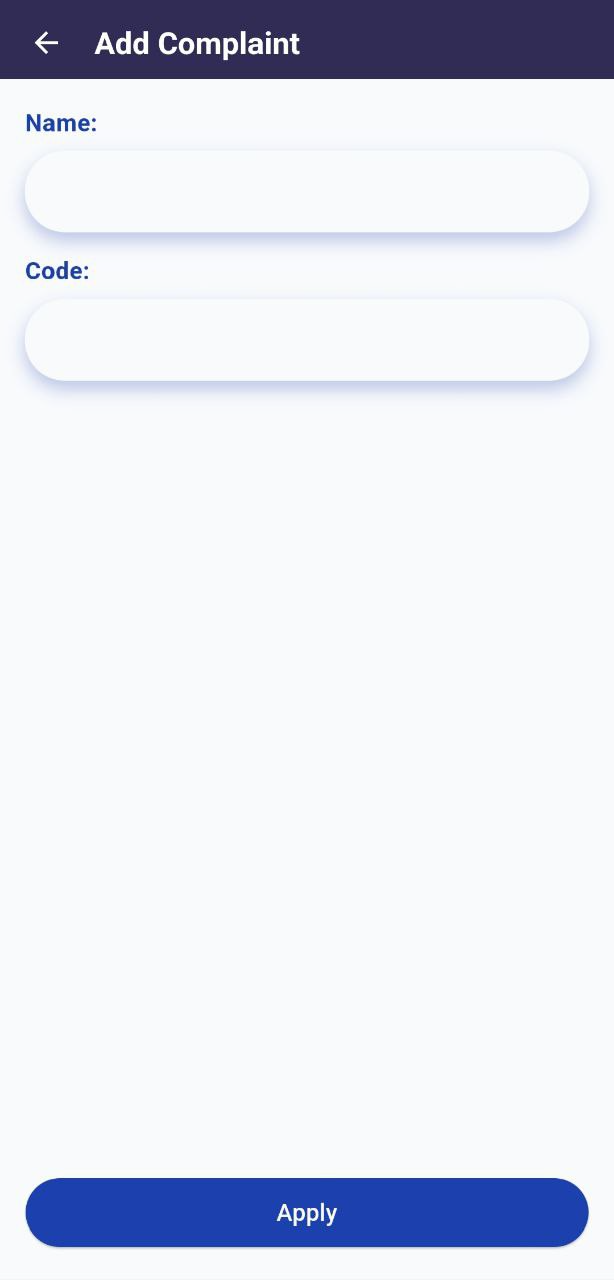 at the right corner.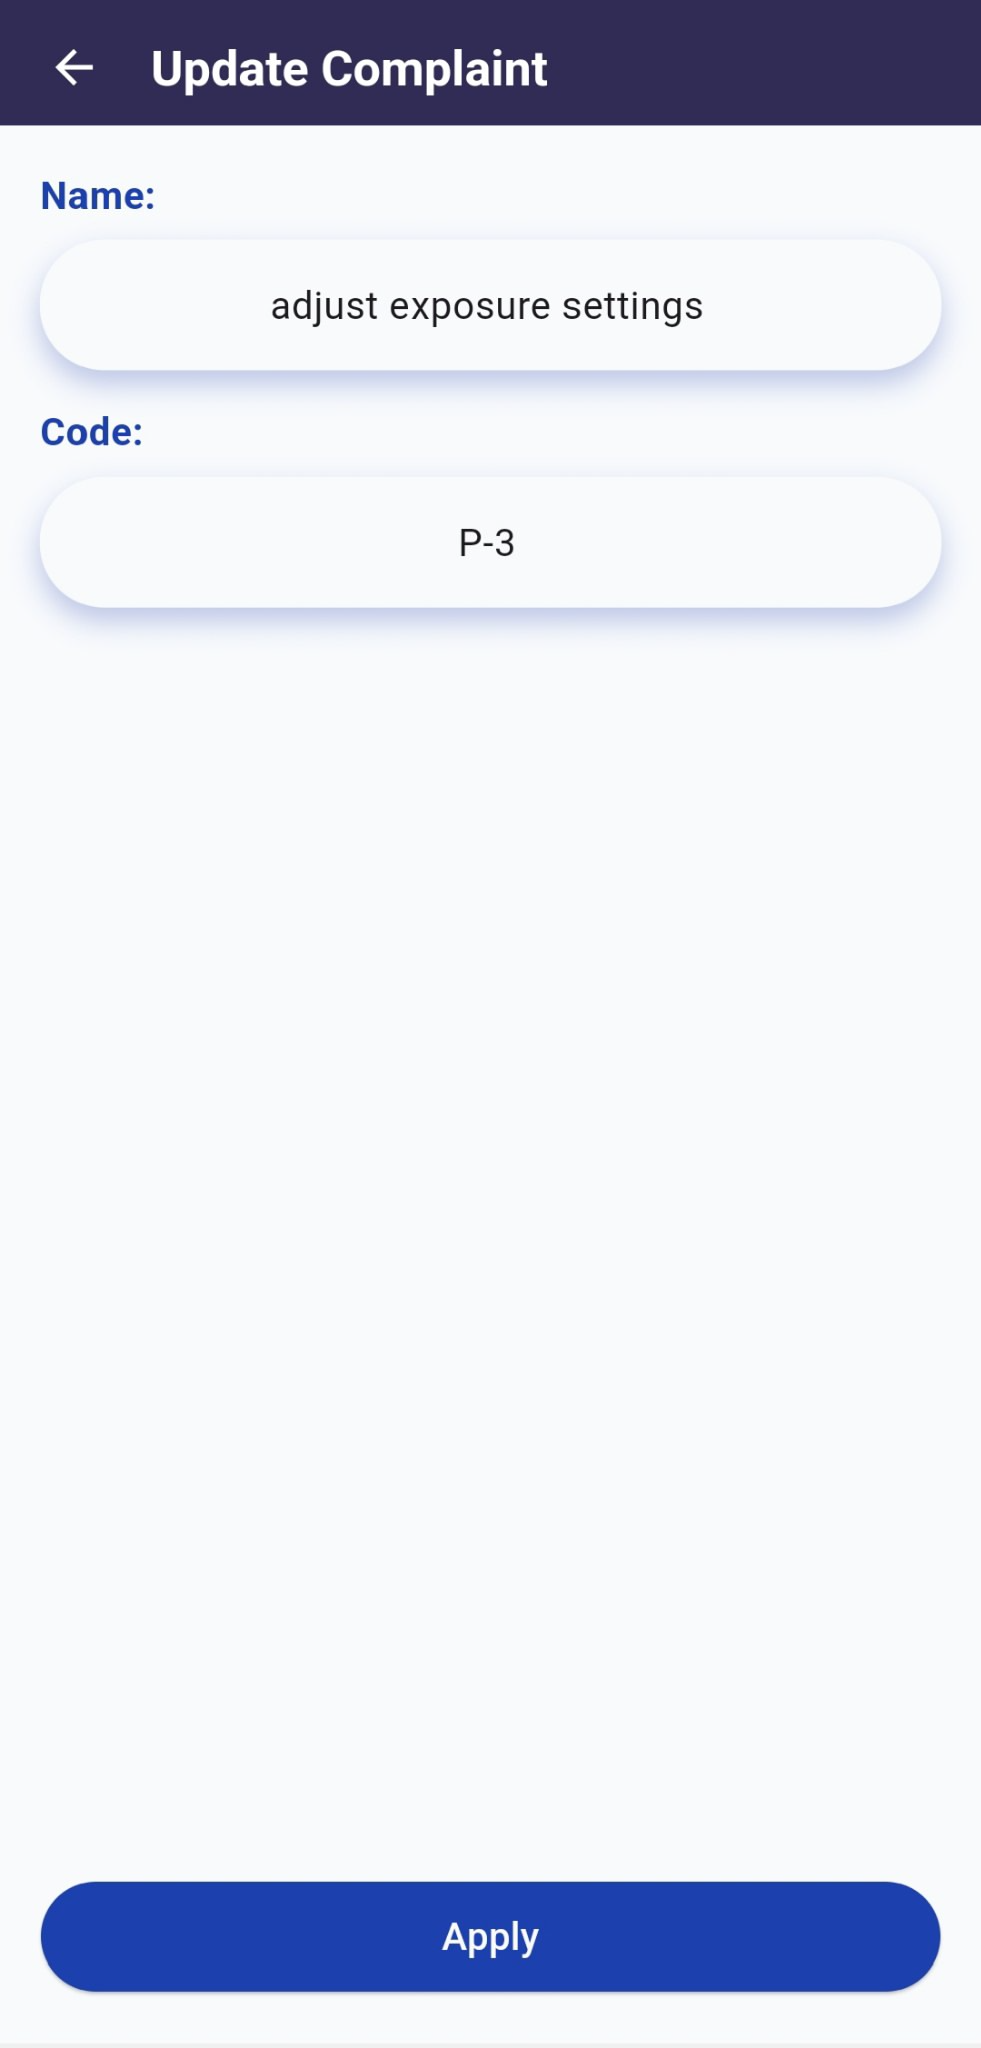
Active Work Orders (WO) feature displays the opened work orders that need to be completed by the user. Users can manage the work orders more easily in Active WO.
The criteria for a work order to appear in the Active Work Orders (WO) list includes the following:
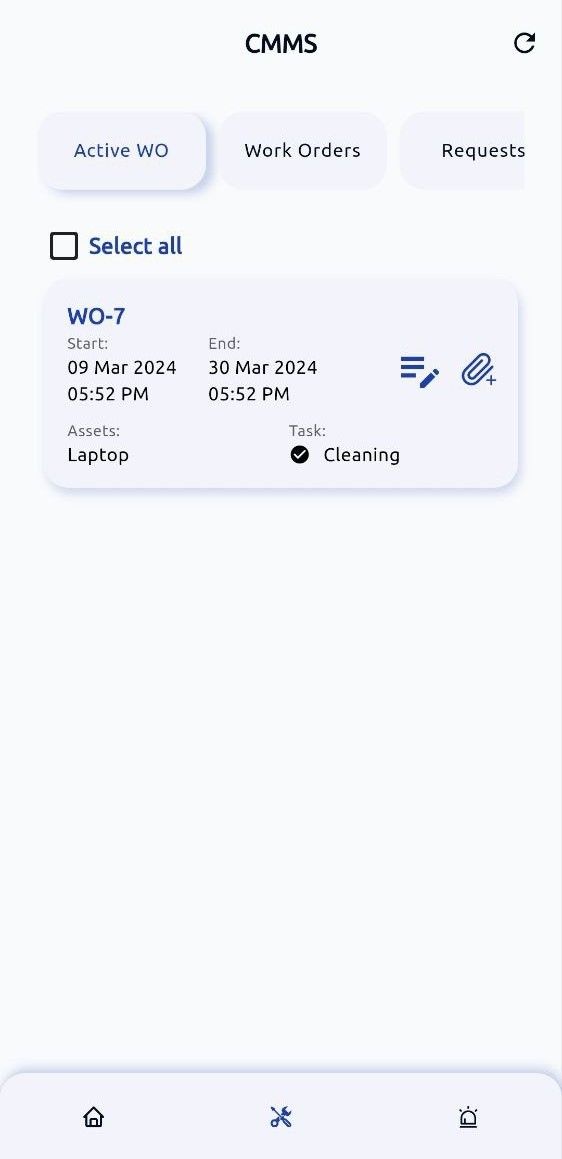
You can download and install FMC BMS on both iOS and Android devices.

Or download the app from the App Store: 
Or get it on Google Play: 
This guide walks you through the essential steps to get everything up and running, from powering on a new controller to accessing its user interface and linking it to your cloud workspace.
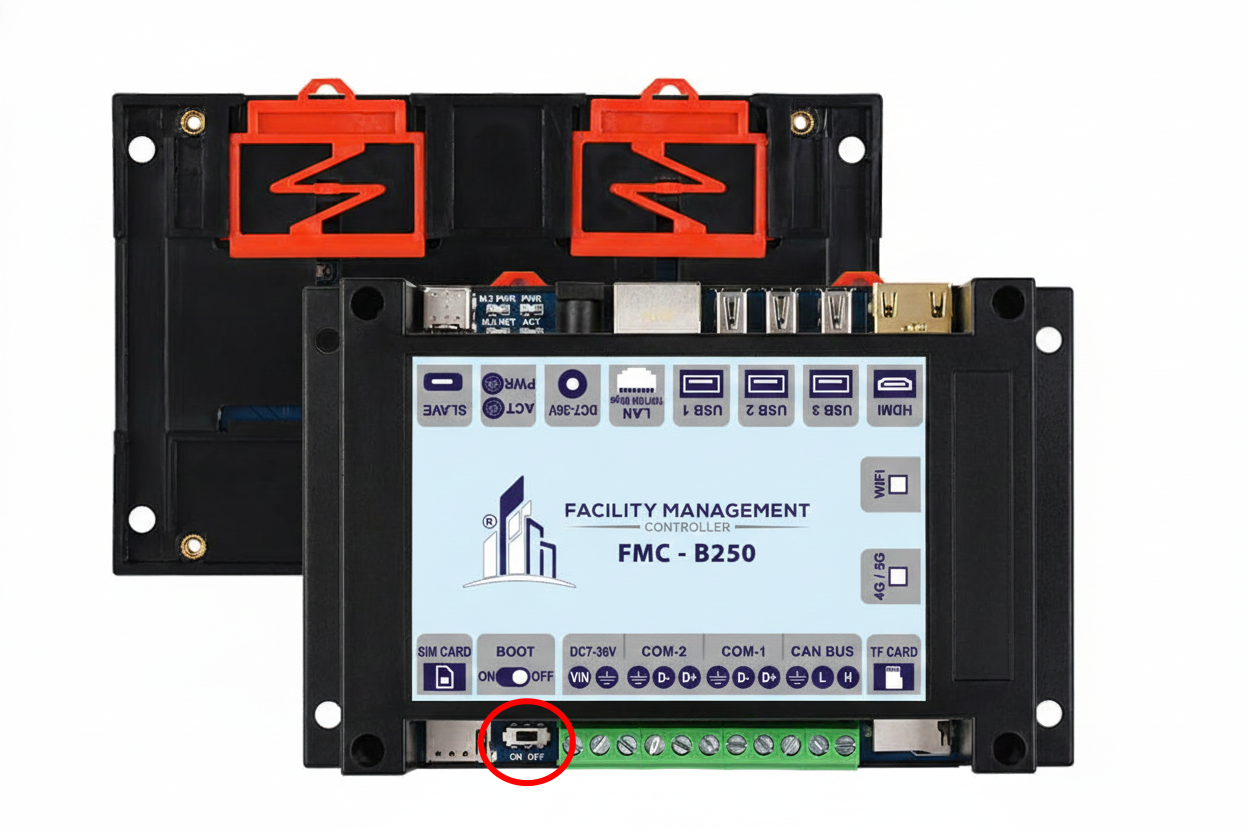
To access a controller, use a computer or tablet connected to the same network.
Open your web browser and navigate to https://192.168.1.50/ (Note: If your browser displays a self-signed certificate warning, please accept it to proceed).
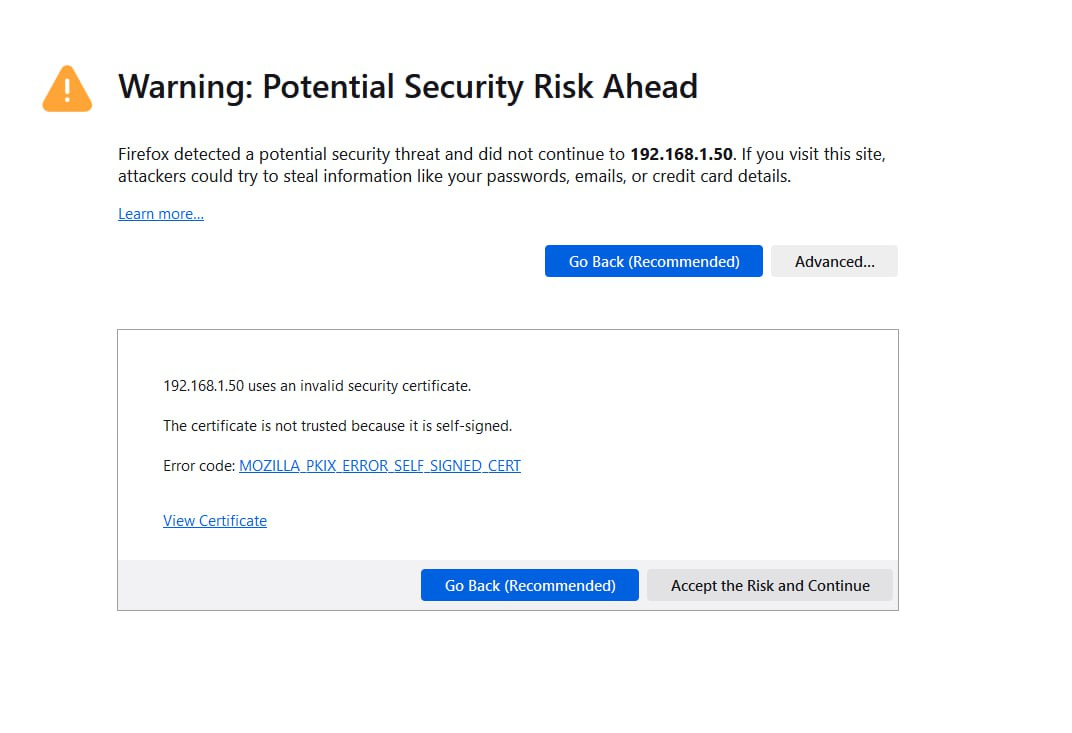
Every controller comes with a default user account with the username superuser and password superuser. This account is granted all permissions, cannot be deactivated.
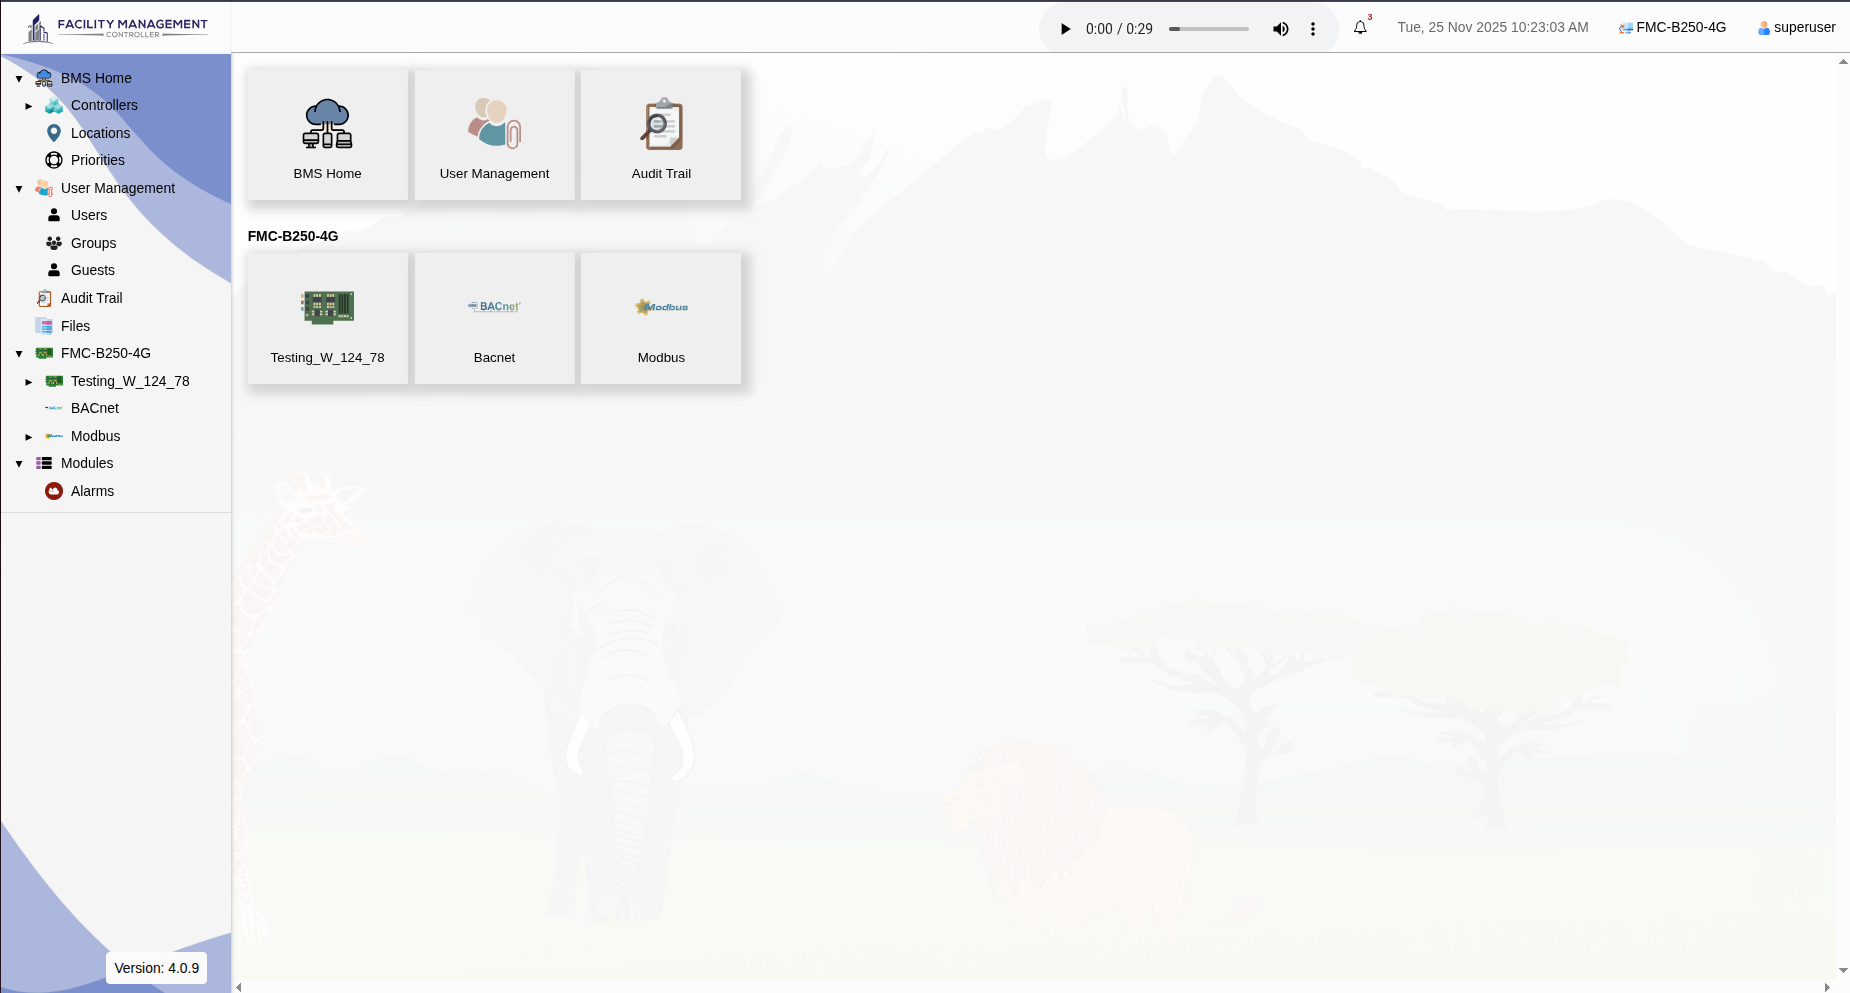
Follow these steps to link a controller to a cloud workspace.
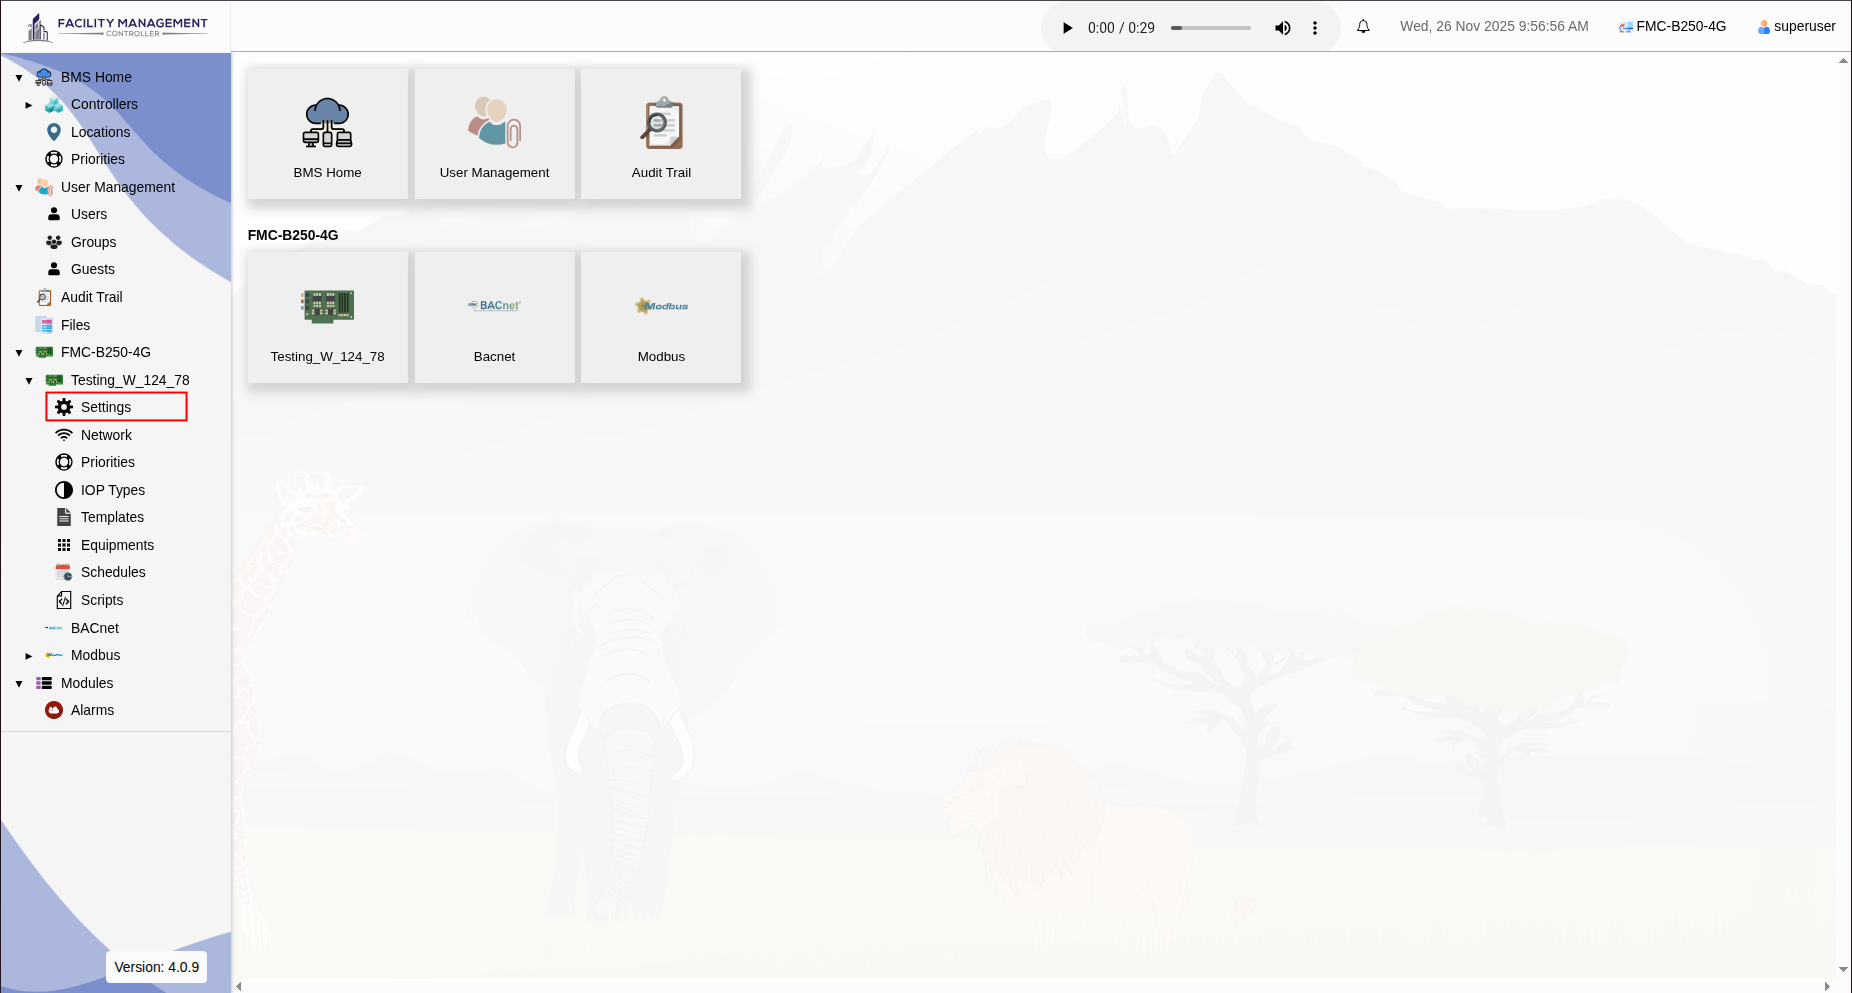
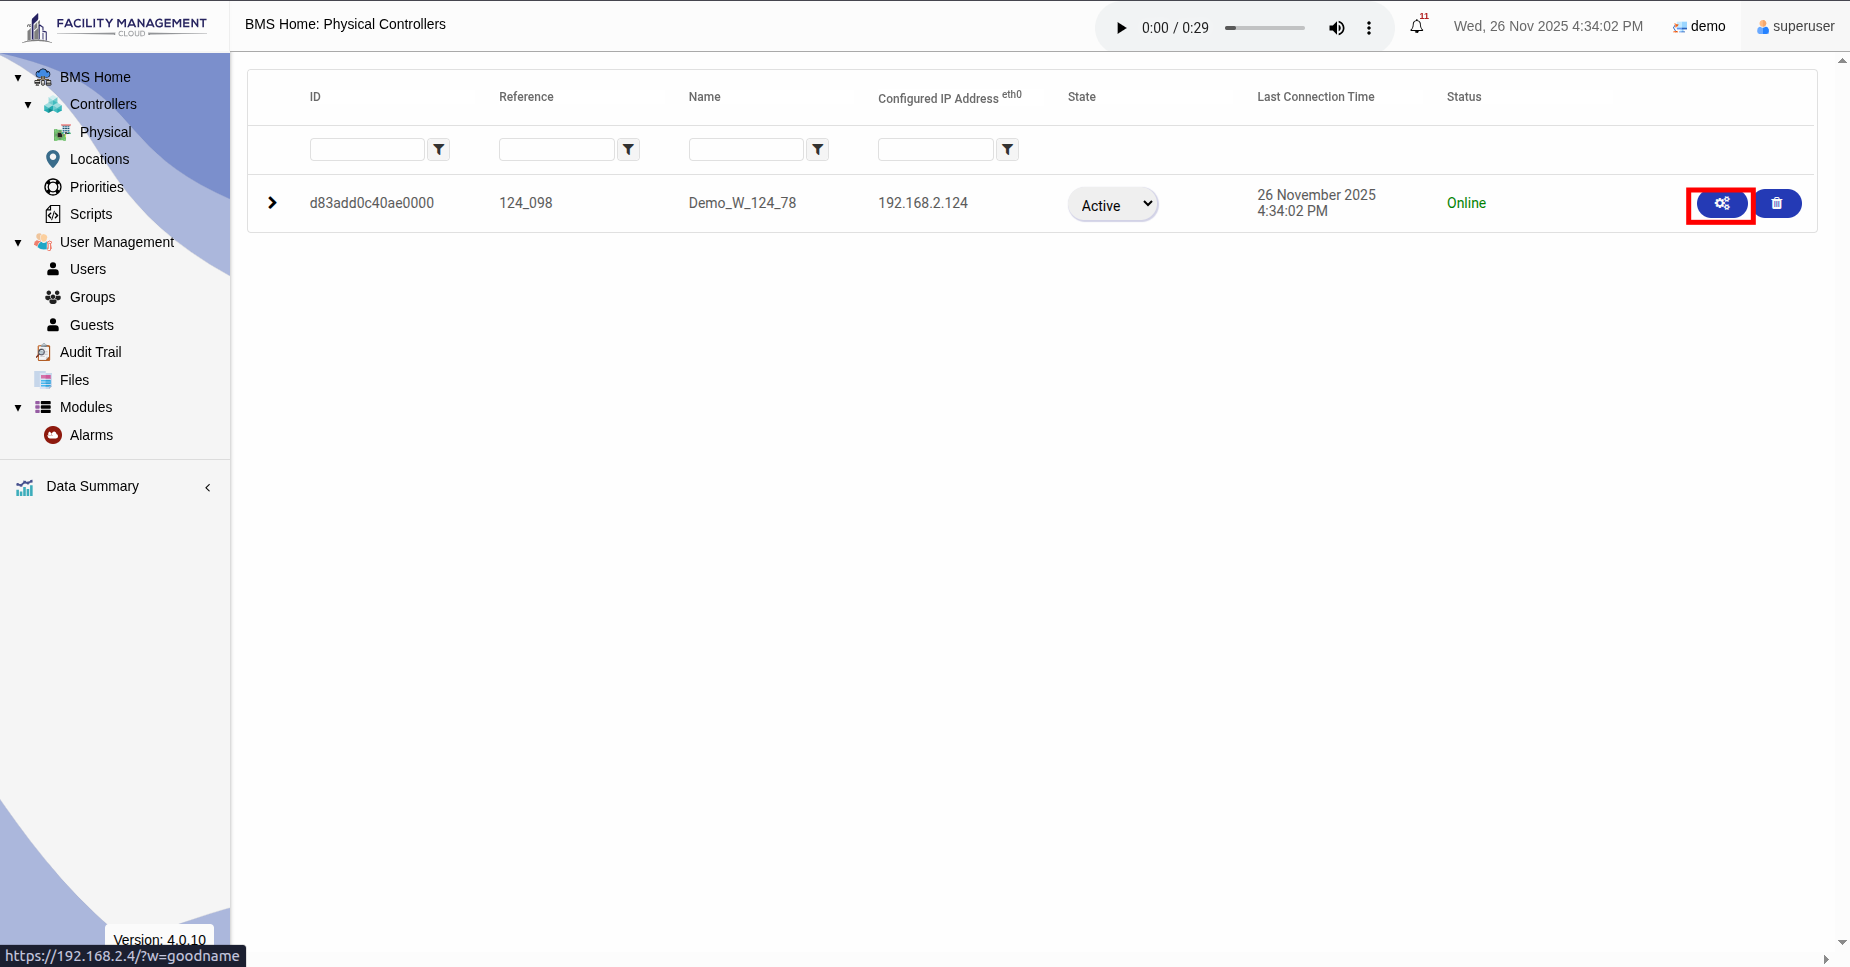
A workspace is an abstract space hosted in a domain, owned by a customer into which users login to access the features of the system.
The cloud workspace is a central, internet-accessible environment hosted on FMCC servers. It is designed for organisation-wide oversight, long-term data storage, advanced analytics, and multi-site coordination. All controllers that are linked to the cloud, feed their data into this workspace, and all high-level user interactions (dashboards, reports, CMMS, etc) take place here. A cloud workspace is mandatory for any cloud-based features.
The FMCC cloud infrastructure is distributed across multiple servers, each hosting specific workspaces on dedicated subdomains (e.g., my1.fmcc.io, my2.fmcc.io).
Despite this distributed architecture, user access is seamless:
Authentication in FMCC ensures that only authorised individuals can access workspaces, controllers, and system features. The platform supports both basic username/password authentication, and single sign-on (SSO).
To access a controller locally, ensure that your device is connected to the same local subnet as the controller.
| Username | superuser |
|---|---|
| Password | superuser |
To log in using a specific workspace credentials:
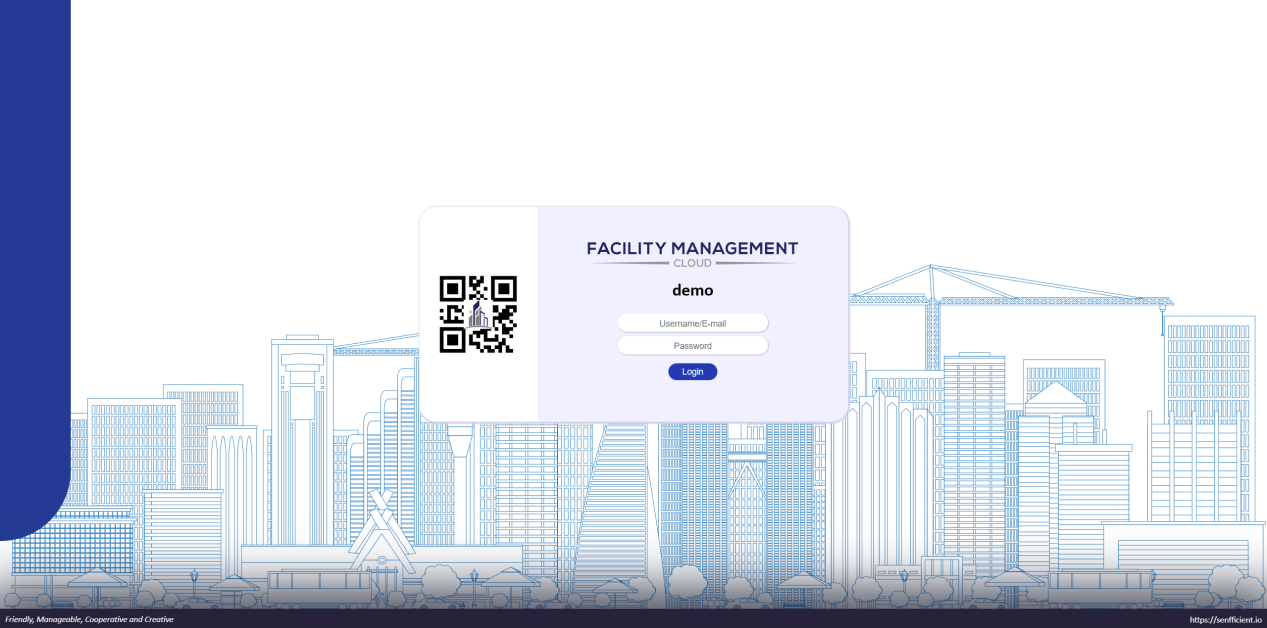
Forgot Password? Self-service password reset is not available at this time. Please contact any of the workspace users who have the authority to change passwords to reset your credentials.
Single sign-on allows users to authenticate using a verified email address. This enables access to multiple FMCC cloud workspaces without using separate credentials for each workspace.
Before using SSO, you must verify your email address with the FMCC system.
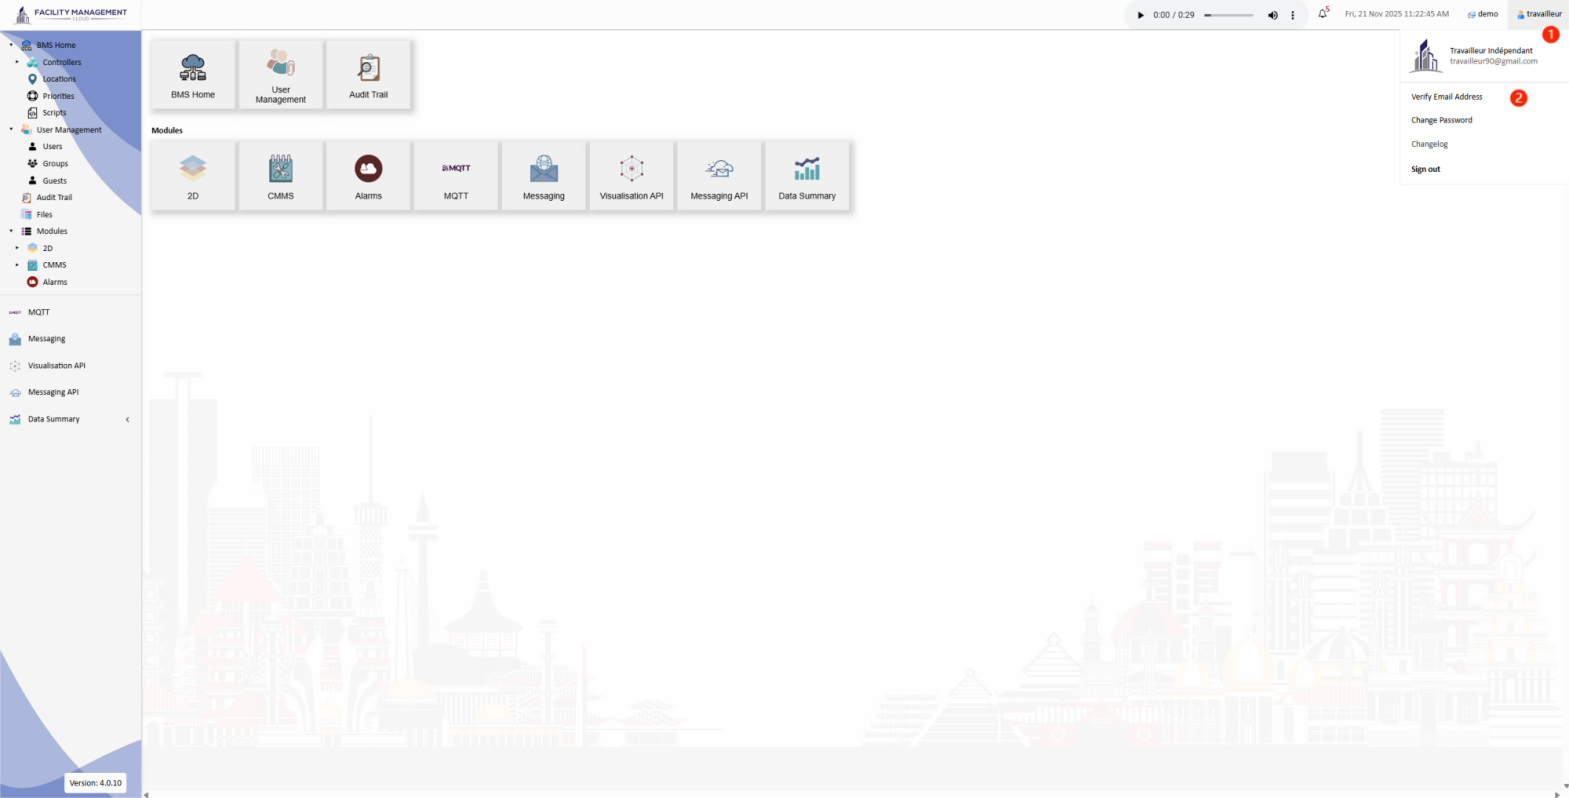
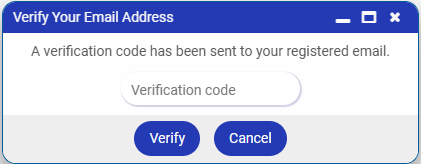
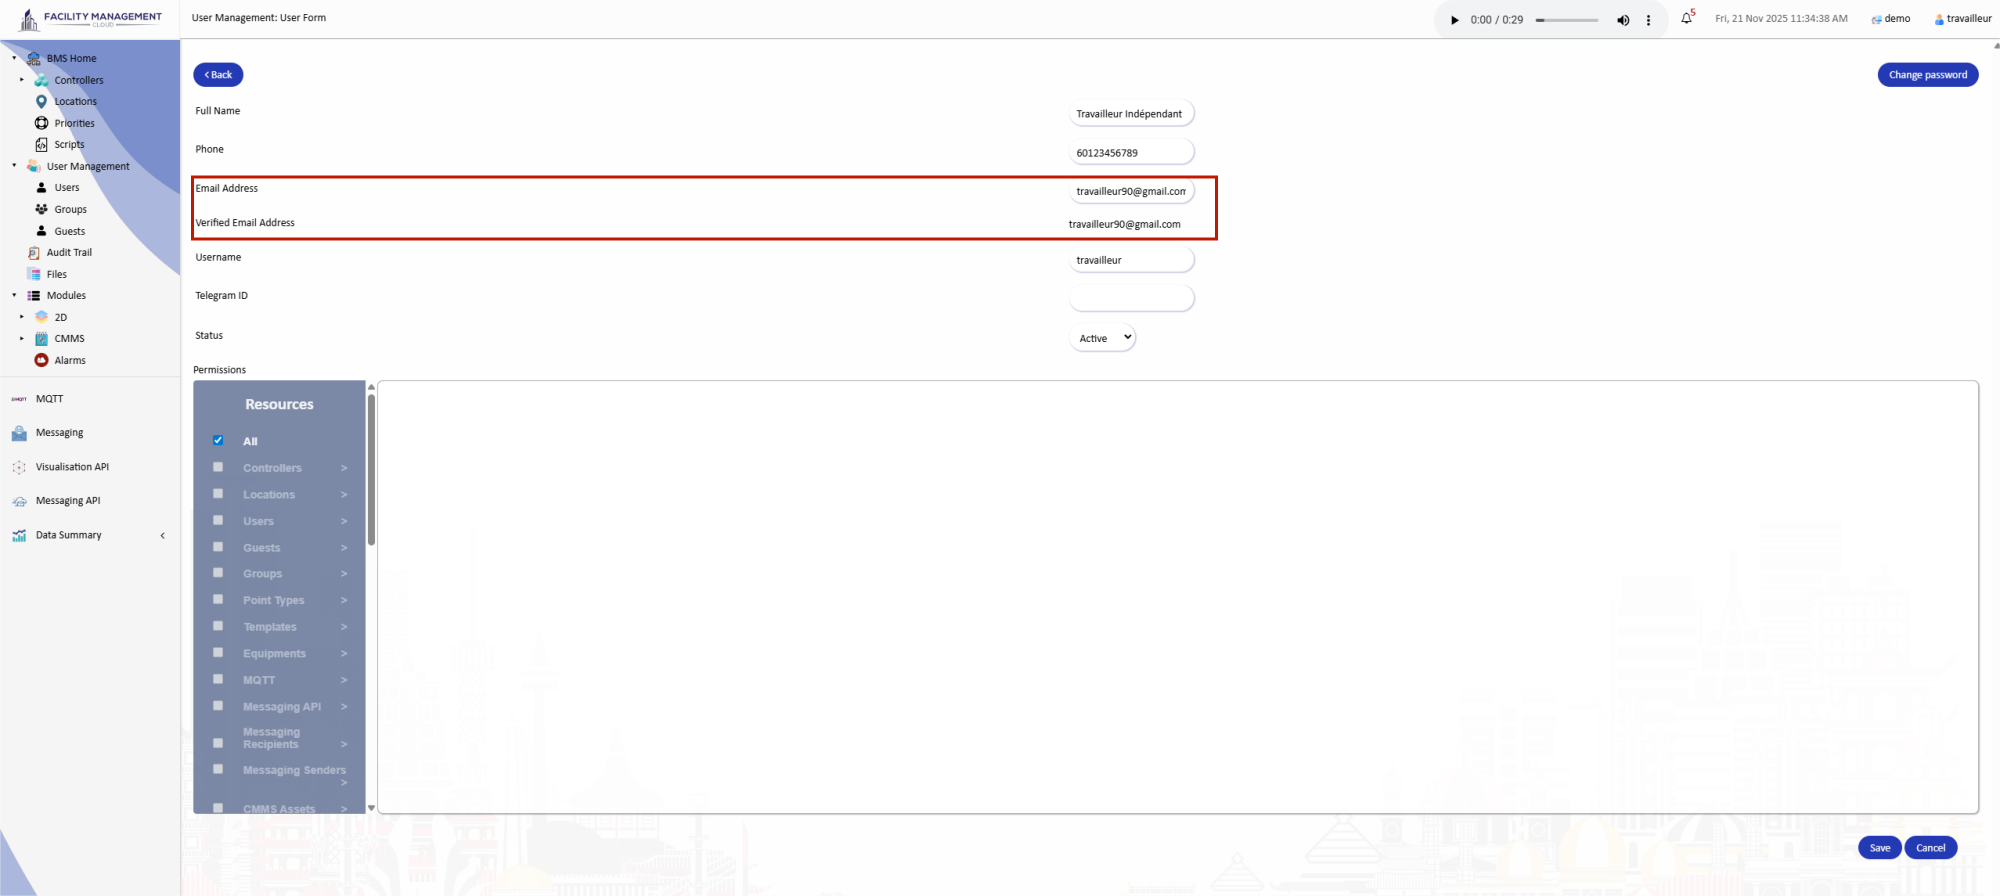
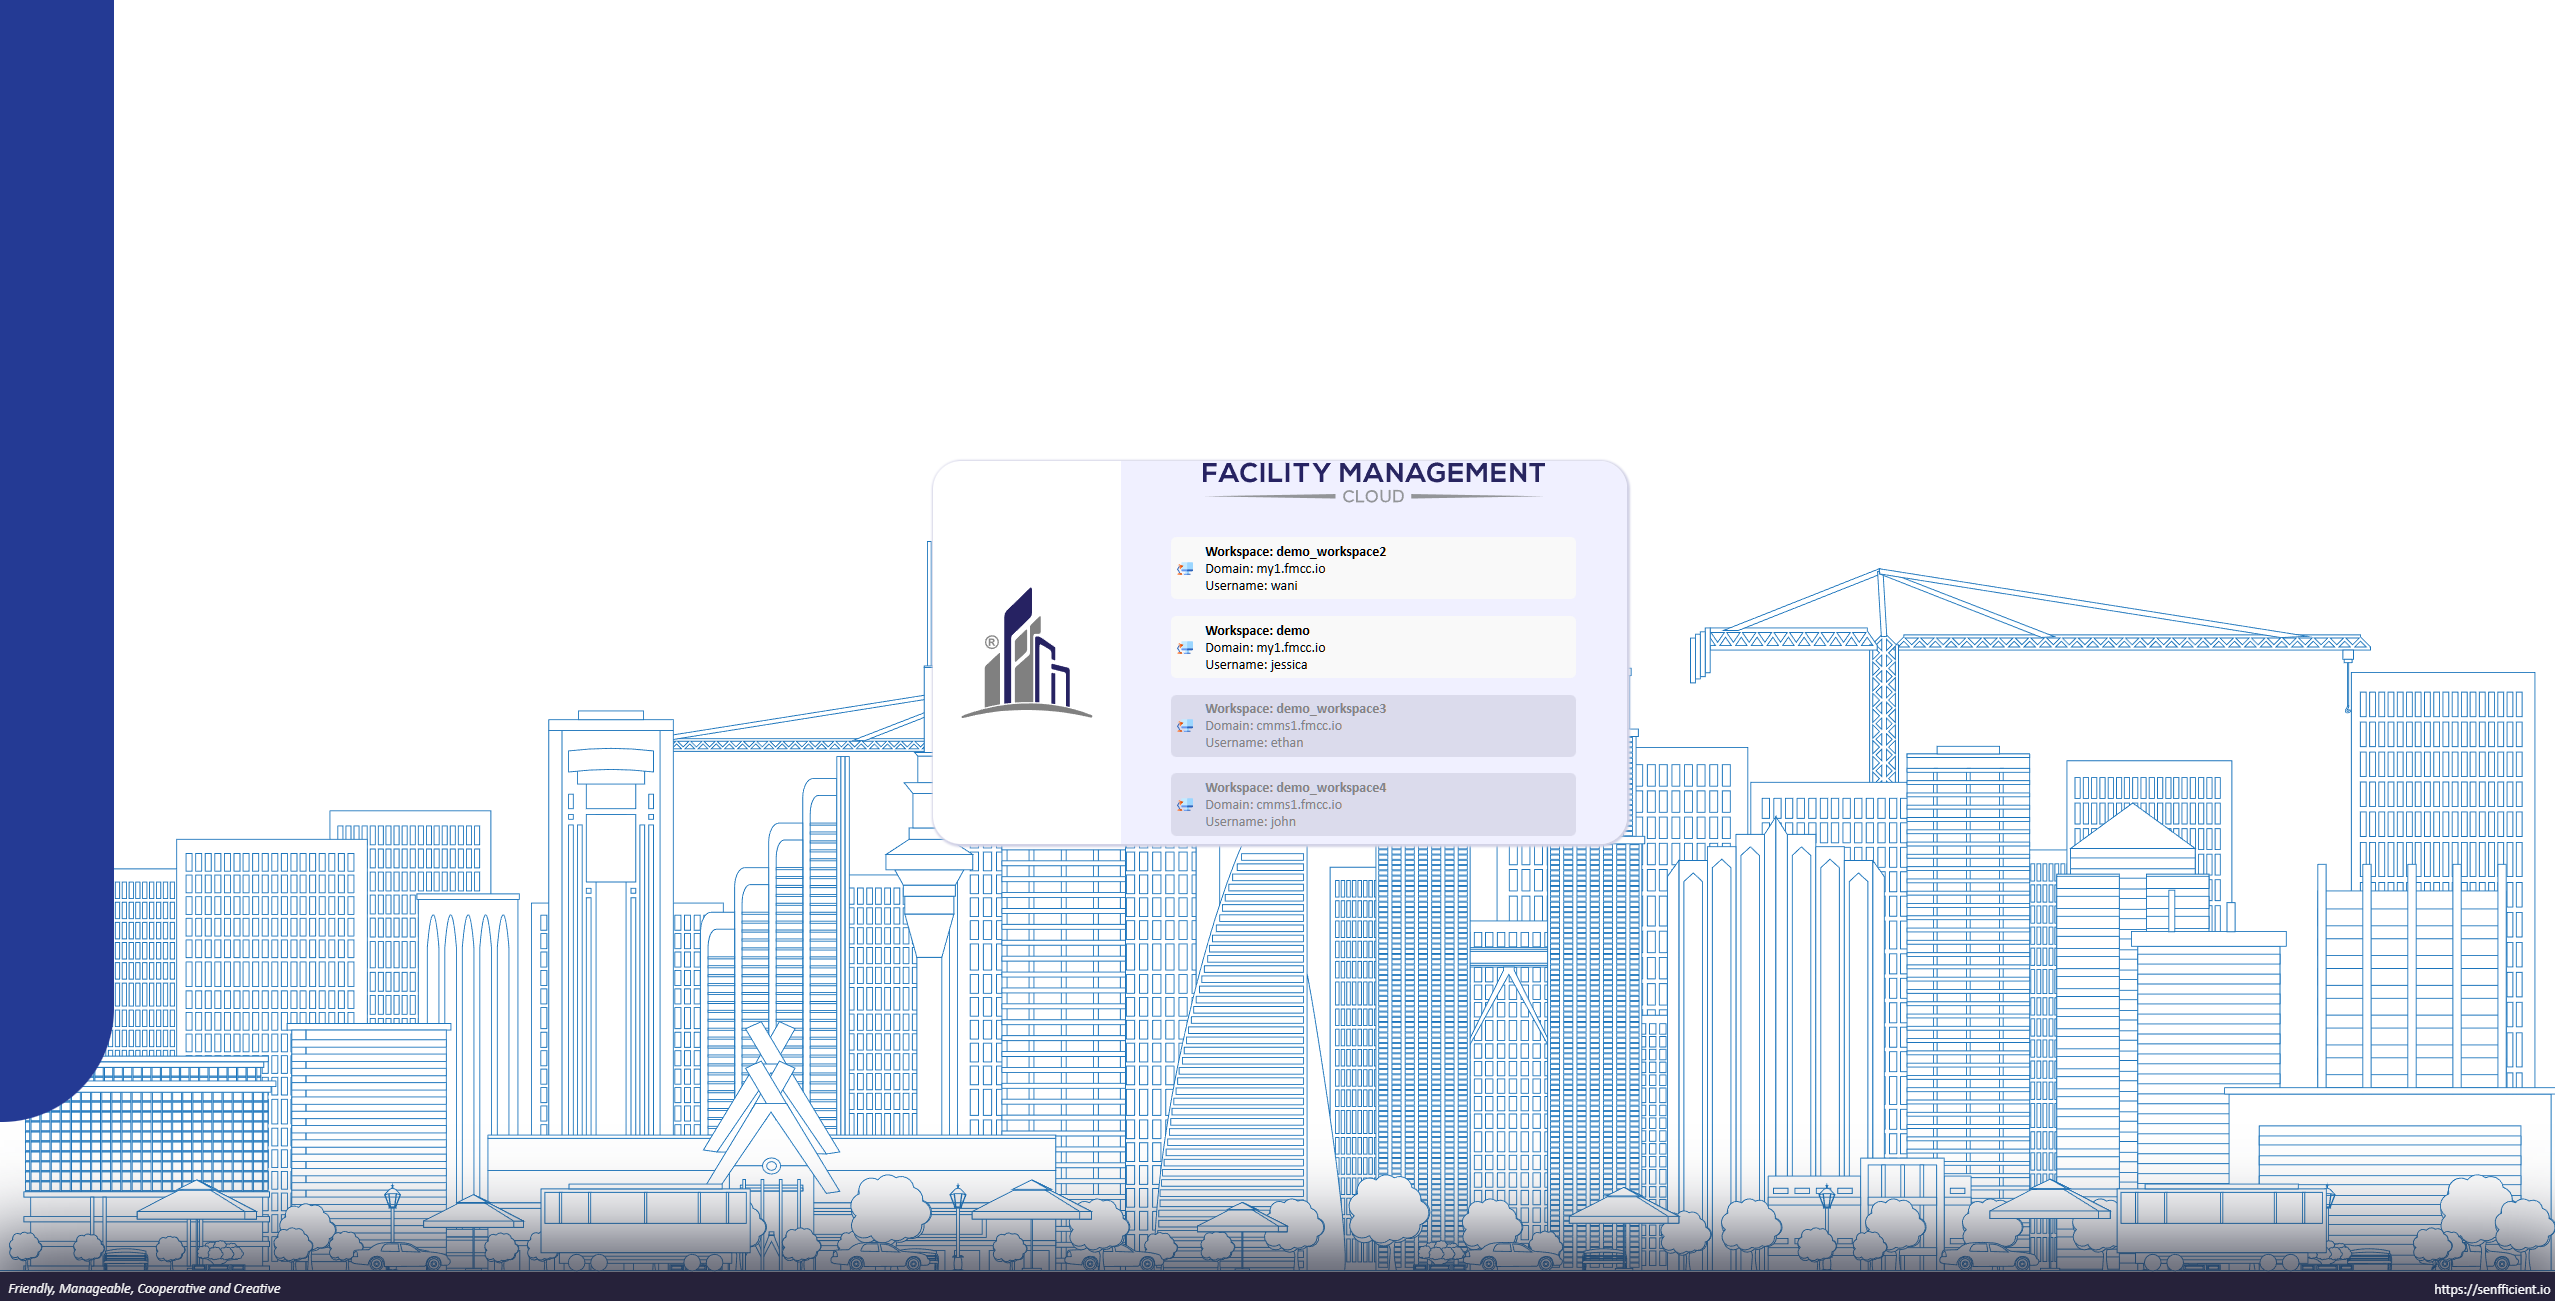
Users with access to multiple workspaces can switch to another workspace directly without logging out and logging in again.
Facility Management Cloud & Controller (FMCC) is a comprehensive facility-management system designed to centralise and optimise both soft services (e.g., cleaning, security) and hard services (e.g., HVAC, lighting, building infrastructure) across an organisation. It comprises two main parts: (1) a cloud-hosted application platform; and (2) physical controllers deployed on-site that connect to I/O devices (sensors/actuators) to capture values, log data and send control signals to field equipment.
The controller is an on-site embedded device equipped with a web-based runtime environment. It interfaces with field I/O modules using industrial protocols such as BACnet and Modbus to acquire sensor data, execute polling cycles, and issue control signals to equipment.
Its embedded application provides a local UI for configuring I/O mappings, polling parameters, automation logic, and device settings. The controller also supports on-device features including data logging, alarm handling, status visualisation, and basic autonomous control routines that can continue operating even without cloud connectivity.
When connected to the cloud platform, the controller offloads compute-intensive workloads and long-term storage, enabling advanced analytics, cross-site coordination, and higher-level automation beyond the limits of its local hardware.
The cloud platform serves as the central orchestration, processing and data management layer of FMCC. It provides resilience by handling long-term storage, heavy computation, and multi-site coordination, effectively compensating for the resource constraints of edge controllers.
It provides a unified backend that enables centralised monitoring and control of all deployed controllers, removing the need to manage each site individually. Users gain secure remote access to system dashboards, controls from any location and gain operational insights.
The cloud layer scales seamlessly as additional controllers, and sensor networks are deployed. With scalable computation and centralised historical data, the cloud can execute far more complex processing and analytics, enabling advanced features that strengthen and extend the overall system capabilities.
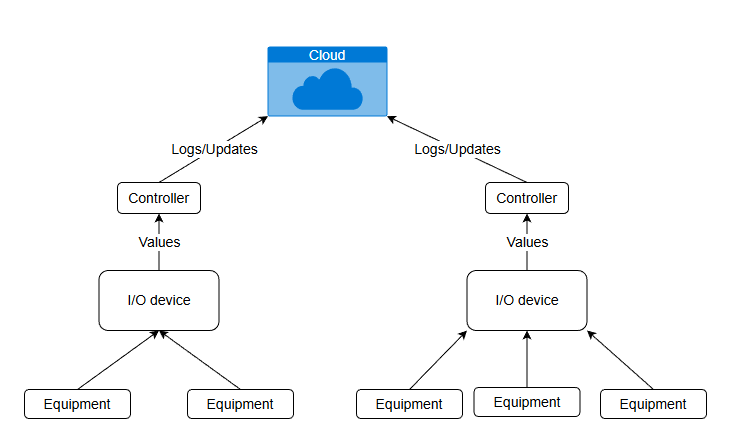
The controller reads the values from I/O devices that are connected to an equipment (field devices) through industrial standard protocols and logs the values into the controller. If the controller is connected to a cloud server, configuration updates and log data are sent to the cloud.
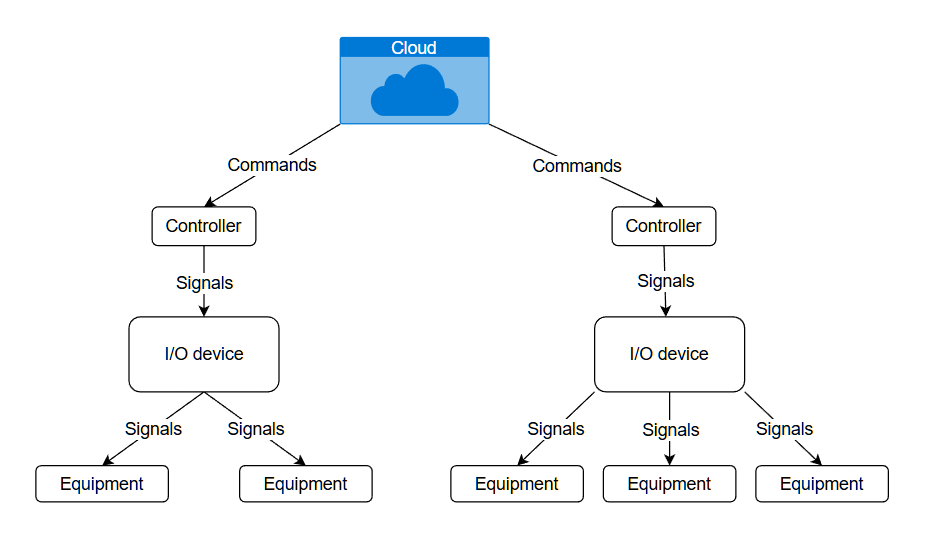
When users access into a cloud platform, they can send control commands to controllers that are connected to the cloud server. The command from server received by the controllers are then executed, sending control signals to I/O devices to set the values of the equipments.